
This release is a pre-release and may not be stable for production use.
Python Wrappers for R scripts in bioinformatic analysis
This file will become your README and also the index of your documentation.
Install
pip install pyrwrapper
Plot Venn Diagram
faker.py venn-plot tests/venn.png \
    --lists tests/list1.txt tests/list2.txt tests/list3.txt tests/list4.txt \
    --tags ALL_file withpy withdot withgo  \
    --print-mode raw
Then you will get four files: tests/venn.png, tests/venn.png.R,tests/venn.png.R.e,tests/venn.png.R.o.
tests/venn.png is the graph you want
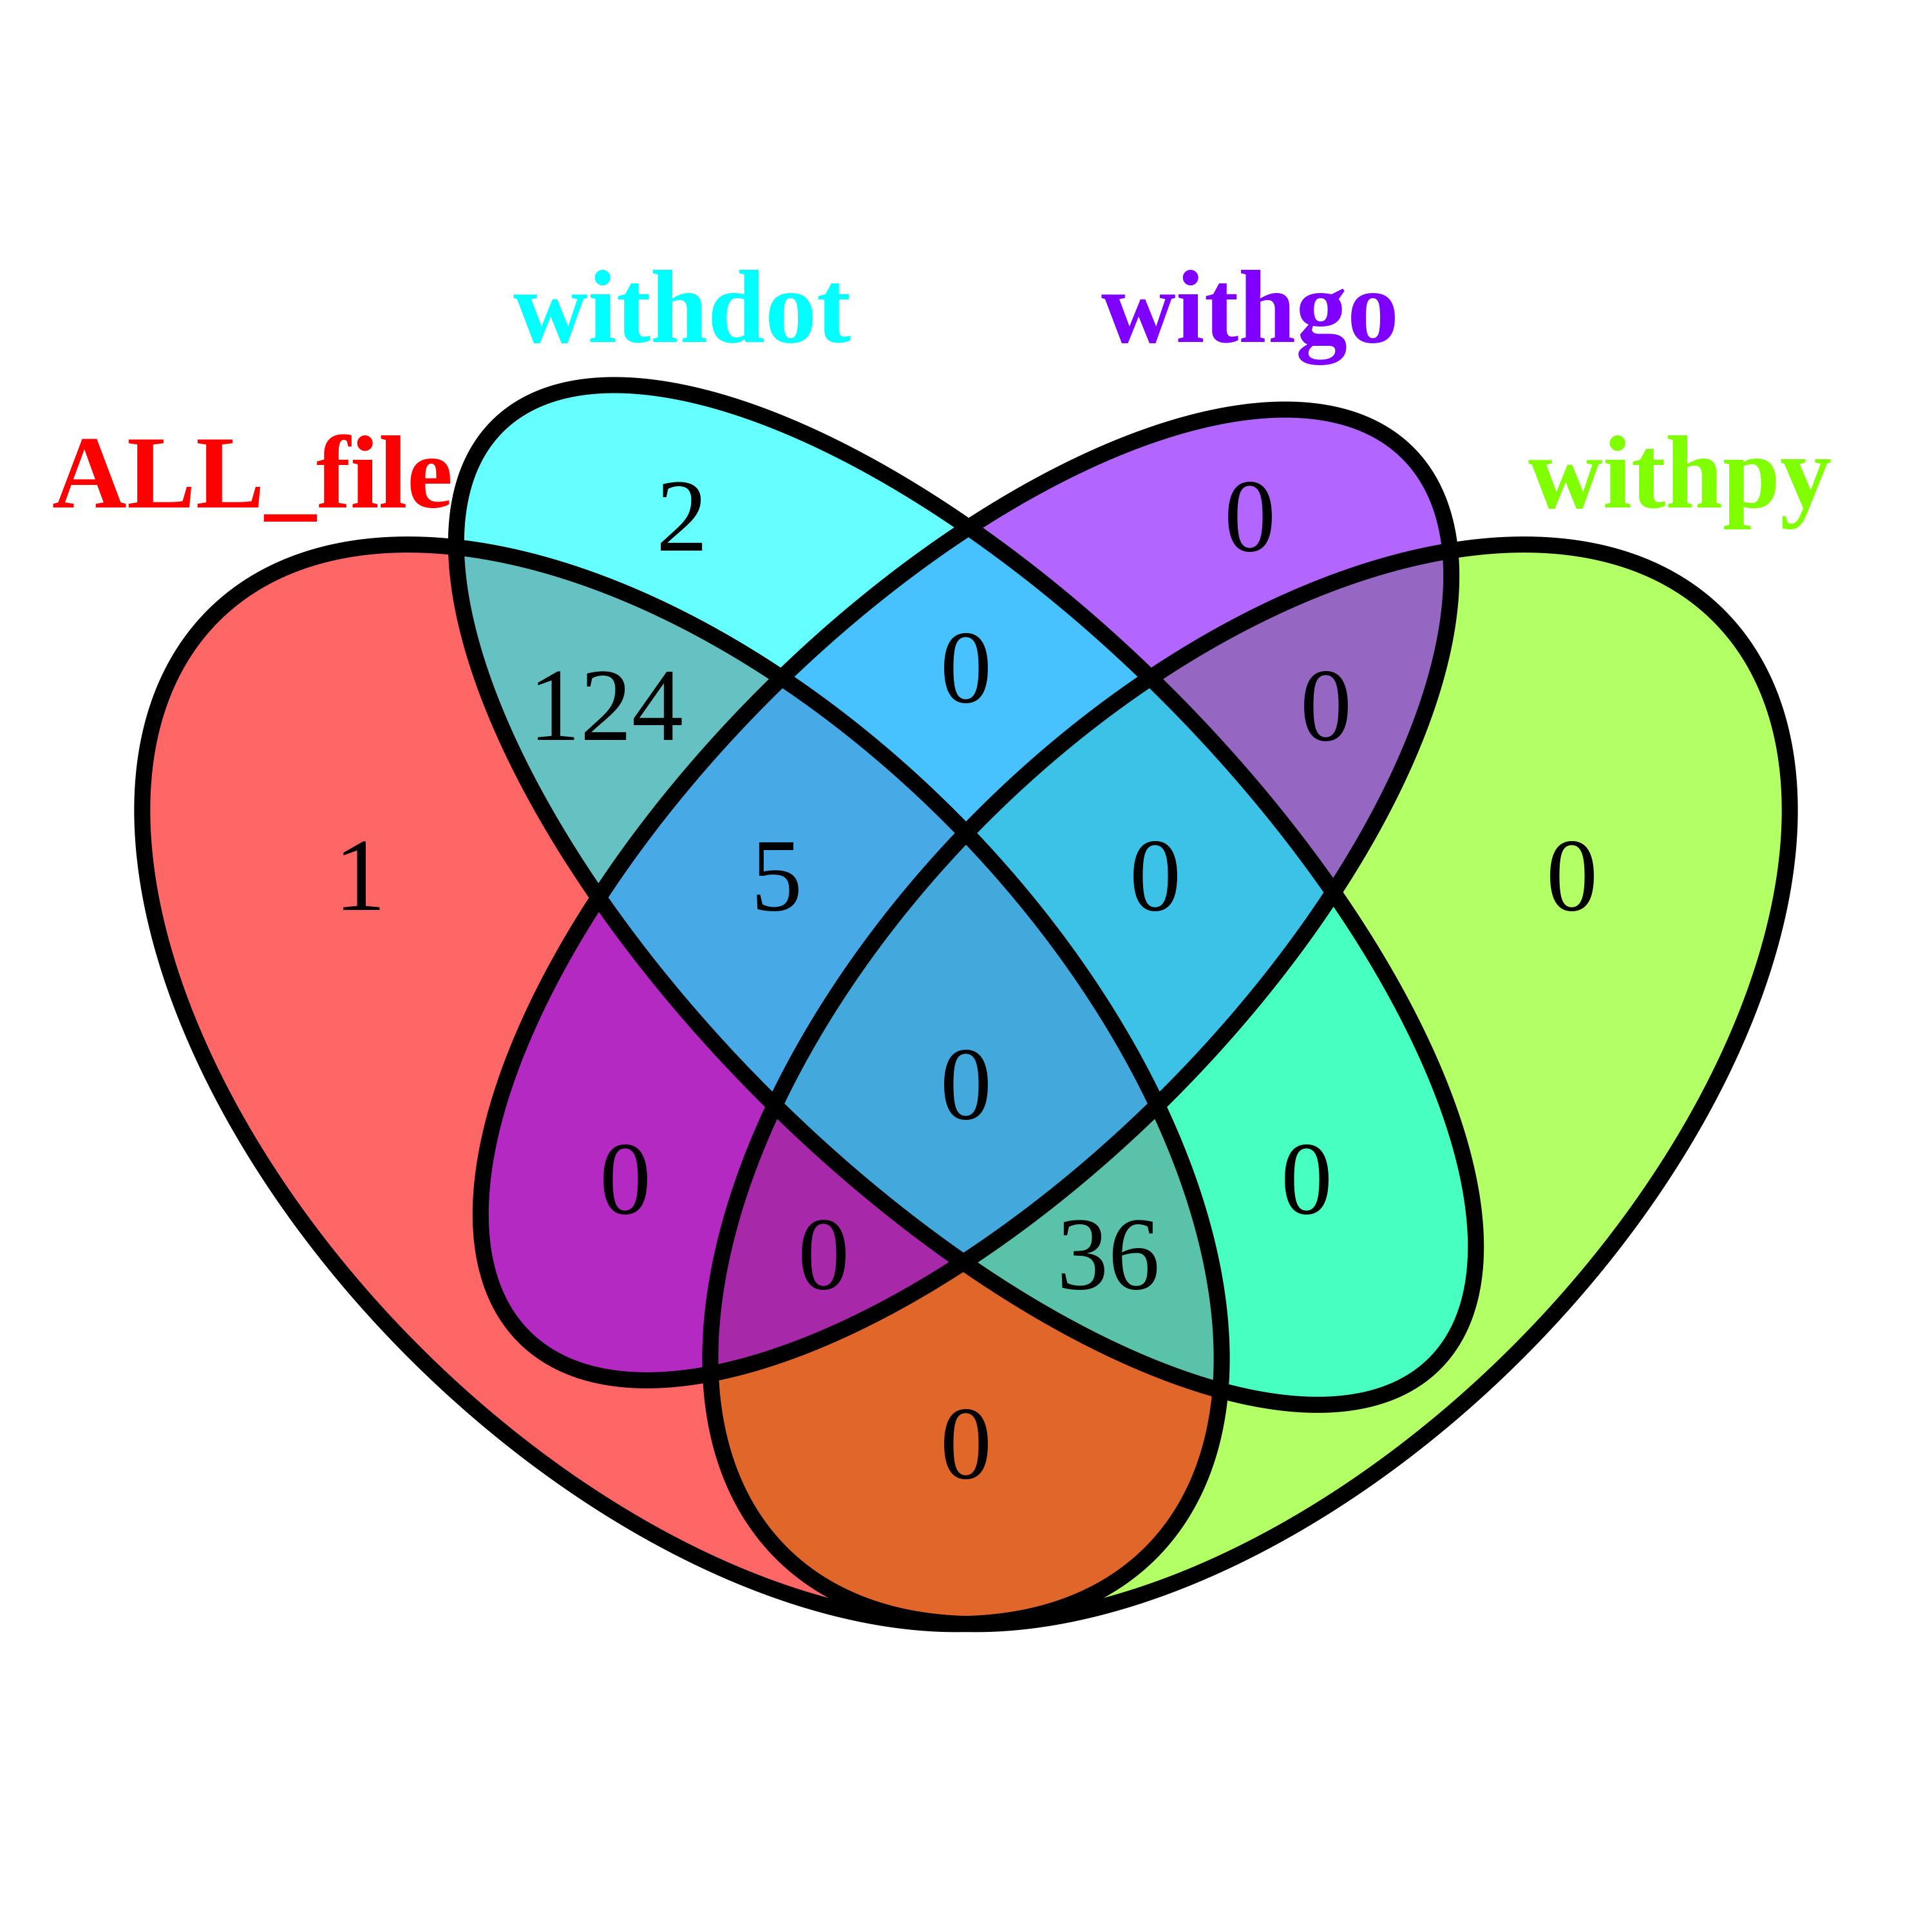
tests/venn.png.R is the R script, if you want to modify and re-run the script, it will be easy.
tests/venn.png.R.e and tests/venn.png.R.o is the stderr and stdout of running tests/venn.png.R.
parameters
faker.py venn-plot


usage: faker.py venn-plot [-h] -l [LISTS [LISTS ...]] --tags [TAGS [TAGS ...]]
                          [--title TITLE] [-s SUB_TITLE]
                          [-p [PRINT_MODE [PRINT_MODE ...]]] [-r RSCRIPT]
                          output

venn diagram plot

positional arguments:
  output                figure output, the formats could be 'png','tiff','pdf'

optional arguments:
  -h, --help            show this help message and exit
  -l [LISTS [LISTS ...]], --lists [LISTS [LISTS ...]]
                        lists file without title
  --tags [TAGS [TAGS ...]]
                        tags corresponding to lists, the length of lists and tags should be the same
  --title TITLE         graph title
                        (default: Venn Diagram)
  -s SUB_TITLE, --sub-title SUB_TITLE
                        graph subtitle
                        (default: )
  -p [PRINT_MODE [PRINT_MODE ...]], --print-mode [PRINT_MODE [PRINT_MODE ...]]
                        could only be 'raw' or 'percent' or ('raw' and  'percent')
                        (default: ['raw', 'percent'])
  -r RSCRIPT, --rscript RSCRIPT
                        the path of Rscript
                        (default: /usr/bin/env Rscript)
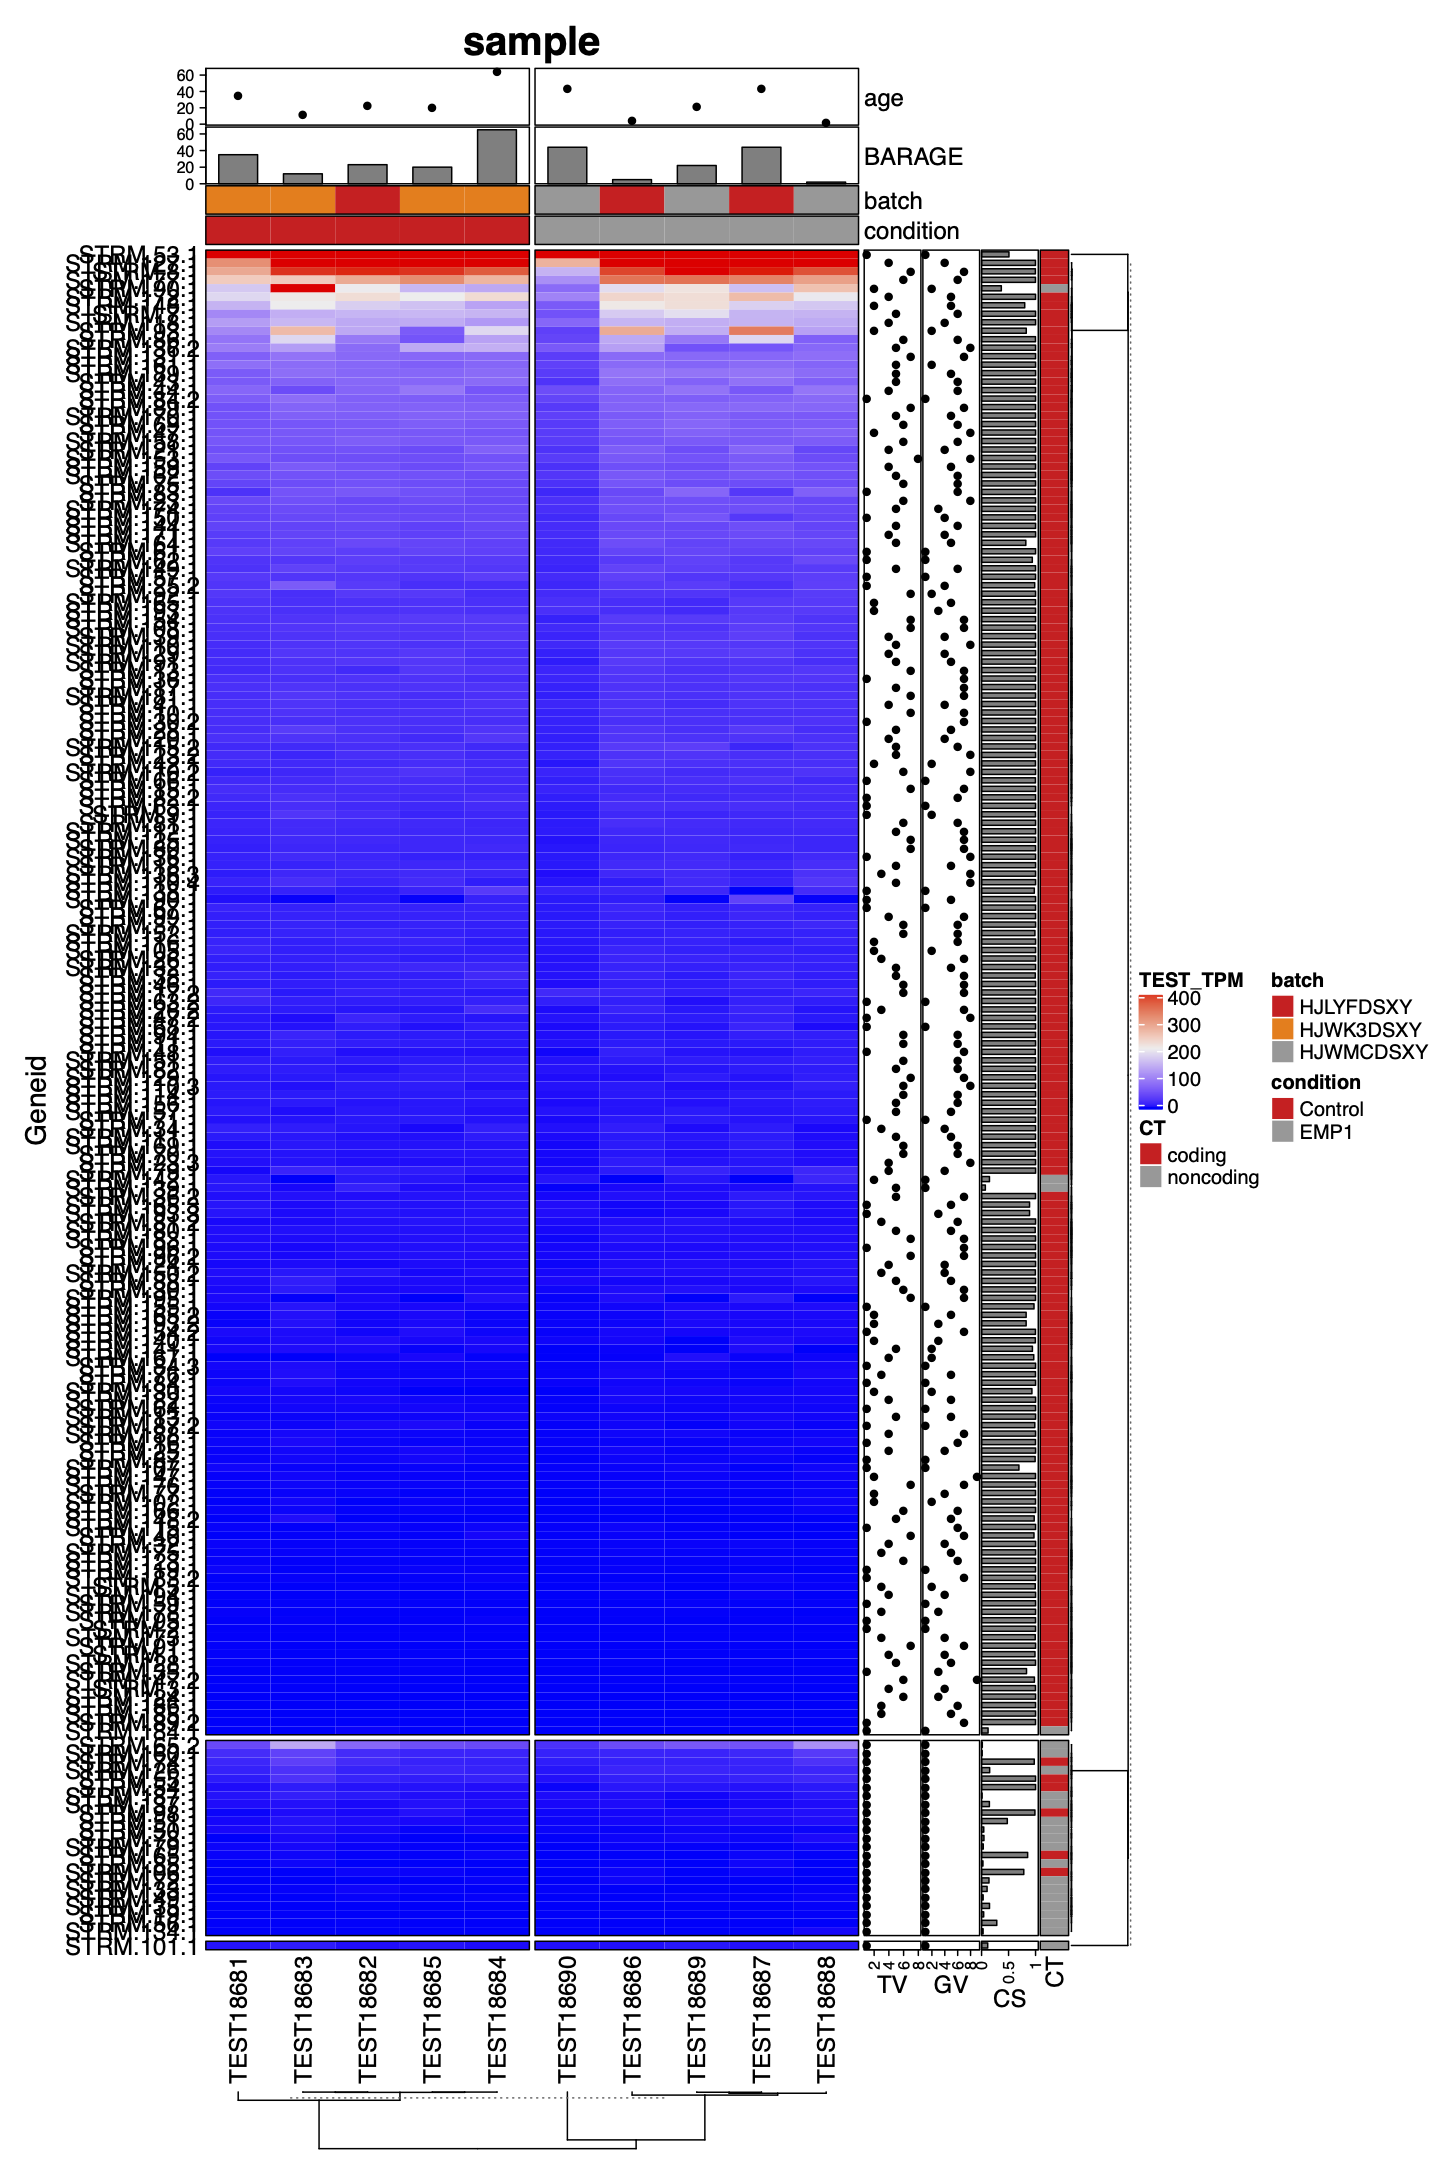
Plot complex heatmap
faker.py complexheatmap-plot tests/ch.pdf tests/matrix.csv tests/sample_info.csv \
        -m Geneid \
        --c-idx sample \
        -v TEST_TPM \
        --row-split-by gene_biotype \
        --col-split-by condition \
        --row-anno-point TV:transcript_version GV:gene_version \
        --row-anno-bar CS:coding_score \
        --row-anno-normal CT:classification \
        --col-anno-point age \
        --col-anno-bar BARAGE:age \
        --col-anno-normal batch condition \
        -t tests \
        --sep-mi , \
        --sep-ci , \
        --rscript '/usr/bin/env Rscript'
Then you will get four files: tests/ch.pdf, tests/complexheatmap.R,tests/complexheatmap.R.e,tests/complexheatmap.R.o and two temporary files m.csv, c.csv
tests/ch.pdf is the graph you want
parameters
faker.py complexheatmap-plot

usage: faker.py complexheatmap-plot [-h] -m M_IDX --c-idx C_IDX
                                    [--show-row-names] [--no-show-row-names]
                                    [--show-column-names]
                                    [--no-show-column-names] [-v VALUE_NAME]
                                    [-w WIDTH] [--height HEIGHT]
                                    [--row-split-by ROW_SPLIT_BY]
                                    [--col-split-by COL_SPLIT_BY]
                                    [--row-anno-point [ROW_ANNO_POINT [ROW_ANNO_POINT ...]]]
                                    [--row-anno-bar [ROW_ANNO_BAR [ROW_ANNO_BAR ...]]]
                                    [--row-anno-normal [ROW_ANNO_NORMAL [ROW_ANNO_NORMAL ...]]]
                                    [--col-anno-point [COL_ANNO_POINT [COL_ANNO_POINT ...]]]
                                    [--col-anno-bar [COL_ANNO_BAR [COL_ANNO_BAR ...]]]
                                    [--col-anno-normal [COL_ANNO_NORMAL [COL_ANNO_NORMAL ...]]]
                                    [--sep-mi SEP_MI] [--sep-ci SEP_CI]
                                    [-t TMP] [--rscript RSCRIPT]
                                    output matrix_in clinical_in

ComplextHeatmap plot

positional arguments:
  output                figure output, the formats could only be 'pdf'
  matrix_in             heatmap input data
  clinical_in           clinical input data

optional arguments:
  -h, --help            show this help message and exit
  -m M_IDX, --m-idx M_IDX
                        heatmap index column name, e.g. 'geneid'
  --c-idx C_IDX         clinical index column name, which are used to identify the data columns in heatmap matrix
  --show-row-names      whether to show row names, if row number are too large, maybe not show.
                        (default: True)
  --no-show-row-names
  --show-column-names   whether to show column names, if row number are too large, maybe not show.
                        (default: True)
  --no-show-column-names
  -v VALUE_NAME, --value-name VALUE_NAME
                        value name in the matrix, e.g. 'count', 'TPM'
                        (default: TPM)
  -w WIDTH, --width WIDTH
                        width of the figure
                        (default: 10)
  --height HEIGHT       height of the figure
                        (default: 15)
  --row-split-by ROW_SPLIT_BY
                        can specific split rows into different blocks by specific column in the matrix data, e.g. 'Pathway of genes'
                        (default: None)
  --col-split-by COL_SPLIT_BY
                        can specific split columns into different blocks by specific column in the clinical data, e.g. 'condition'
                        (default: None)
  --row-anno-point [ROW_ANNO_POINT [ROW_ANNO_POINT ...]]
                        can specific annotate row by point plot, you can also specify the name of annotation by log2fc:foldchange, e.g. 'foldchange' 'pvalue'
                        (default: None)
  --row-anno-bar [ROW_ANNO_BAR [ROW_ANNO_BAR ...]]
                        can specific annotate row by bar plot,you can also specify the name of annotation by name:colname, e.g. 'flodchange' 'pvalue'
                        (default: None)
  --row-anno-normal [ROW_ANNO_NORMAL [ROW_ANNO_NORMAL ...]]
                        can specific annotate row by condition,you can also specify the name of annotation by name:colname, e.g. 'biotype'
                        (default: None)
  --col-anno-point [COL_ANNO_POINT [COL_ANNO_POINT ...]]
                        can specific annotate column by point plot, you can also specify the name of annotation by name:colname, e.g. 'age'
                        (default: None)
  --col-anno-bar [COL_ANNO_BAR [COL_ANNO_BAR ...]]
                        can specific annotate column by bar plot, you can also specify the name of annotation by name:colname,  e.g. 'age'
                        (default: None)
  --col-anno-normal [COL_ANNO_NORMAL [COL_ANNO_NORMAL ...]]
                        can specific annotate column by condition, you can also specify the name of annotation by name:colname,  e.g. 'gender'
                        (default: None)
  --sep-mi SEP_MI       separation in matirx file
                        (default:       )
  --sep-ci SEP_CI       separation in clinical file
                        (default:       )
  -t TMP, --tmp TMP     temporary direction
                        (default: ./)
  --rscript RSCRIPT     Rscript path
                        (default: /usr/bin/env Rscript)
MuSiC deconvolution
faker.py music-deconvolution \
        -c cell_type  \
        --samples sample \
        -t tests \
        tests/bulk_count.csv \
        tests/sc_count.csv \
        tests/bulk_info.csv \
        tests/sc_info.csv \
        tests/music.csv
Then we will get a deconvolution results as here
parameters
usage: faker.py music-deconvolution [-h] -c CLUSTER --samples SAMPLES
                                    [--select-ct [SELECT_CT [SELECT_CT ...]]]
                                    [--bulk-filter BULK_FILTER]
                                    [--sc-filter SC_FILTER]
                                    [--bulk-count-sep BULK_COUNT_SEP]
                                    [--sc-count-sep SC_COUNT_SEP]
                                    [--bulk-info-sep BULK_INFO_SEP]
                                    [--sc-info-sep SC_INFO_SEP] [-t TMP]
                                    [-r RSCRIPT]
                                    bulk_count sc_count bulk_info sc_info
                                    output

Multi-subject Single Cell deconvolution  (MuSiC github.com/xuranw/MuSiC)

positional arguments:
  bulk_count            bulk RNA-seq count data, first columns should be the gene identification(unique)
  sc_count              single-cell RNA-seq count data, first columns should be the gene identification(unique) same as bulk_count
  bulk_info             bulk RNA-seq information
  sc_info               single-cell RNA-seq information: samples, cell type ,etc. The first column should be the cell identification.
  output                will write the result out in .csv format

optional arguments:
  -h, --help            show this help message and exit
  -c CLUSTER, --cluster CLUSTER
                        column name of cell type in sc_info
  --samples SAMPLES     column name of sample name in sc_info, (need to know the single cell source, from which sample)
  --select-ct [SELECT_CT [SELECT_CT ...]]
                        cell types to deconvolution
                        (default: NULL)
  --bulk-filter BULK_FILTER
                        bulk RNA-seq depth filter
                        (default: 20)
  --sc-filter SC_FILTER
                        single-cell RNA-seq depth filter
                        (default: 20)
  --bulk-count-sep BULK_COUNT_SEP
                        bulk_count file separation
                        (default: ,)
  --sc-count-sep SC_COUNT_SEP
                        single-cell count file separation
                        (default: ,)
  --bulk-info-sep BULK_INFO_SEP
                        bulk_info file separation
                        (default: ,)
  --sc-info-sep SC_INFO_SEP
                        single-cell info file separation
                        (default: ,)
  -t TMP, --tmp TMP     temporary file direction
                        (default: ./)
  -r RSCRIPT, --rscript RSCRIPT
                        Rscript path
                        (default: /usr/bin/env Rscript)
1 maintainer

Metadata
1 maintainer
Release files for pyrwrapper 0.0.1rc4
For a detailed explanation of source distributions (sdists) and built distributions (wheels), please see the package formats documentation.
Source distribution (sdist)
| File | Size | Uploaded | |
|---|---|---|---|
| pyrwrapper-0.0.1rc4.tar.gz | 19.7 kB | Details |
Built distribution (wheel)
| File | Interpreter | ABI | Platform | Reset |
|---|---|---|---|---|
| pyrwrapper-0.0.1rc4-py3-none-any.whl | Python 3 | none | any | Details |
Total release size: 39.3 kB
Release files / pyrwrapper-0.0.1rc4.tar.gz
| Download URL | pyrwrapper-0.0.1rc4.tar.gz |
|---|---|
| Size | 19.7 kB |
| Tags | Source |
|
SHA-256 checksum How to use checksums |
4dcbfc8c644ca3fc5e24334debcaa7407df8ea2acbe0c0eb3781525cd4ba520f
|
|
BLAKE2b-256 checksum How to use checksums |
ff1855d52c7c87f5efa40d712059d9d9f6262823e899be8bdceaa2e521921113
|
| Upload date | |
|
Uploaded using Trusted Publishing? What is trusted publishing? |
No |
| Uploaded via |
twine/3.2.0 pkginfo/1.6.1 requests/2.25.0 setuptools/47.1.0 requests-toolbelt/0.9.1 tqdm/4.53.0 CPython/3.7.9
|
Release files / pyrwrapper-0.0.1rc4-py3-none-any.whl
| Download URL | pyrwrapper-0.0.1rc4-py3-none-any.whl |
|---|---|
| Size | 19.6 kB |
| Tags | Python 3 |
|
SHA-256 checksum How to use checksums |
37577dc0a469c70f47f0926290c72389d10f034657a827173ba77365f4ead75b
|
|
BLAKE2b-256 checksum How to use checksums |
ac9fe52772ff4af149004f866d9d04a8270311280c505f71173329a1ca0a1405
|
| Upload date | |
|
Uploaded using Trusted Publishing? What is trusted publishing? |
No |
| Uploaded via |
twine/3.2.0 pkginfo/1.6.1 requests/2.25.0 setuptools/47.1.0 requests-toolbelt/0.9.1 tqdm/4.53.0 CPython/3.7.9
|














