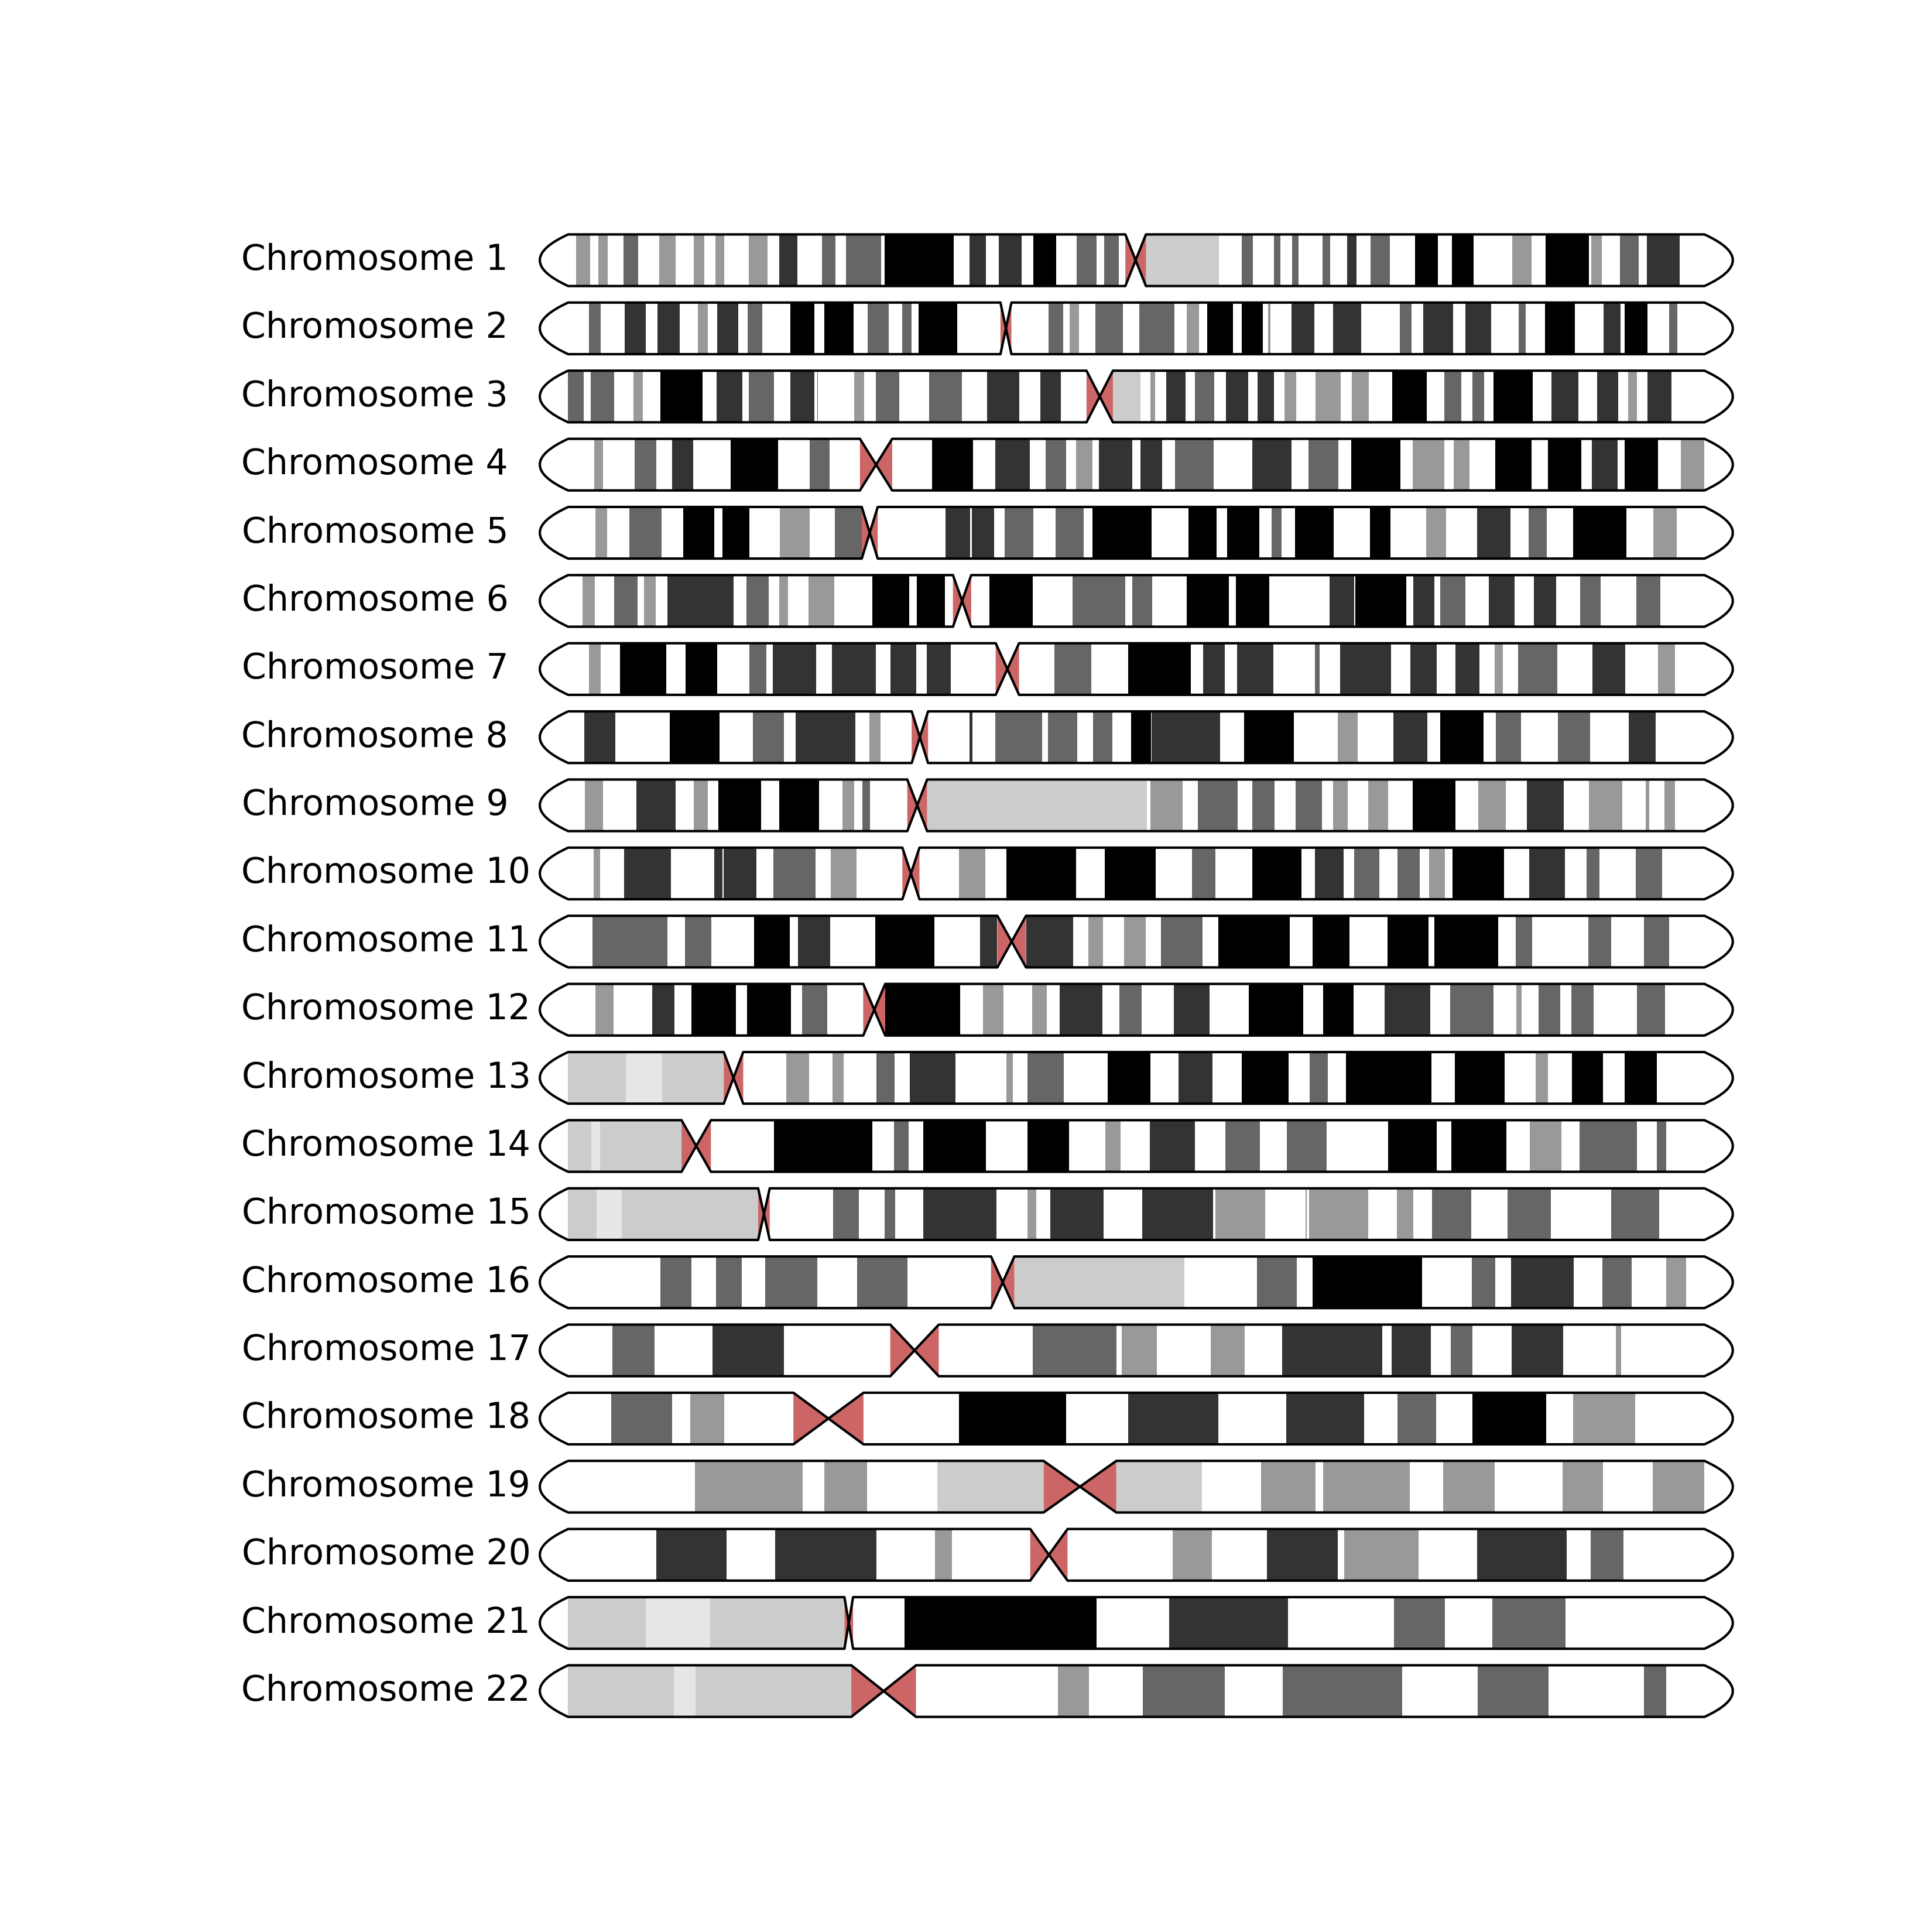
Draw an ideogram of either HG38 or CHM13 contigs in a matplotlib axes object.

Project description
pyryotype


Table of Contents
Acknowledgements
Huge shout out to Ryan Dale (@daler) for the original work on the Ideograms - https://gist.github.com/daler/c98fc410282d7570efc3 And @alexomics for the ground work on the coverage plotting and ideograms.
Installation
pip install ideogram
Example usage
from pyryotype import GENOME, plot_ideogram
from matplotlib import pyplot as plt
fig, axes = plt.subplots(
    ncols=1,
    nrows=22,
    figsize=(11, 11),
    facecolor="white",
)
genome = GENOME.CHM13
for ax, contig_name in zip(axes, range(1, 23)):
    chromosome = f"chr{contig_name}"
    plot_ideogram(ax, target=chromosome, genome=genome)
fig.savefig("ideogram.png", dpi=300)
Will output:
You want vertical? We got vertical
With Regions highlighted on Chromosome 1 - Optional! See the following testing code snippet for an example def test_23_vertical_chm13_regions()
Will output

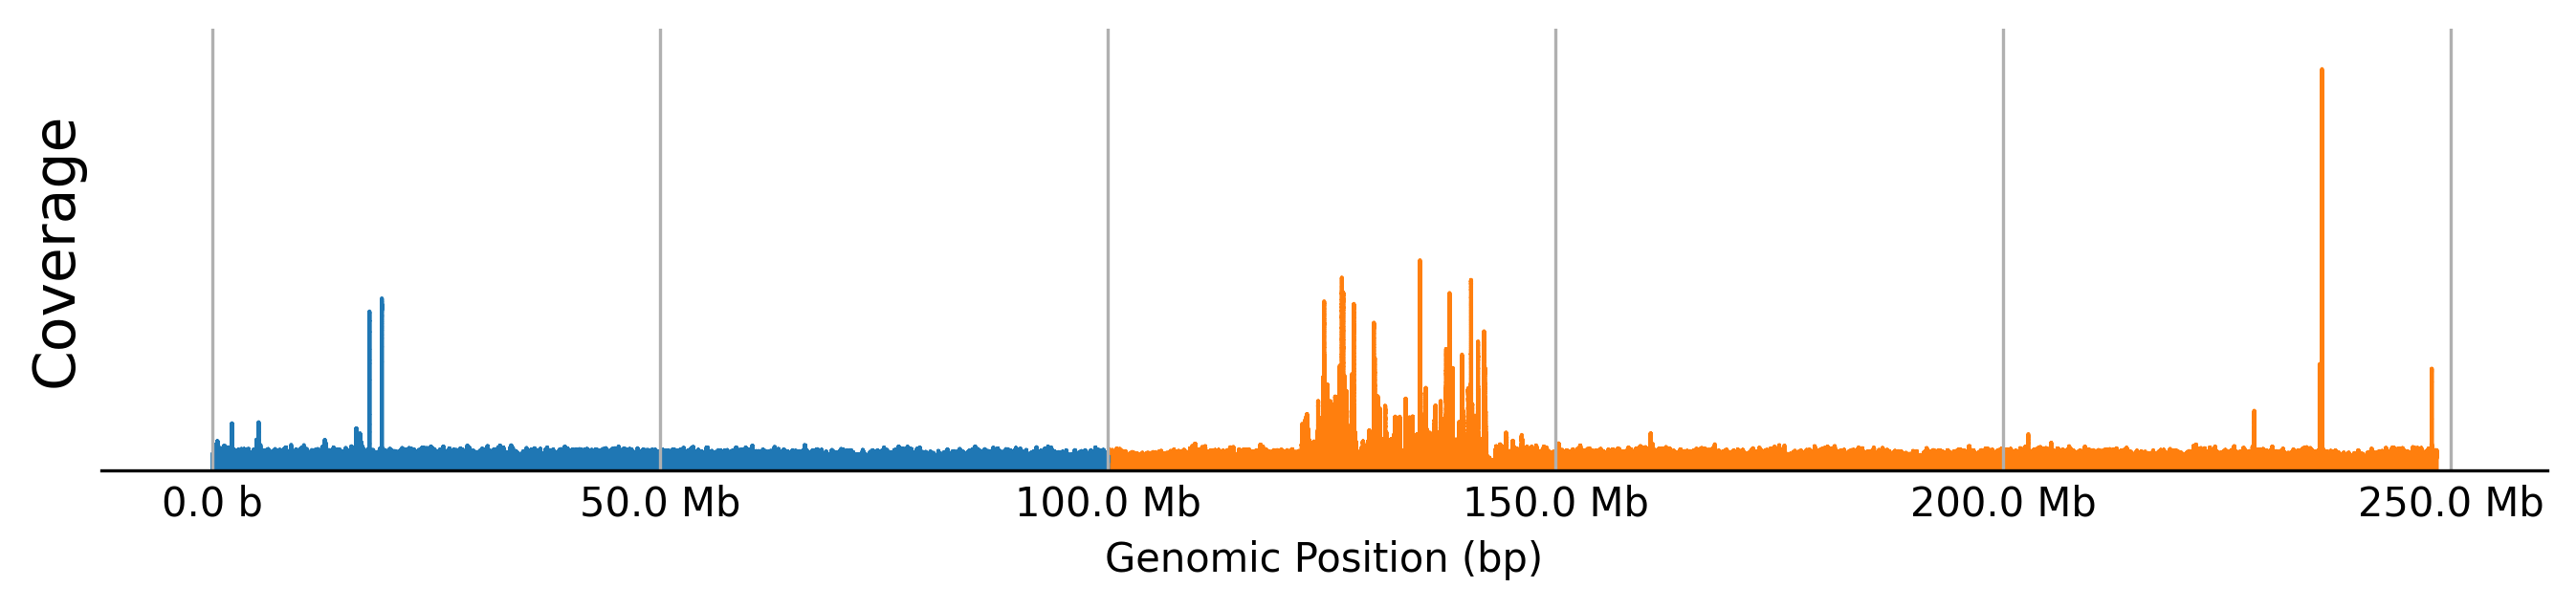
Coverage plotting
Coverage plotting is designed to be used with the output of Mosdepth. The following example uses the output of mosdepth to plot the coverage of chromosome 1. The region representing the first 100Mb of the chromosome is highlighted in black.
from pathlib import Path
from matplotlib import pyplot as plt
from matplotlib.ticker import EngFormatter
import pandas as pd

from pyryotype.coverage import plot_coverage


test_cov_file = Path(__file__).parent / "static" / "chr1_cov.regions.bed.gz"

fig, ax = plt.subplots(
    ncols=1,
    nrows=1,
    figsize=(11, 2),
)
df = pd.read_csv(test_cov_file, sep="\t", names=["chromosome", "start", "end", "value"])
ax = plot_coverage(ax, df, "chr1", regions=[(0, 100000000)], ylabel="Coverage", color="black")
ax.set_xlabel("Genomic Position (bp)")

# ax.yaxis.set_visible(False)
ax.set_yticks([])
ax.set_yticklabels([])
for side in ("right", "top", "left"):
    ax.spines[side].set_visible(False)
formatter = EngFormatter(unit='b', places=1)
# Set formatter for the x-axis
ax.xaxis.set_major_formatter(formatter)

fig.savefig("example_outputs/test_coverage.png", dpi=300, bbox_inches="tight")
Will output something like:
PAF plotting
Designed primarily to plot the alignment of assemblies to a reference genome. Must provide a valid PAF file.
from matplotlib import pyplot as plt
from readpaf import parse_paf
from pathlib import Path
from pyryotype.paf_plotting import PAFProtocol, PlotMode, plot_paf_alignments
test_paf = Path(__file__).parent / "static" / "test.paf"
fig, ax = plt.subplots(
    ncols=1,
    nrows=1,
    figsize=(11, 1),
)

ax = plot_paf_alignments(
    ax,
    parse_paf(test_paf.open()),
    target="chr1",
    mapq_filter=0,
    strict=PlotMode.STRICT,
    contig_colours=PlotMode.UNIQUE_COLOURS,
)
ax.set_xlabel("")

# ax.yaxis.set_visible(False)
ax.set_yticks([])
ax.set_yticklabels([])
for side in ("right", "top", "left"):
    ax.spines[side].set_visible(False)
fig.savefig("tests/test_paf_plotting.png", dpi=300, bbox_inches="tight")
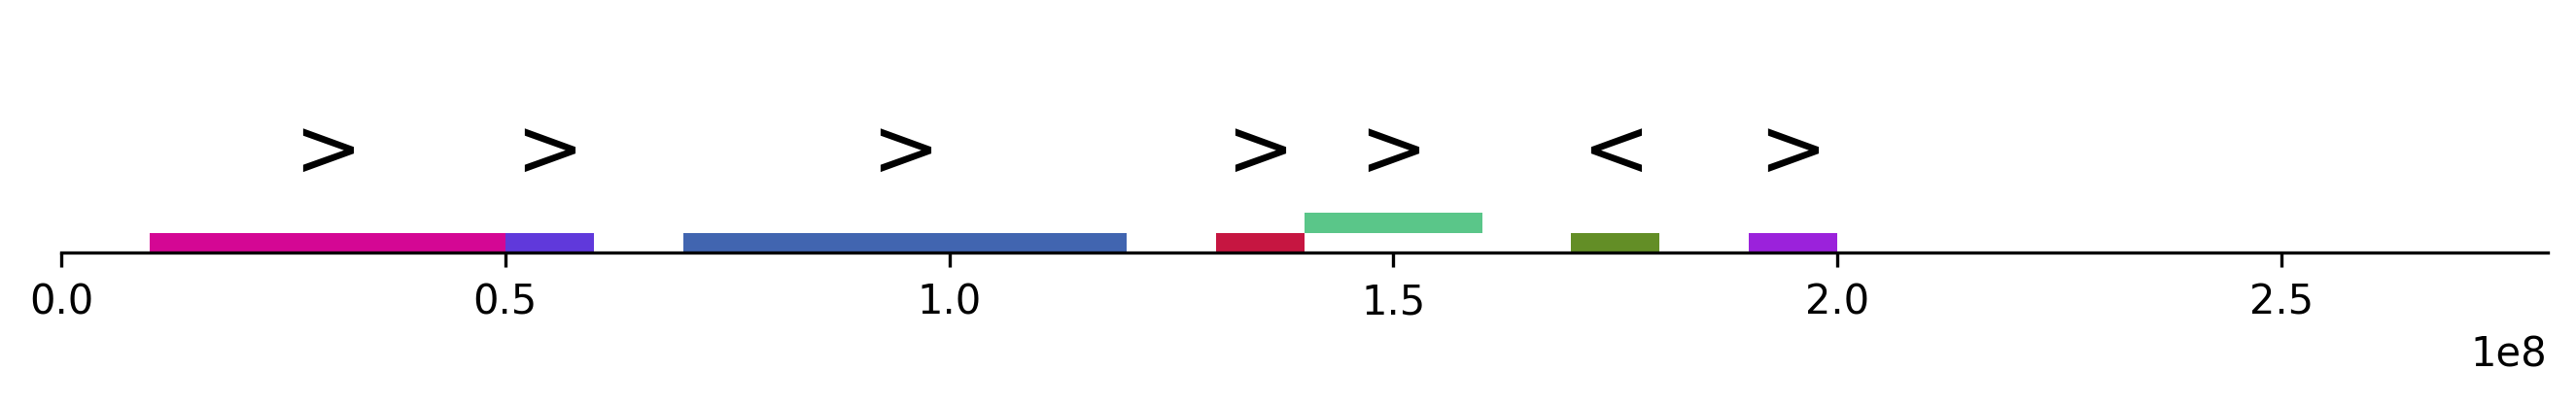
Will output the following image:
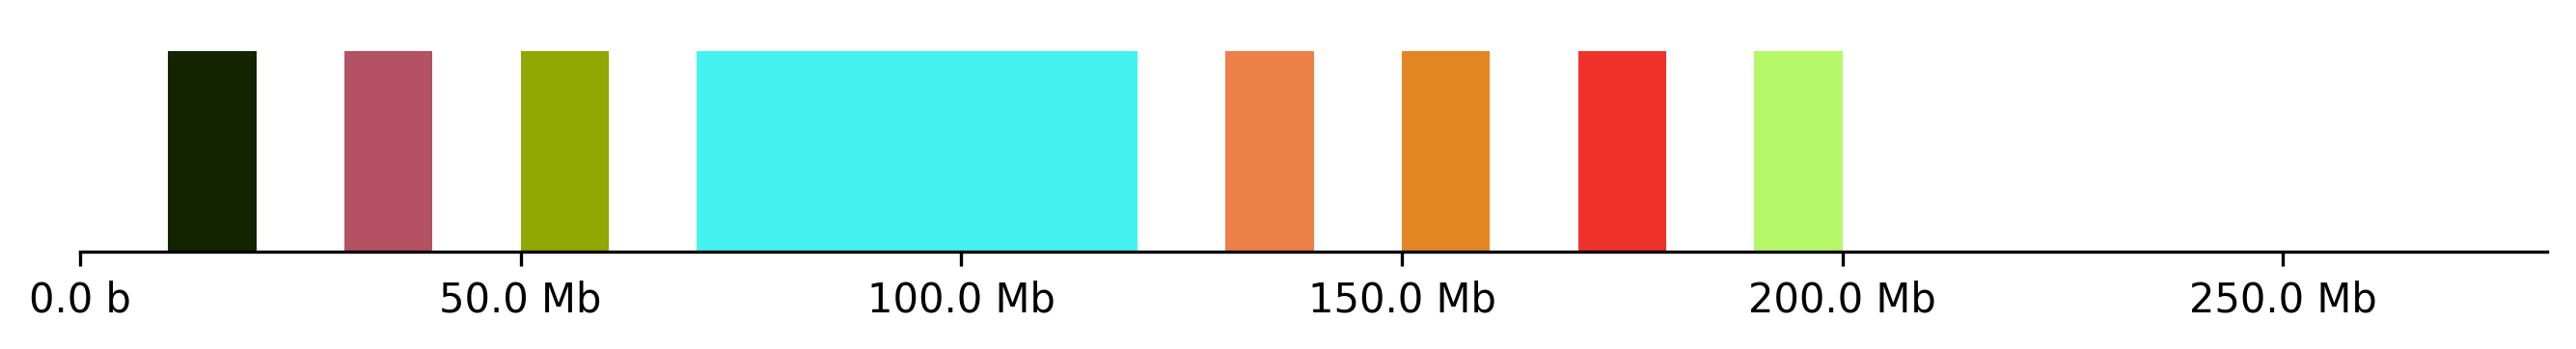
Supplementary mappings on the same chromosome/strand for a given sequence can be collapsed into a single line by setting strict=PlotMode.STRICT.
This can be seen in the above mappings, where the large block is comprised of 3 separate alignments, from the same read. IF strict=PlotMode.CHILL then each alignment will be plotted separately, even if these alignments are from the same read. This looks like:
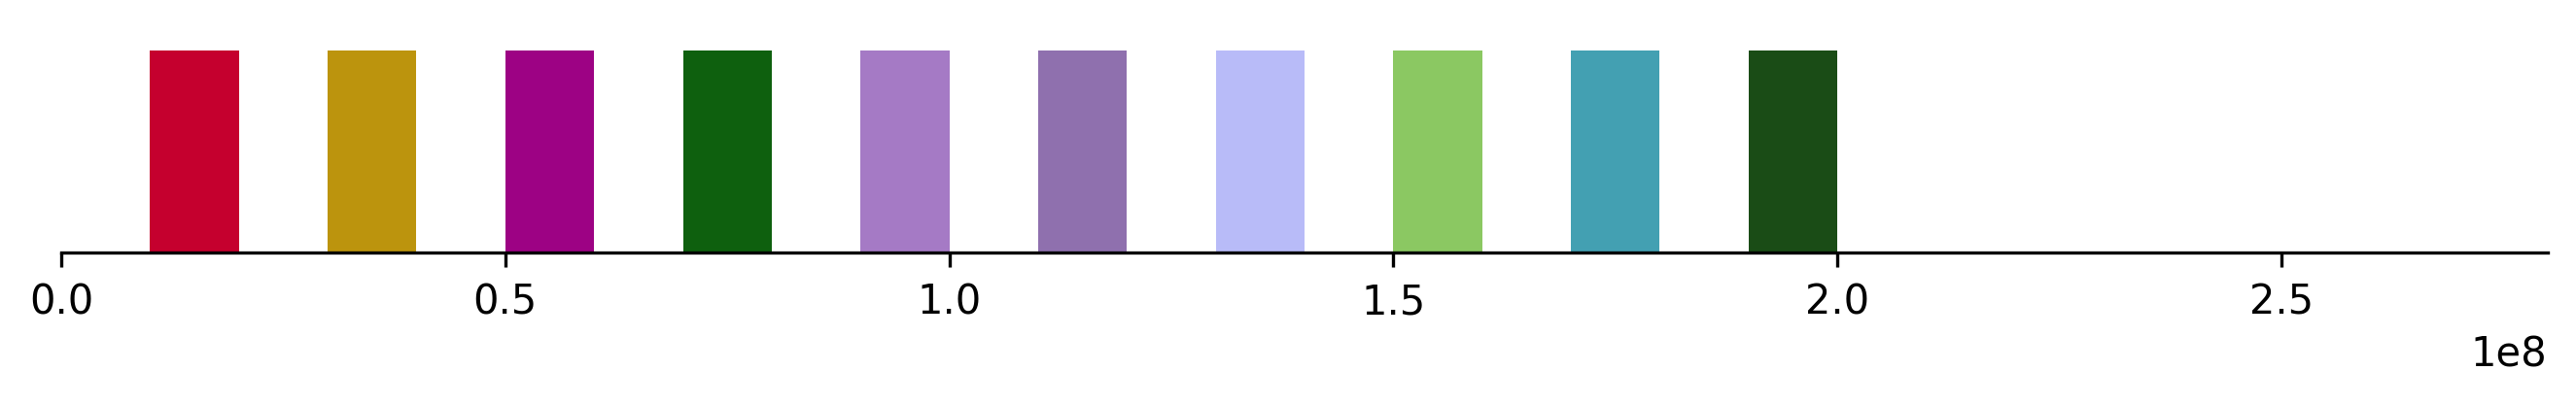
There are now more options!
Chevrons representing the alignment strand can be added by setting chevron=PlotMode.CHEVRONS in the plot_paf_alignments function. Chevrons will only be drawn if the rendered alignment block is wide enough. The fontsize of the chevron can be set with kwarg chevron_fontsize. An example image be seen in the following example:
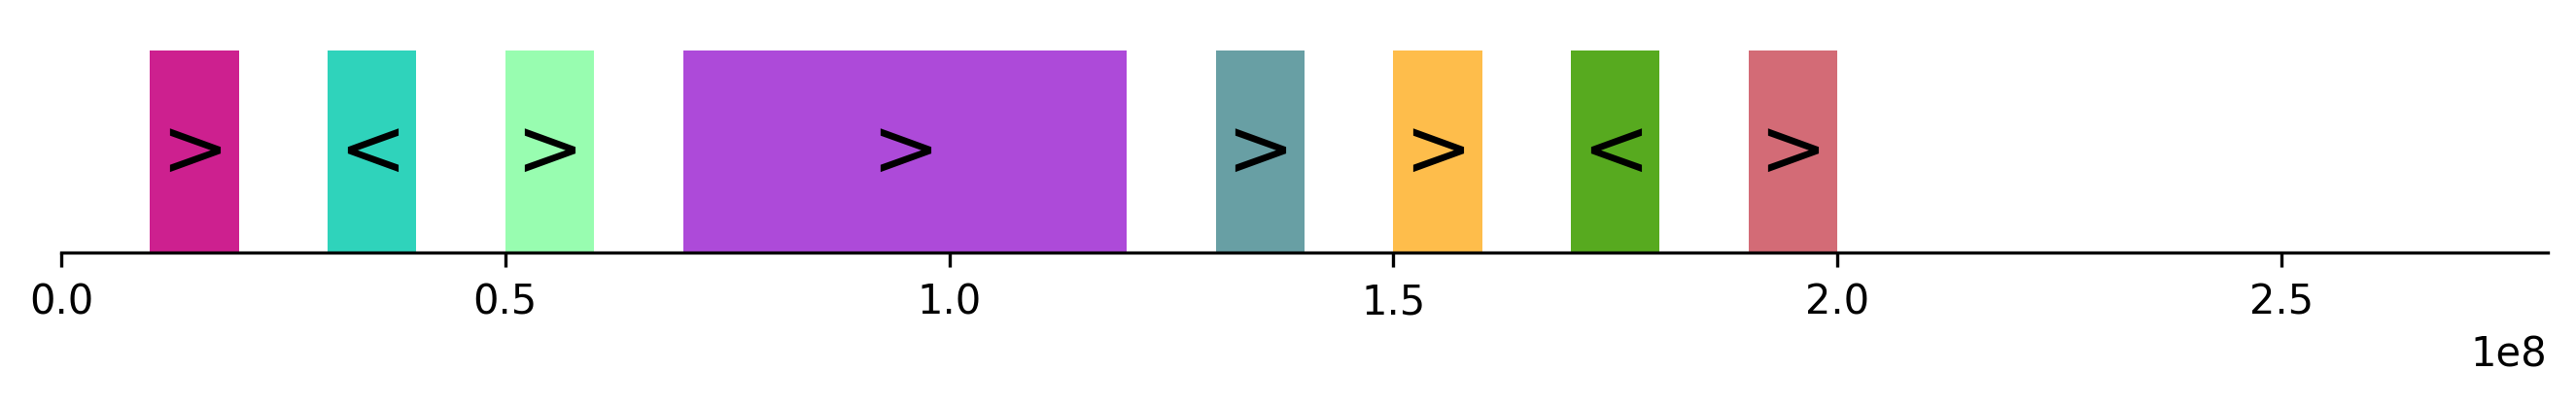
We can now expand multiple alignments that overlap onto separate tracks (a la IGV.)
This can be down by setting expand=PlotMode.EXPAND and strict=PlotMode.STRICT. This will expand overlapping alignments onto separate "tracks" on an axis. The number of tracks for a given axis can be set by the kwarg argument max_tracks. If there are more overlapping alignments that there are tracks, the track with the smalles overlap will be chosen. This can be seen in the following example (which also has chevrons enabled):
CNV from bam
A separate repo calculates CNV from BAM files by binning alignment mapping starts and returning CNV by a dynamically calculated bin width. See here for more detail - https://github.com/Adoni5/cnv_from_bam
Bandage friendly CSV
For visualising Genomes that provide GFA, we can take a PAF file of the genome aligned to a suitable reference,a nd output a CSV for labelling the sequence nodes in bandage. See https://github.com/Adoni5/pyryotype/blob/ec2239cd0fac6ff57e3129cc52ac860d729c94e5/src/pyryotype/paf_tools.py#L114 for more.
[!NOTE] Note: For alignments with many supplementary alignments, the alignment is collapsed to the alignment that covers the largest area of a single contig on the reference.
License
pyryotype is distributed under the terms of the MIT license.
Cytoband data
- HG38 - Nushell, will have to be adapted for bash
curl -L "https://hgdownload.cse.ucsc.edu/goldenpath/hg38/database/cytoBand.txt.gz" | gzip -d - | rg -Ne "^chr\\d+\t" | save cytoBand_HG38.tsv - CHM13 - bash yay
curl -L http://t2t.gi.ucsc.edu/chm13/hub/t2t-chm13-v2.0/download/chm13v2.0_cytobands_allchrs.bed.gz | gzip -d - > cytobands_chm13.bed
Release history Release notifications | RSS feed


Download files
Download the file for your platform. If you're not sure which to choose, learn more about installing packages.
Source Distribution
Built Distribution
Filter files by name, interpreter, ABI, and platform.
If you're not sure about the file name format, learn more about wheel file names.
Copy a direct link to the current filters
File details
Details for the file pyryotype-0.0.7.tar.gz.
File metadata
- Download URL: pyryotype-0.0.7.tar.gz
- Upload date:
- Size: 11.8 MB
- Tags: Source
- Uploaded using Trusted Publishing? Yes
- Uploaded via: twine/4.0.2 CPython/3.11.7
File hashes
| Algorithm | Hash digest | |
|---|---|---|
| SHA256 |
a45605e02a71523100299b3383a82ad9118cbd0d3f805874477dd041a64d44d5
|
|
| MD5 |
c7e1487a025255824a428339d8b41e53
|
|
| BLAKE2b-256 |
721fe9fe00a5e230918212700f05ddc80175be4f9e7292a73def1fbdd43ba5e7
|
File details
Details for the file pyryotype-0.0.7-py3-none-any.whl.
File metadata
- Download URL: pyryotype-0.0.7-py3-none-any.whl
- Upload date:
- Size: 37.6 kB
- Tags: Python 3
- Uploaded using Trusted Publishing? Yes
- Uploaded via: twine/4.0.2 CPython/3.11.7
File hashes
| Algorithm | Hash digest | |
|---|---|---|
| SHA256 |
435625e66ac8c7b4e6bc4d7b168d53076f163a4bc7dd3b1bd5907a4a498f7830
|
|
| MD5 |
a135c04fe7a4fd09fcca4a389d6da6b0
|
|
| BLAKE2b-256 |
12948a9cdc05b786b2e102ae2b6c2ac8bc2e97560ba7ed4be7057d481901c048
|


