Constructs cell-type-specific gene regulatory networks from single-cell RNA-sequencing data using the SCORPION algorithm, which aggregates cells into super-cells and applies PANDA to infer transcription factor-target regulatory relationships.

Project description
 pySCORPION
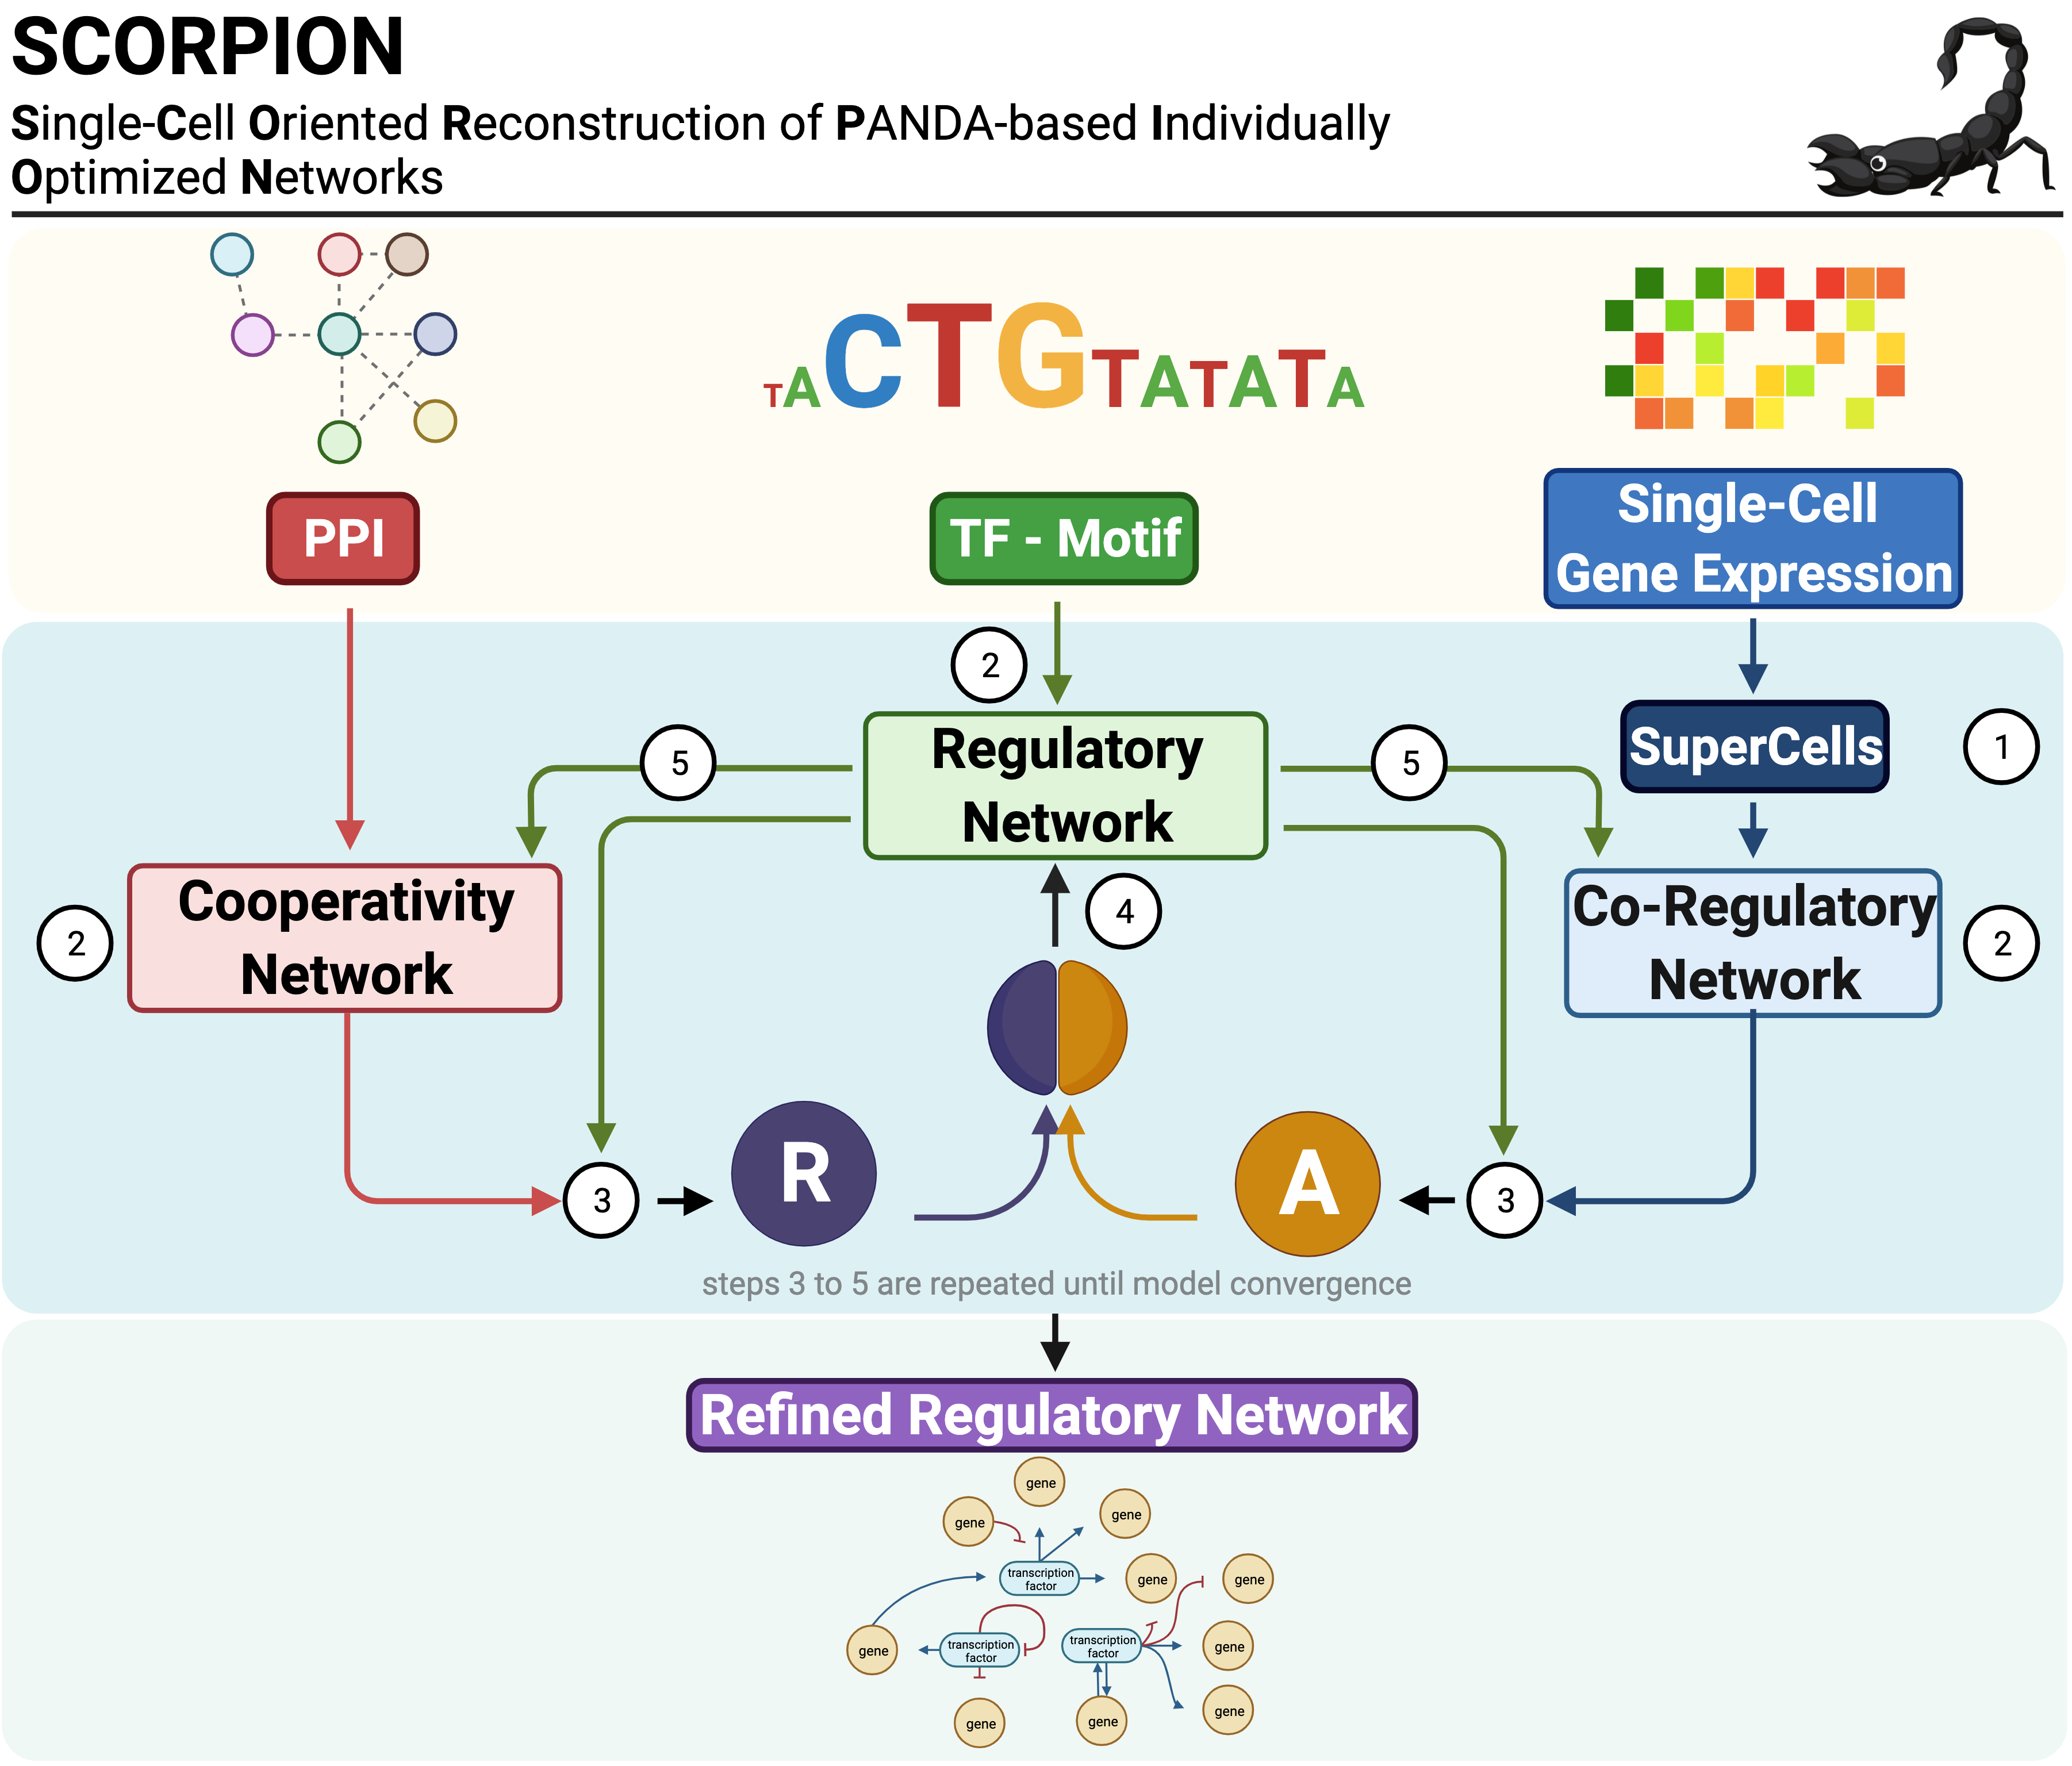
SCORPION (Single-Cell Oriented Reconstruction of PANDA Individually Optimized Gene Regulatory Networks) is a Python package for constructing gene regulatory networks from single-cell and single-nucleus RNA sequencing data. The package addresses the sparsity inherent in single-cell expression data through coarse-graining, which aggregates similar cells to improve correlation structure detection. Network reconstruction is performed using the PANDA (Passing Attributes between Networks for Data Assimilation) message-passing algorithm, integrating transcription factor motifs, protein-protein interactions, and gene expression data. By using consistent baseline priors across samples, SCORPION produces comparable, fully-connected, weighted regulatory networks suitable for population-level analyses.
Installation
pip install pyscorpion
To install the development version from GitHub:
pip install git+https://github.com/dcosorioh/pySCORPION.git
Quick Start
from scorpion import load_example_data, scorpion, run_scorpion

# Load the bundled example dataset
data = load_example_data()

# Construct a single regulatory network
network = scorpion(
    gex_matrix=data["gex_matrix"],
    tf_motifs=data["tf_motifs"],
    ppi_net=data["ppi_net"],
)

# Construct networks stratified by cell groups
networks = run_scorpion(
    gex_matrix=data["gex_matrix"],
    tf_motifs=data["tf_motifs"],
    ppi_net=data["ppi_net"],
    cells_metadata=data["metadata"],
    group_by="region",
)
Example Data
The package ships with a colorectal cancer single-cell RNA-seq dataset (300 genes, ~1 950 cells, 3 donors, 3 tissue regions) that can be loaded with a single call:
from scorpion import load_example_data

data = load_example_data()

data["gex_matrix"]   # Gene expression matrix (genes × cells)
data["tf_motifs"]    # TF–target motif prior network
data["ppi_net"]      # Protein–protein interaction network
data["metadata"]     # Cell-level metadata (cell_id, donor, region, cell_type)
Core Functions
scorpion
Constructs a single gene regulatory network from a gene expression matrix using coarse-graining and the PANDA algorithm.
Usage:
result = scorpion(
    gex_matrix=expression_data,
    tf_motifs=None,
    ppi_net=None,
    computing_engine="cpu",
    n_cores=1,
    gamma_value=10,
    n_pc=25,
    assoc_method="pearson",
    alpha_value=0.1,
    hamming_value=0.001,
    n_iter=float("inf"),
    out_net=["regNet", "coregNet", "coopNet"],
    z_scaling=True,
    show_progress=True,
    randomization_method=None,
    scale_by_present=False,
    filter_expr=False,
    random_state=None,
    gene_names=None,
)
Parameters:
| Parameter | Description | Default |
|---|---|---|
gex_matrix |
Expression matrix with genes in rows and cells in columns | Required |
tf_motifs |
DataFrame with columns [TF, target gene, motif score]. Pass None for co-expression analysis only |
None |
ppi_net |
DataFrame with columns [protein1, protein2, interaction score]. Pass None to disable PPI integration |
None |
computing_engine |
Computation backend: "cpu" or "gpu" |
"cpu" |
n_cores |
Number of processors for BLAS/MPI parallel computation | 1 |
gamma_value |
Coarse-graining level; ratio of cells to super-cells | 10 |
n_pc |
Number of principal components for kNN network construction | 25 |
assoc_method |
Gene association method: "pearson", "spearman", or "pcNet" |
"pearson" |
alpha_value |
Weight of prior networks relative to expression data (0–1) | 0.1 |
hamming_value |
Convergence threshold based on Hamming distance | 0.001 |
n_iter |
Maximum number of PANDA iterations before stopping | inf |
out_net |
Networks to return: "regNet", "coregNet", and/or "coopNet" |
All three |
z_scaling |
Return Z-score normalized edge weights; False returns [0,1] scale |
True |
show_progress |
Print progress messages during computation | True |
randomization_method |
Randomization for null models: None, "within_gene", or "by_gene" |
None |
scale_by_present |
Scale correlations by percentage of cells with non-zero expression | False |
filter_expr |
Remove genes with zero expression across all cells before inference | False |
random_state |
Random seed for reproducibility | None |
gene_names |
Array of gene names; if None, inferred from the expression matrix |
None |
Return value:
A dictionary containing:
| Component | Description |
|---|---|
regNet |
Regulatory network matrix (TFs × target genes) |
coregNet |
Co-regulation network matrix (genes × genes) |
coopNet |
TF cooperative network matrix (TFs × TFs) |
numGenes |
Number of genes in the network |
numTFs |
Number of transcription factors |
numEdges |
Total number of edges in the regulatory network |
run_scorpion
Constructs regulatory networks for multiple cell groups defined by metadata columns. This function wraps scorpion() to enable stratified network inference and returns results in a format suitable for comparative analysis.
Usage:
networks = run_scorpion(
    gex_matrix=expression_data,
    tf_motifs=motif_prior,
    ppi_net=ppi_network,
    cells_metadata=metadata,
    group_by="region",
    normalize_data=True,
    remove_batch_effect=False,
    batch=None,
    min_cells=30,
)
Parameters:
| Parameter | Description | Default |
|---|---|---|
gex_matrix |
Expression matrix with genes in rows and cells in columns | Required |
tf_motifs |
DataFrame with columns [TF, target gene, motif score] | Required |
ppi_net |
DataFrame with columns [protein1, protein2, interaction score] | Required |
cells_metadata |
DataFrame with cell-level metadata; must contain columns specified in group_by |
Required |
group_by |
String or list of column name(s) in cells_metadata for stratification |
Required |
normalize_data |
Apply log normalization to expression data before network inference | True |
remove_batch_effect |
Perform batch effect correction before network inference | False |
batch |
Column name in cells_metadata giving batch assignment for each cell; required if remove_batch_effect=True |
None |
min_cells |
Minimum number of cells required per group to build a network | 30 |
Additional parameters: All scorpion() parameters (computing_engine, n_cores, gamma_value, n_pc, assoc_method, alpha_value, hamming_value, n_iter, out_net, z_scaling, show_progress, randomization_method, scale_by_present, filter_expr) can be passed to control network inference behavior. See scorpion() documentation above.
Return value:
A DataFrame in wide format where:
- Rows represent TF-target pairs
- Columns represent network identifiers (derived from
group_byvalues) - Values are edge weights from each network
Example output:
| tf | target | P31--T | P31--B | P31--N | P32--T | ... |
|---|---|---|---|---|---|---|
| AATF | ACKR1 | -0.326 | -0.337 | -0.344 | -0.298 | ... |
| ABL1 | ACKR1 | -0.340 | -0.339 | -0.351 | -0.312 | ... |
Examples:
from scorpion import load_example_data, scorpion, run_scorpion

# Load example data
data = load_example_data()

# Stratify by tissue region
nets_by_region = run_scorpion(
    gex_matrix=data["gex_matrix"],
    tf_motifs=data["tf_motifs"],
    ppi_net=data["ppi_net"],
    cells_metadata=data["metadata"],
    group_by="region",
)

# Stratify by multiple variables
nets_by_donor_region = run_scorpion(
    gex_matrix=data["gex_matrix"],
    tf_motifs=data["tf_motifs"],
    ppi_net=data["ppi_net"],
    cells_metadata=data["metadata"],
    group_by=["donor", "region"],
)

# With batch effect correction
nets_corrected = run_scorpion(
    gex_matrix=data["gex_matrix"],
    tf_motifs=data["tf_motifs"],
    ppi_net=data["ppi_net"],
    cells_metadata=data["metadata"],
    group_by="region",
    remove_batch_effect=True,
    batch="donor",
)
Statistical Analysis
test_edges
Performs statistical testing on network edges to identify differential regulatory relationships between groups. The function supports single-sample tests, two-sample comparisons, and paired tests. All computations are fully vectorized for efficiency with large-scale datasets.
Usage:
results = test_edges(
    networks_df=nets,
    test_type="single",
    group1=tumor_nets,
    group2=None,
    paired=False,
    alternative="two.sided",
    padjust_method="BH",
    min_log2fc=0.0,
    moderate_variance=True,
    empirical_null=True,
)
Parameters:
| Parameter | Description | Default |
|---|---|---|
networks_df |
Output from run_scorpion() |
Required |
test_type |
Test type: "single" (one-sample) or "two.sample" |
Required |
group1 |
List of column names for the first (or only) group | Required |
group2 |
List of column names for the second group (two-sample tests) | None |
paired |
Perform paired t-test; requires equal-length groups in matched order | False |
alternative |
Alternative hypothesis: "two.sided", "greater", or "less" |
"two.sided" |
padjust_method |
Multiple testing correction method (see statsmodels.stats.multitest) |
"BH" |
min_log2fc |
Minimum absolute log2 fold change for inclusion (two-sample/paired only) | 0.0 |
moderate_variance |
Apply SAM-style variance moderation; adds median(SE) to denominator | True |
empirical_null |
Use Efron's empirical null (median/MAD) for p-value calibration | True |
Return value:
A DataFrame containing:
| Column | Description |
|---|---|
tf, target |
TF-target pair identifiers |
meanEdge |
Mean edge weight (single-sample) |
meanGroup1, meanGroup2 |
Group means (two-sample) |
diffMean |
Difference in means, Group1 − Group2 (two-sample) |
cohensD |
Cohen's d effect size (two-sample and paired tests) |
log2FoldChange |
Log2 fold change (two-sample) |
tStatistic |
t-statistic |
pValue |
Raw p-value |
pAdj |
Adjusted p-value |
Examples:
from scorpion import test_edges

# Define groups
tumor_nets = [c for c in nets_by_donor_region.columns if c.endswith("--T")]
normal_nets = [c for c in nets_by_donor_region.columns if c.endswith("--N")]

# Two-sample comparison: Tumor vs Normal
results = test_edges(
    networks_df=nets_by_donor_region,
    test_type="two.sample",
    group1=tumor_nets,
    group2=normal_nets,
)

# Paired test for matched samples (same patient)
tumor_ordered = ["P31--T", "P32--T", "P33--T"]
normal_ordered = ["P31--N", "P32--N", "P33--N"]

results_paired = test_edges(
    networks_df=nets_by_donor_region,
    test_type="two.sample",
    group1=tumor_ordered,
    group2=normal_ordered,
    paired=True,
)

# Single-sample test: edges differing from zero
results_single = test_edges(
    networks_df=nets_by_region,
    test_type="single",
    group1=tumor_nets,
)
regress_edges
Performs linear regression to identify edges with significant trends across ordered conditions. This is useful for studying disease progression or developmental trajectories.
Usage:
results = regress_edges(
    networks_df=nets,
    ordered_groups=ordered_conditions,
    padjust_method="BH",
    min_mean_edge=0.0,
)
Parameters:
| Parameter | Description | Default |
|---|---|---|
networks_df |
Output from run_scorpion() |
Required |
ordered_groups |
Dictionary where each value is a list of column names in networks_df. Keys represent ordered conditions (e.g., {"Normal": [...], "Border": [...], "Tumor": [...]}). The order of keys defines the progression |
Required |
padjust_method |
Multiple testing correction method | "BH" |
min_mean_edge |
Minimum mean absolute edge weight for inclusion | 0.0 |
Return value:
A DataFrame containing:
| Column | Description |
|---|---|
tf, target |
TF-target pair identifiers |
slope |
Regression slope (change per condition step) |
intercept |
Regression intercept |
rSquared |
Coefficient of determination |
fStatistic |
F-statistic for the regression |
pValue |
Raw p-value |
pAdj |
Adjusted p-value |
meanEdge |
Overall mean edge weight |
mean<Condition> |
Mean edge weight for each condition |
Example:
from scorpion import regress_edges

# Define ordered progression: Normal → Border → Tumor
normal_nets = [c for c in nets_by_donor_region.columns if c.endswith("--N")]
border_nets = [c for c in nets_by_donor_region.columns if c.endswith("--B")]
tumor_nets = [c for c in nets_by_donor_region.columns if c.endswith("--T")]

ordered_conditions = {
    "Normal": normal_nets,
    "Border": border_nets,
    "Tumor": tumor_nets,
}

# Identify edges with significant trends
results_reg = regress_edges(
    networks_df=nets_by_donor_region,
    ordered_groups=ordered_conditions,
)

# Edges increasing along progression
increasing = results_reg[(results_reg["pAdj"] < 0.05) & (results_reg["slope"] > 0)]

# Edges decreasing along progression
decreasing = results_reg[(results_reg["pAdj"] < 0.05) & (results_reg["slope"] < 0)]
Dependencies
- NumPy (>=1.21)
- pandas (>=1.3)
- SciPy (>=1.7)
- scikit-learn (>=1.0)
- igraph (>=0.10)
Citation
If you use SCORPION in your research, please cite:
Osorio, D., Capasso, A., Eckhardt, S.G. et al. Population-level comparisons of gene regulatory networks modeled on high-throughput single-cell transcriptomics data. Nature Computational Science 4, 237–250 (2024). https://doi.org/10.1038/s43588-024-00597-5
Additional Resources
- Supplementary Materials: https://github.com/dosorio/SCORPION/
- Issue Tracker: https://github.com/dcosorioh/pySCORPION/issues
- R Package (CRAN): https://cran.r-project.org/package=SCORPION
Release history Release notifications | RSS feed

Download files
Download the file for your platform. If you're not sure which to choose, learn more about installing packages.
Source Distribution
Built Distribution
Filter files by name, interpreter, ABI, and platform.
If you're not sure about the file name format, learn more about wheel file names.
Copy a direct link to the current filters
File details
Details for the file pyscorpion-0.1.0.tar.gz.
File metadata
- Download URL: pyscorpion-0.1.0.tar.gz
- Upload date:
- Size: 1.5 MB
- Tags: Source
- Uploaded using Trusted Publishing? No
- Uploaded via: twine/6.2.0 CPython/3.9.6
File hashes
| Algorithm | Hash digest | |
|---|---|---|
| SHA256 |
5bdc81250969fb3f3efbc458c0615e75c3ddc451d7ad02b6976d9cc13043bf4a
|
|
| MD5 |
a40c57c6dae4d0976beb550694f3a3f3
|
|
| BLAKE2b-256 |
9cd3d27c5d3f74bde53f4f2a56198bc05d4e0383d3163f7d9d14267670cf907d
|
File details
Details for the file pyscorpion-0.1.0-py3-none-any.whl.
File metadata
- Download URL: pyscorpion-0.1.0-py3-none-any.whl
- Upload date:
- Size: 1.5 MB
- Tags: Python 3
- Uploaded using Trusted Publishing? No
- Uploaded via: twine/6.2.0 CPython/3.9.6
File hashes
| Algorithm | Hash digest | |
|---|---|---|
| SHA256 |
95a1e3c6b4e5febbc6676b494e0a867aa7a6ea0a6b49f877a40eba2cd864f311
|
|
| MD5 |
738dddfa4bda16e1eeb51945b194f945
|
|
| BLAKE2b-256 |
0a96010c33ff180b4a8212e4980a188dcff8c5b77b6d9a1dfc756b65a54f2b92
|


