
pyshewhart - Statistical Process Control Charts
Statistical process control charts (also known as "Shewhart charts" after Walter A. Shewhart) are widely used in manufacturing and industry as a quality-control tool.
The aim of this project is to provide an easy-to-use Python module for generating the following types of control charts:
- X̅ and R
- X̅ and S
- Cumulative Sum (CUSUM)
- P-attribute
In addition to checking the data against the standard 3σ control limits, it can also be evaluated against the well-known "Western Electric rule set" to detect additional statistical anomalies:

Usage
As a Python library:
An X̅ and R (mean and range) chart can be generated as simply as:
import random
import pyshewhart

measurements = [random.random() for _ in range(200)]
pyshewhart.XbarR(measurements)
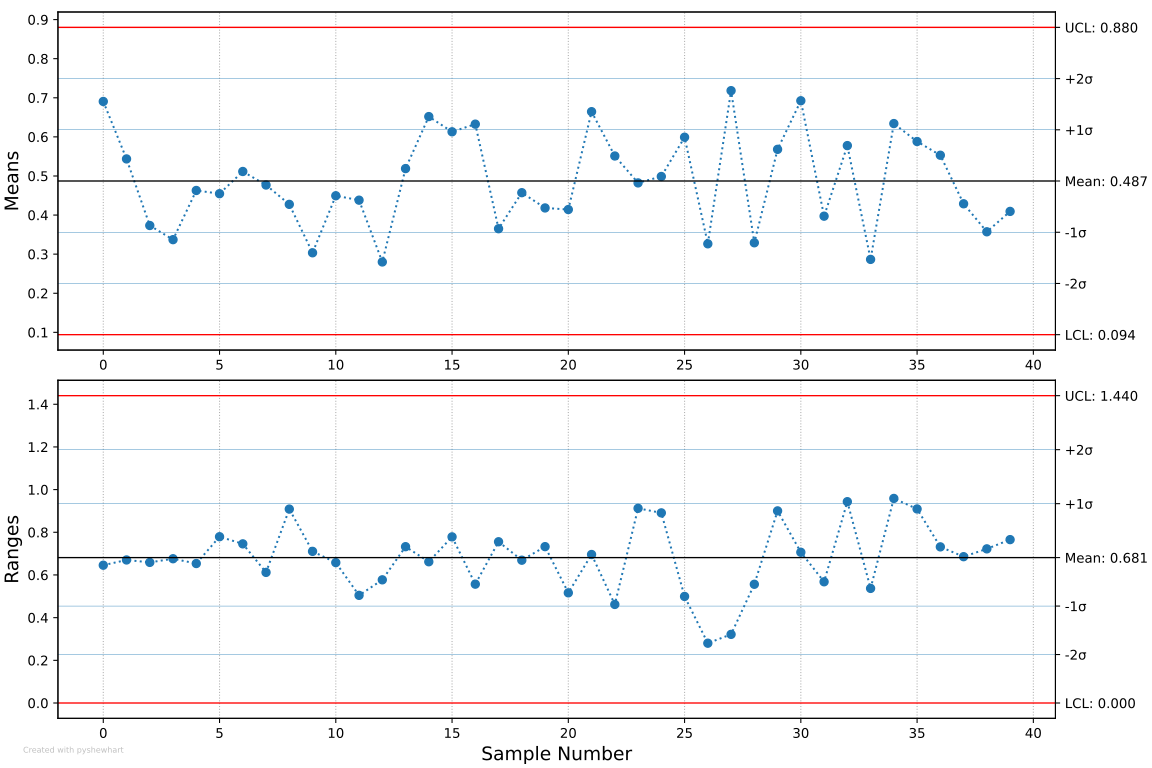
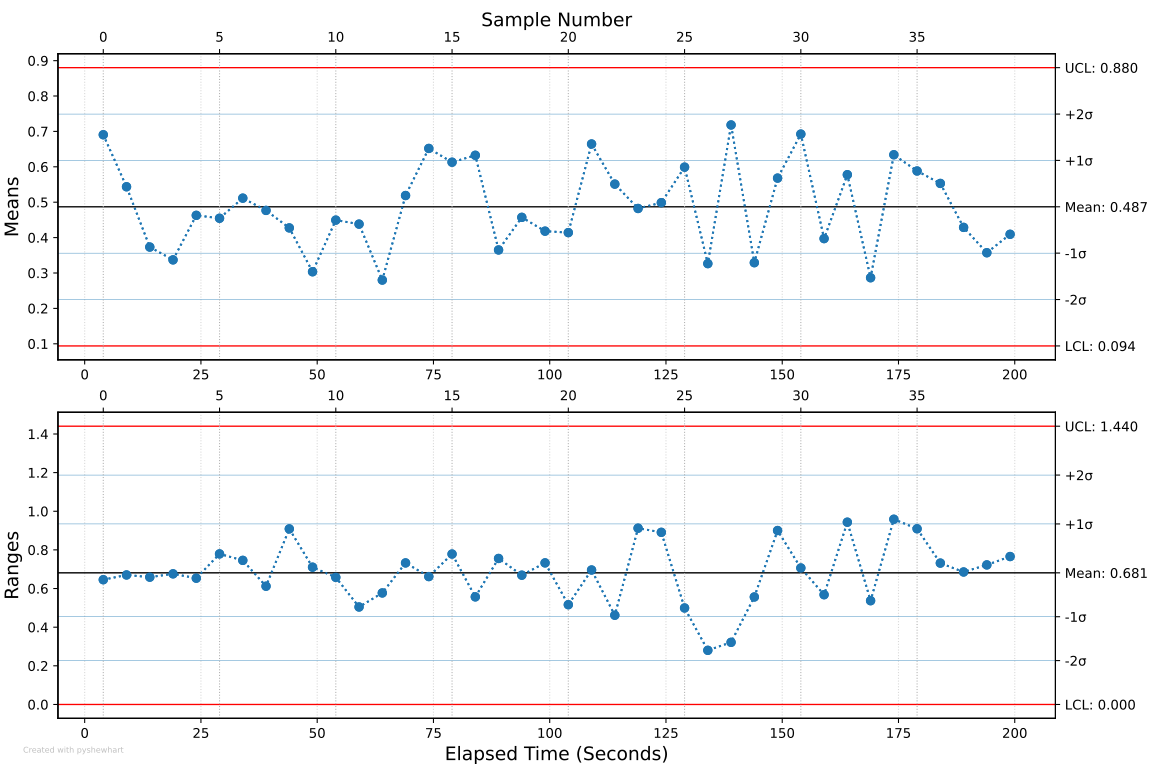
If you have time information, you can also provide that. Supported time types include:
datetimetimedelta- various string formats (as supported by
dateutil.parser.parse) - Unix timestamps
- elapsed seconds (
intorfloat)
seconds = range(200)
pyshewhart.XbarR(seconds, measurements)
Notice that now the plot shows both sample numbers and elapsed seconds.
Console Script:
Given a CSV file field_strengths_nT.csv containing timeseries and measurement data:
2022-10-12, 59194.401
2022-10-13, 59176.972
2022-10-14, 59179.485
2022-10-15, 59189.235
      ...
      ...
2023-10-08, 59196.725
2023-10-09, 59194.435
2023-10-10, 59187.456
2023-10-11, 59196.135
we can generate an X̅ and S (mean and standard deviation) plot with the following shell command:
$ pyshewhart field_strengths_nT.csv xbar-s 7 --units "nT" --title "Field Strength"

Examples
A few other examples can be found in the examples/ directory.
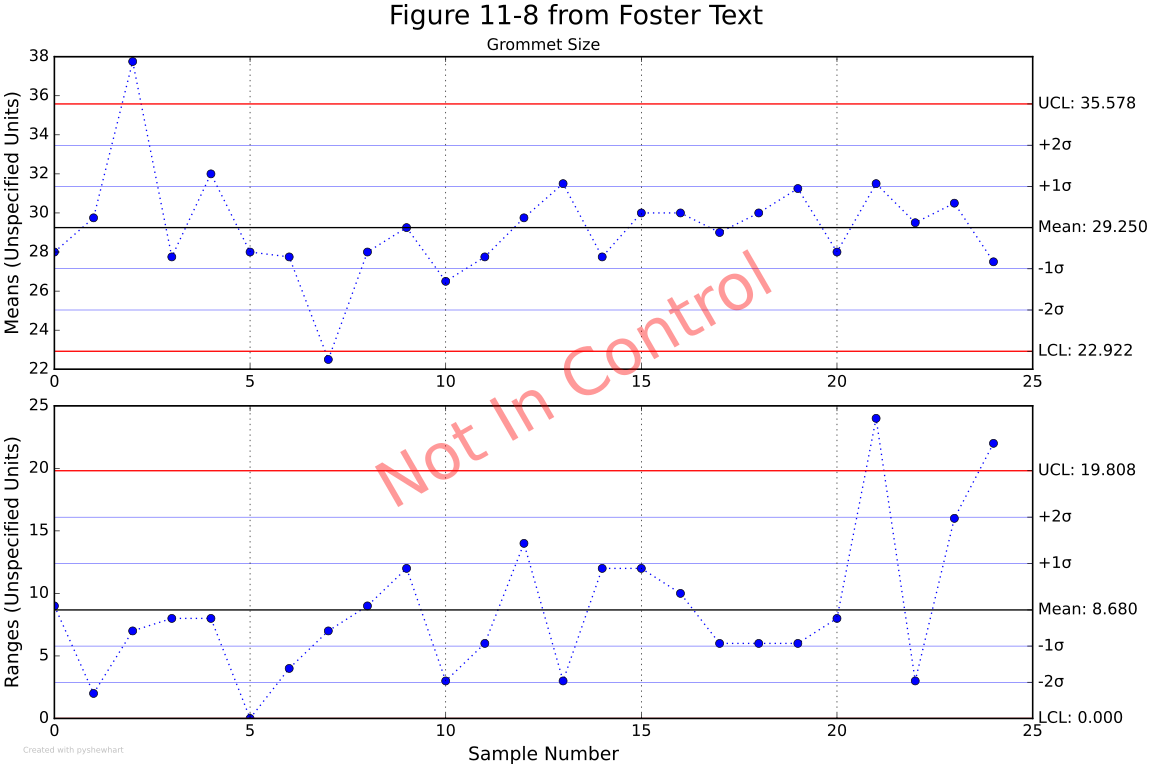
Several of these are recreated from a well-known textbook titled Managing Quality: Integrating the Supply Chain by S. Thomas Foster, including this X̅ and R chart:
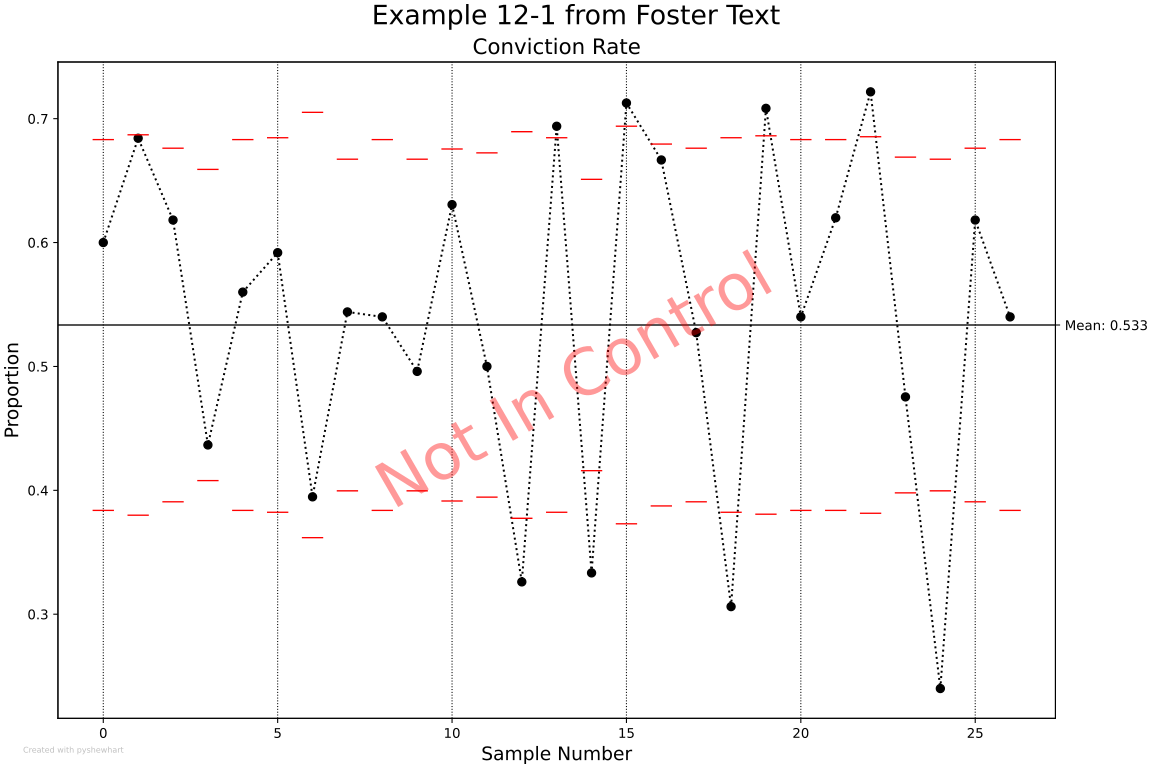
Also a P-attribute chart:
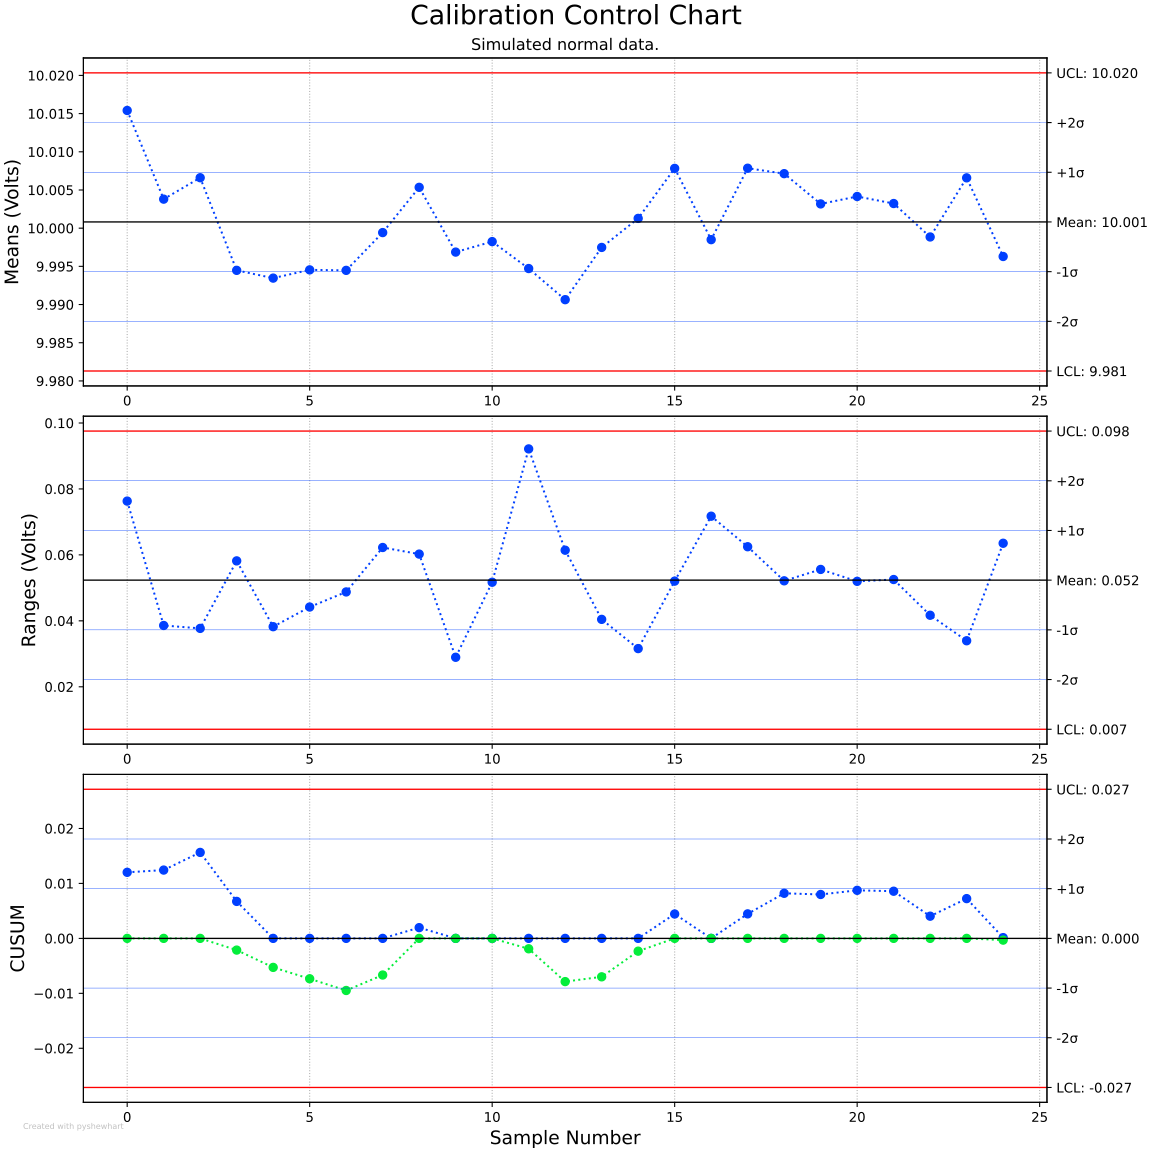
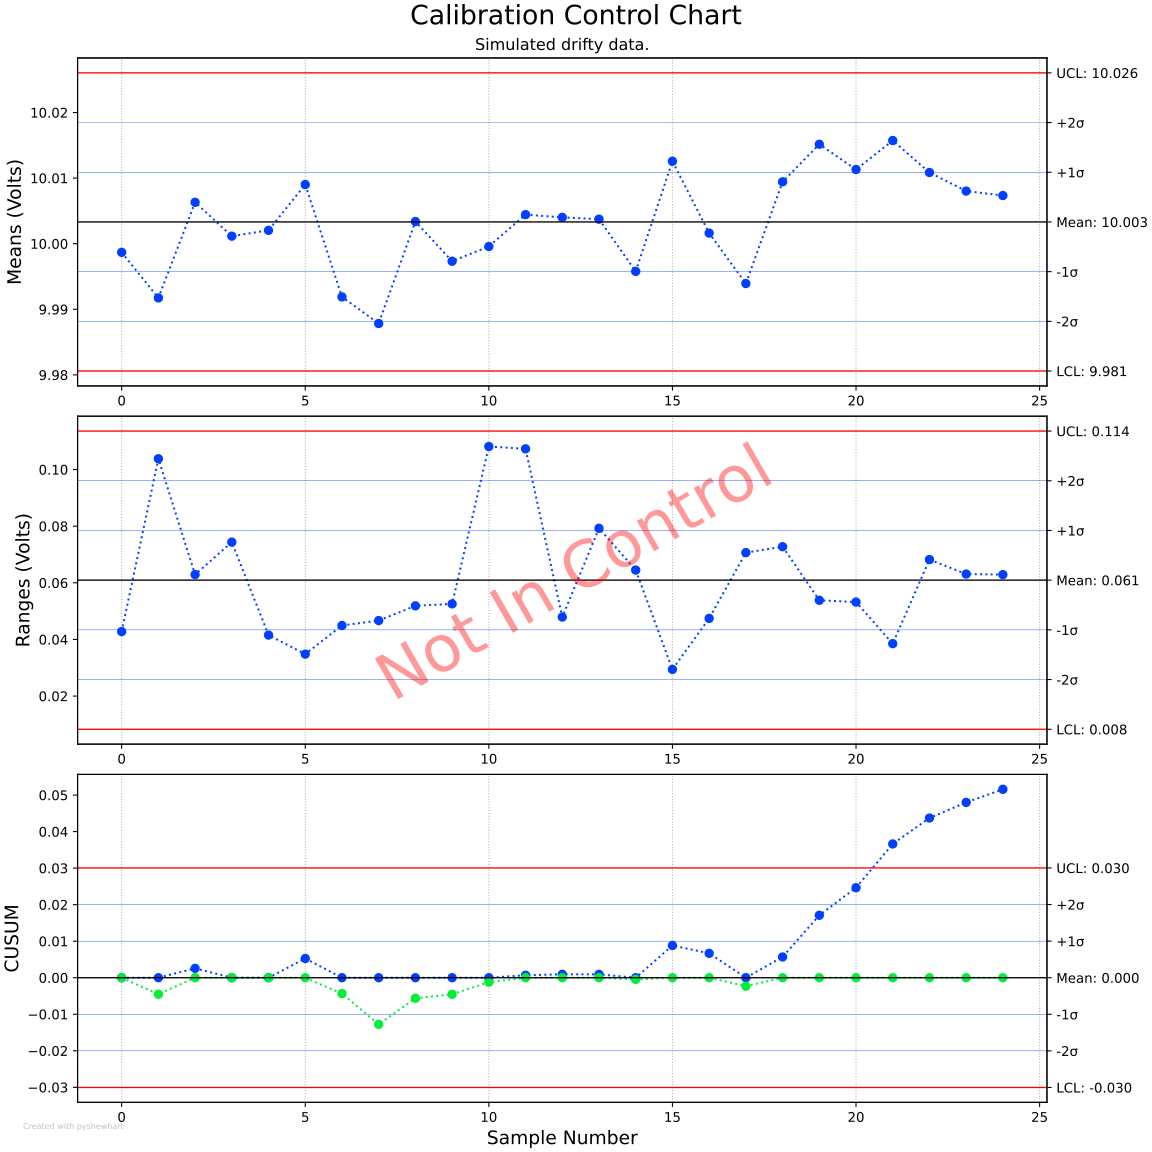
The following shows the capabilities of a CUSUM chart to detect small amounts of drift.
First we see normal data:
And here we see the chart detecting a small amount of simulated drift:
1 maintainer

Metadata
1 maintainer
Release files for pyshewhart 1.1.0
For a detailed explanation of source distributions (sdists) and built distributions (wheels), please see the package formats documentation.
Source distribution (sdist)
| File | Size | Uploaded | Provenance | |
|---|---|---|---|---|
| pyshewhart-1.1.0.tar.gz | 25.0 kB | Without provenance | Details |
Built distribution (wheel)
| File | Interpreter | ABI | Platform | Reset |
|---|---|---|---|---|
| pyshewhart-1.1.0-py3-none-any.whl | Python 3 | none | any | Details |
Total release size: 48.1 kB
Release files / pyshewhart-1.1.0.tar.gz
| Download URL | pyshewhart-1.1.0.tar.gz |
|---|---|
| Size | 25.0 kB |
| Tags | Source |
|
SHA-256 checksum How to use checksums |
216ded68e80ee6a34d57a77aed0bad9567e3db7a555b2580f84ff5c1c5e3ddfc
|
|
BLAKE2b-256 checksum How to use checksums |
034ebb3846b1908dc95e79b2706d69aad262bb1d2dd37b2d1e210c4208a2aaf7
|
| Upload date | |
|
Uploaded using Trusted Publishing? What is trusted publishing? |
No |
| Uploaded via |
uv/0.11.8 {"installer":{"name":"uv","version":"0.11.8","subcommand":["publish"]},"python":null,"implementation":{"name":null,"version":null},"distro":{"name":"Ubuntu","version":"26.04","id":"resolute","libc":null},"system":{"name":null,"release":null},"cpu":null,"openssl_version":null,"setuptools_version":null,"rustc_version":null,"ci":null}
|
Release files / pyshewhart-1.1.0-py3-none-any.whl
| Download URL | pyshewhart-1.1.0-py3-none-any.whl |
|---|---|
| Size | 23.2 kB |
| Tags | Python 3 |
|
SHA-256 checksum How to use checksums |
3308acfc848b9ba9621c6946c6bfa79b90989c0e8ba50f73bcb67fb018271b86
|
|
BLAKE2b-256 checksum How to use checksums |
5900af52549c8225bc24f6659636da758b8d9ea8159b0c07310d80ab3d908952
|
| Upload date | |
|
Uploaded using Trusted Publishing? What is trusted publishing? |
No |
| Uploaded via |
uv/0.11.8 {"installer":{"name":"uv","version":"0.11.8","subcommand":["publish"]},"python":null,"implementation":{"name":null,"version":null},"distro":{"name":"Ubuntu","version":"26.04","id":"resolute","libc":null},"system":{"name":null,"release":null},"cpu":null,"openssl_version":null,"setuptools_version":null,"rustc_version":null,"ci":null}
|
Security for pyshewhart 1.1.0
Provenance
Provenance describes where a file came from. On PyPI, provenance is shared via attestations, which provide a verifiable record of the build or publishing details. View details, limitations and caveats.
No provenance found
None of the files in this release were uploaded with provenance metadata.
A note on package security
PyPI is a repository for distributing packages, not a service for auditing them. While third-party security researchers and our staff do their best to detect and remove malicious packages, PyPI cannot guarantee the quality, security or suitability of any given package.














