View, edit and calculate scope results from simulations or real measurements.

Project description
pySignalScope processes and compares time domain data similar to oscilloscopes in electronics. Signals can be filtered, derived, integrated or evaluated. Furthermore, pySignalScope includes a module for evaluating and editing the impedance curves of an impedance analyzer or comparing them with the simulation. The main purpose is the quick and easy evaluation of signals, as well as the targeted generation of images for technical documentation. Some examples are:
Bachelor / Master / Ph.D. theses,
Scientific papers,
Technical manuals, and
Measurement reports.
Overview
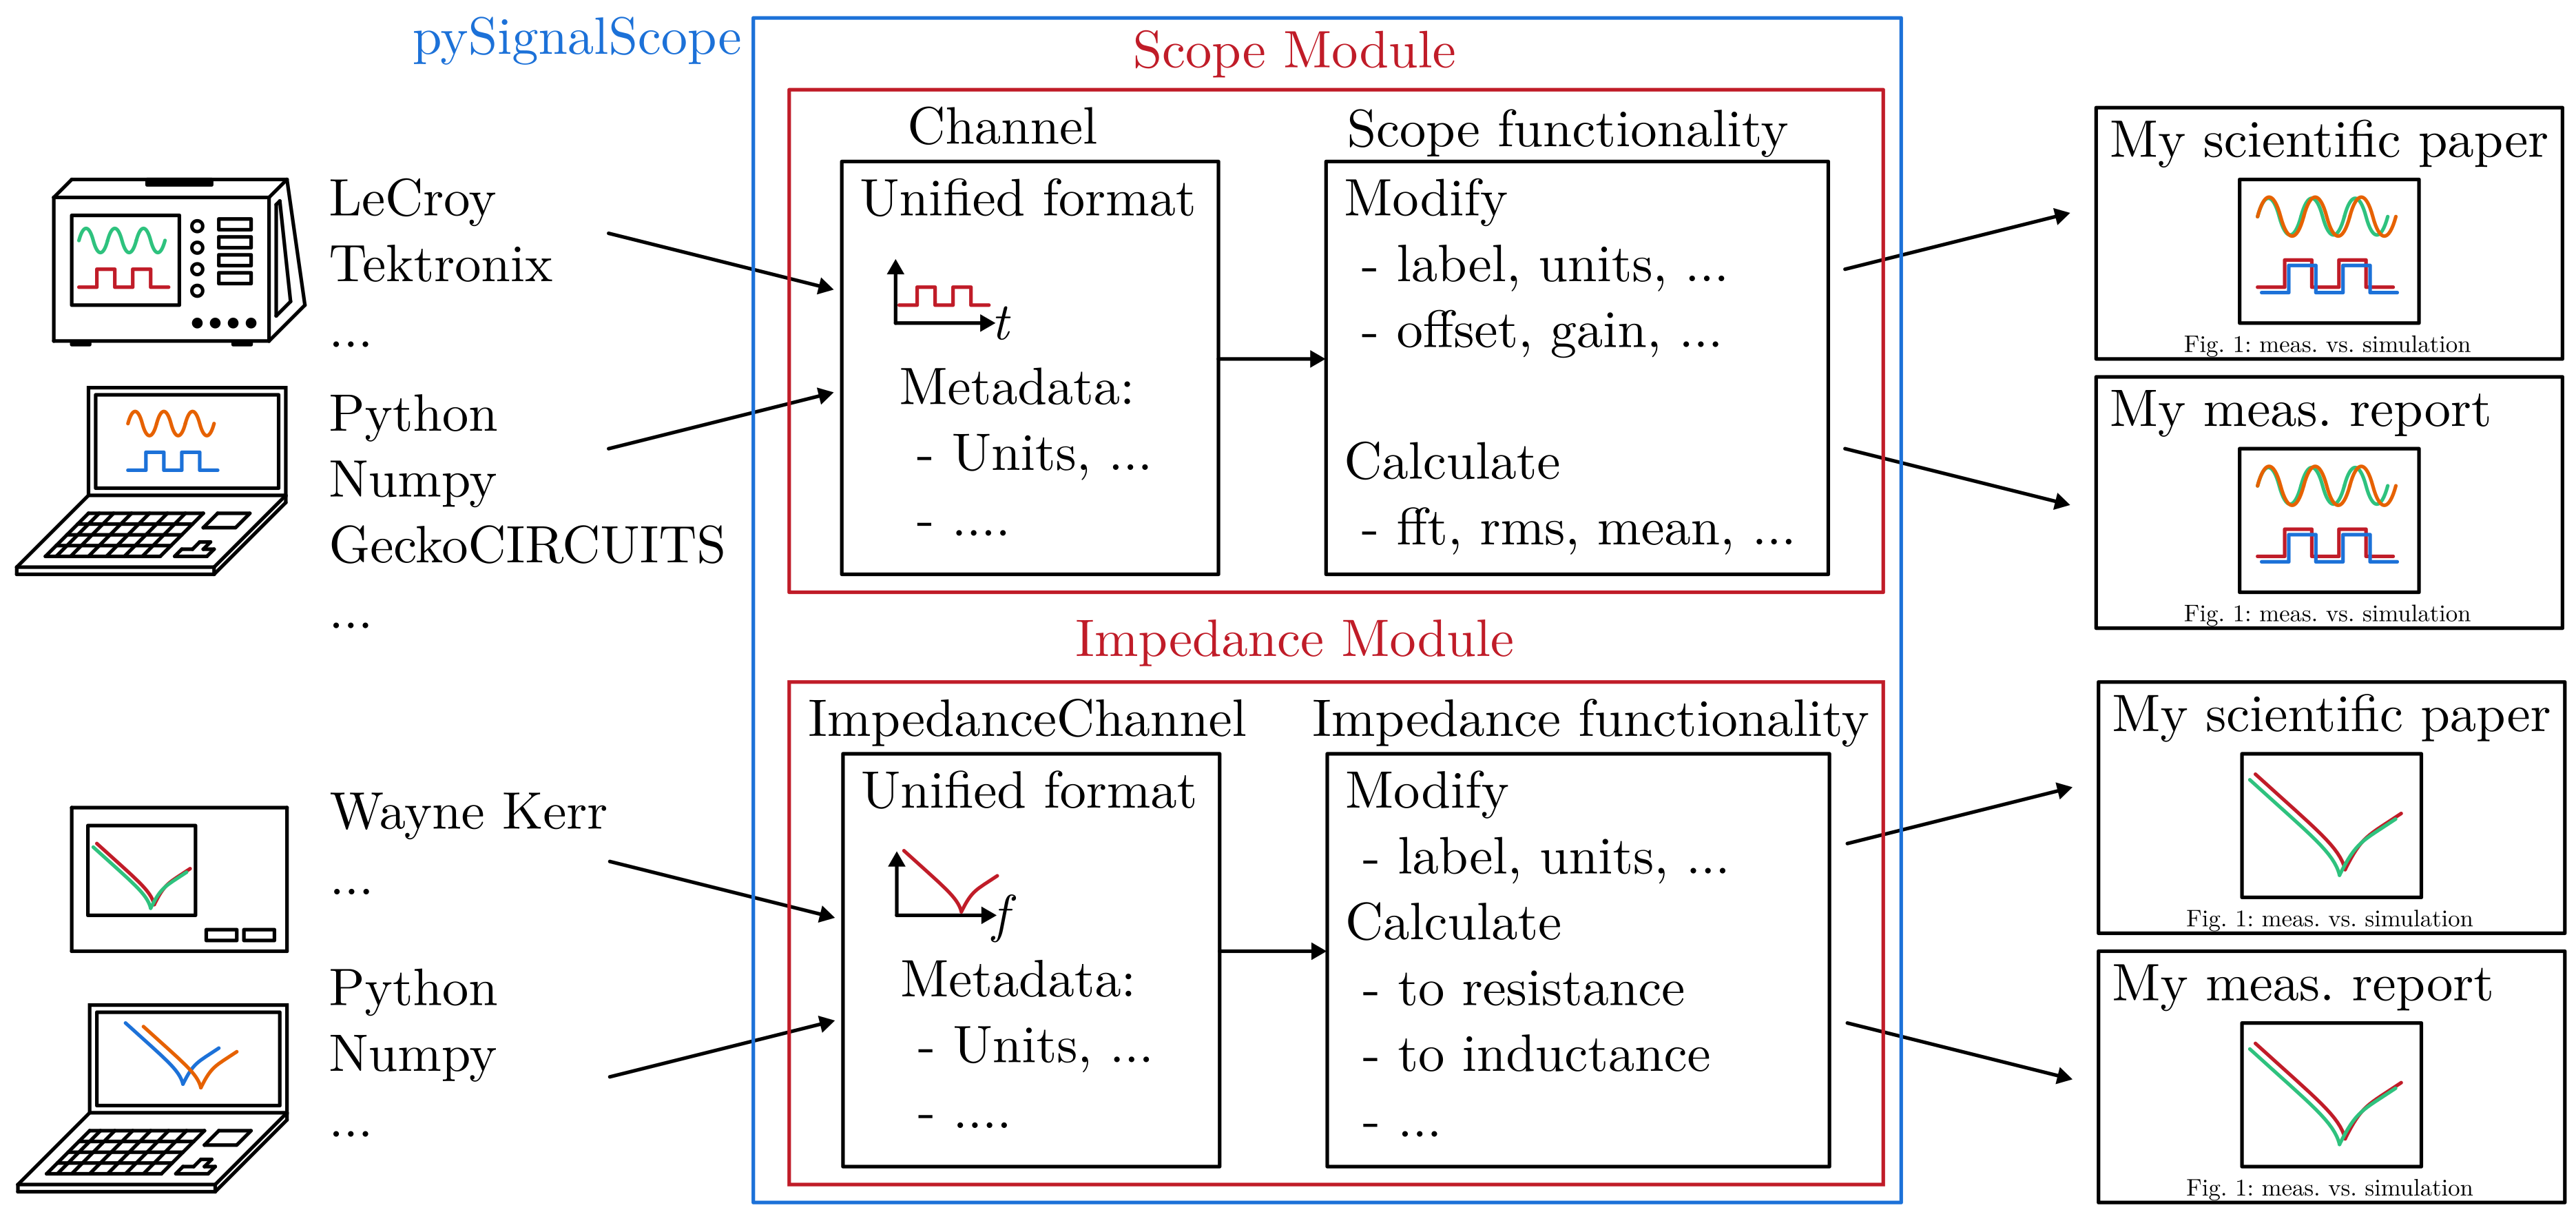
Bring measurements from the oscilloscope and the circuit simulator into a standardized Channel format. Edit the signals by using the Scope functionality: shifting them in time (different zero points) or define the zero point for measuring equipment that can only record AC. Calculate the FFT or important values such as RMS, mean etc. Bring the originally different input formats into common plots to make comparisons easy.
With the Impedance functionality, ImpedanceChannels can be read in, edited and compared. A conversion to e.g. the inductance value is possible with just one command.
Getting started
Install this repository into your virtual environment (venv) or jupyter notebook:
pip install pysignalscope
Use the toolbox in your python program:
import pysignalscope as pss
...
Example usage
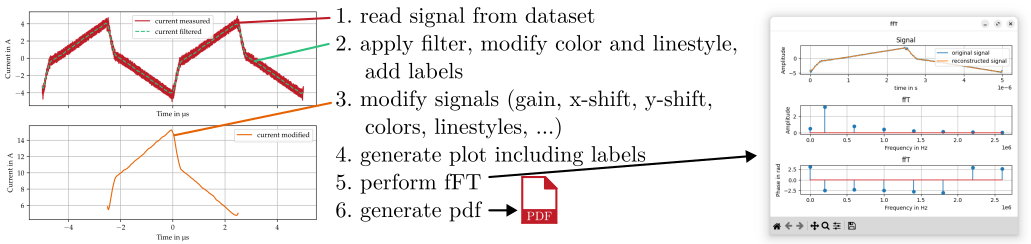
pySignalScope helps to load, edit, display and analyze the signals. The following application example loads a noisy measurement signal, which is first filtered.
import pysignalscope as pss

# Read curves from scope csv file
[voltage_prim, voltage_sec, current_prim, current_sec] = pss.Scope.from_tektronix('scope_example_data_tek.csv')

# Add labels and units to channel: This example considers the Channel 'current_prim' only
current_prim = pss.Scope.modify(current_prim, label='current measured', unit='A', color='red')

# Low pass filter the noisy current signal, modify the Channel attributes label, color and linestyle
current_prim_filtered = pss.Scope.low_pass_filter(current_prim)
current_prim_filtered = pss.Scope.modify(current_prim_filtered, label='current filtered', linestyle='--', color='green')

# Make some modifications on the signal itself: data offset, time offset and factor to the data.
# Short the channel to one period and add label, color and linestyle to the Channel
current_prim_filtered_mod = pss.Scope.modify(current_prim_filtered, data_factor=1.3, data_offset=11, time_shift=2.5e-6)
current_prim_filtered_mod = pss.Scope.short_to_period(current_prim_filtered_mod, f0=200000)
current_prim_filtered_mod = pss.Scope.modify(current_prim_filtered_mod, label='current modified', linestyle='-', color='orange')

# Plot channels, save as pdf
fig1 = pss.Scope.plot_channels([current_prim, current_prim_filtered], [current_prim_filtered_mod], timebase='us')
pss.save_figure(fig1, 'figure.pdf')

# short channels to a single period, perform FFT for current waveforms
current_prim = pss.Scope.short_to_period(current_prim, f0=200000)
current_prim = pss.Scope.modify(current_prim, time_shift=5e-6)
pss.Scope.fft(current_prim)
To simplify the display, colors, linestyle and the label can be attached to the object. This is shown in the plot above.
The lower plot shows the post-processing of the filtered signal. This is multiplied by a small gain, provided with an offset and shortened to a period duration. The label, color and line style are changed. The signals are then plotted with just one plot command.
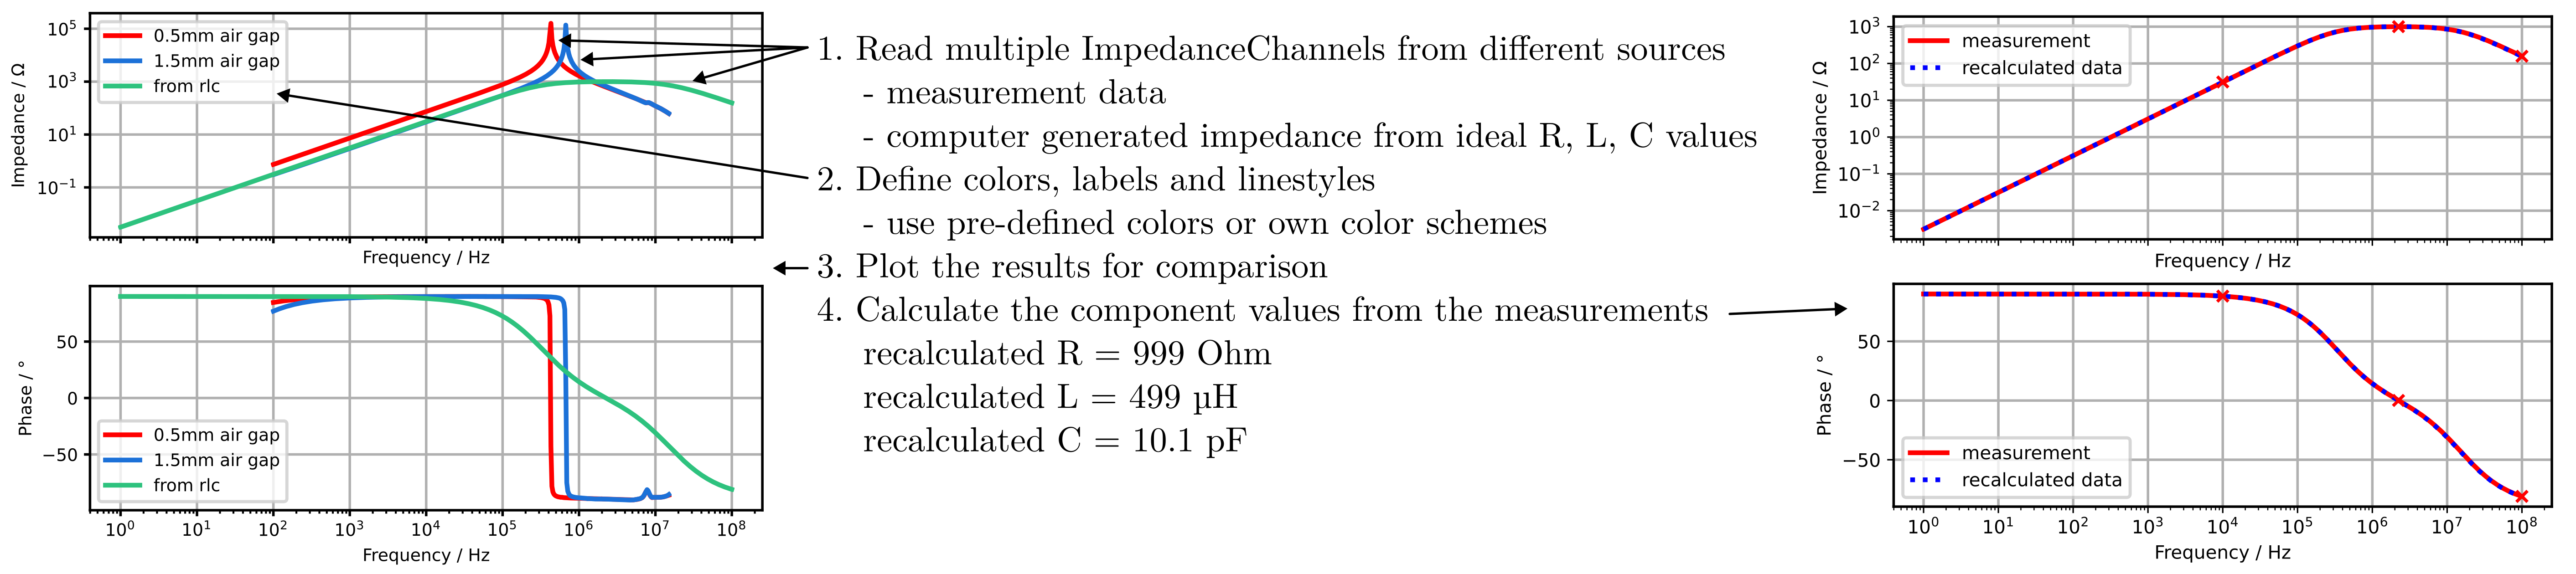
The functionality for the Impedance module is similar to the Scope module. In here, ImpedanceChannel objects can be loaded from different sources, which can be a .csv measurement file from an impedance analyzer or a computer generated curve. ImpedanceChannel objects can be modified in attributes and data, plotted and equivalent circuit parameters can be obtained from measurements.
Have a look at the Scope example and at the Impedance example to see what you can do with this toolbox.
Naming convention
This toolbox is divided into two modules: The functionality of an oscilloscope (Scope) and the functionality of an impedance analyzer (Impedance).
Scope
The Scope module provides functionalities for editing and evaluating individual channels that are also provided by a real oscilloscope - just on a PC. Scope creates, imports, edits or evaluates Channels. The following prefixes apply:
generate_: Generates a new Channel
no prefix: Is applied to a Channel and results in a new Channel (e.g. add() adds two channels)
from_: Generates a Channel from an oscilloscope data set, a simulation program or a calculation (e.g. from_tektronix generates a Channel from a tektronix scope file)
calc_: Calculates individual values from a Channel (e.g. calc_rms() calculates the RMS from a given Channel)
plot_: Plots channels in the desired arrangement (e.g. plot_channels() plots the given Channels)
Impedance
The Impedance module provides functionalities to evaluate impedance curves. Impedance creates, imports, edits or evaluates ImpedanceChannel.
generate_: Generates a new ImpedanceChannel
no prefix: Is applied to a ImpedanceChannel and results in a new ImpedanceChannel (e.g. modify() modifies an ImpedanceChannel)
from_: Generates a ImpedanceChannel from an impedance analyzer data set, a simulation program or a calculation (e.g. from_waynekerr generates a ImpedanceChannel from a real measurement file)
calc_: Calculates individual values from a ImpedanceChannel (e.g. calc_rlc() calculates the equivalent resistance, inductance and capacitance)
plot_: Plots ImpedanceChannel (e.g. plot_impedance() plots the given ImpedanceChannels)
Documentation
Find the documentation here.
Bug Reports
Please use the issues report button within GitHub to report bugs.
Changelog
Find the changelog here.
Release history Release notifications | RSS feed


Download files
Download the file for your platform. If you're not sure which to choose, learn more about installing packages.
Source Distribution
Built Distribution
Filter files by name, interpreter, ABI, and platform.
If you're not sure about the file name format, learn more about wheel file names.
Copy a direct link to the current filters
File details
Details for the file pysignalscope-0.2.1.tar.gz.
File metadata
- Download URL: pysignalscope-0.2.1.tar.gz
- Upload date:
- Size: 6.5 MB
- Tags: Source
- Uploaded using Trusted Publishing? No
- Uploaded via: twine/6.0.1 CPython/3.9.21
File hashes
| Algorithm | Hash digest | |
|---|---|---|
| SHA256 |
b337ab3409d5372c14e7c727ff6ee362a2eaa6d52a1deb1f26ebbfaebd276c83
|
|
| MD5 |
338045c4089f09fcb89e04c21e99c738
|
|
| BLAKE2b-256 |
44635d4f2d263477e923413b207d768dcb93770e4b07d36d6cdfd01388725ad9
|
File details
Details for the file pysignalscope-0.2.1-py3-none-any.whl.
File metadata
- Download URL: pysignalscope-0.2.1-py3-none-any.whl
- Upload date:
- Size: 37.7 kB
- Tags: Python 3
- Uploaded using Trusted Publishing? No
- Uploaded via: twine/6.0.1 CPython/3.9.21
File hashes
| Algorithm | Hash digest | |
|---|---|---|
| SHA256 |
b5dc67113c77c5fec98d287cbb40e7a6b0d1c3c713a1f6b0efd4c5fb500eb2e9
|
|
| MD5 |
40ffbc4f3092ba0a56fecba60d446bef
|
|
| BLAKE2b-256 |
adb44a4bec0b76854a1f4211ae3242273287ff9304898bbd4808d66627a7e032
|


