A package which calculates and visualizes the profitability and the volume change of stocks

Project description
pystockwatch


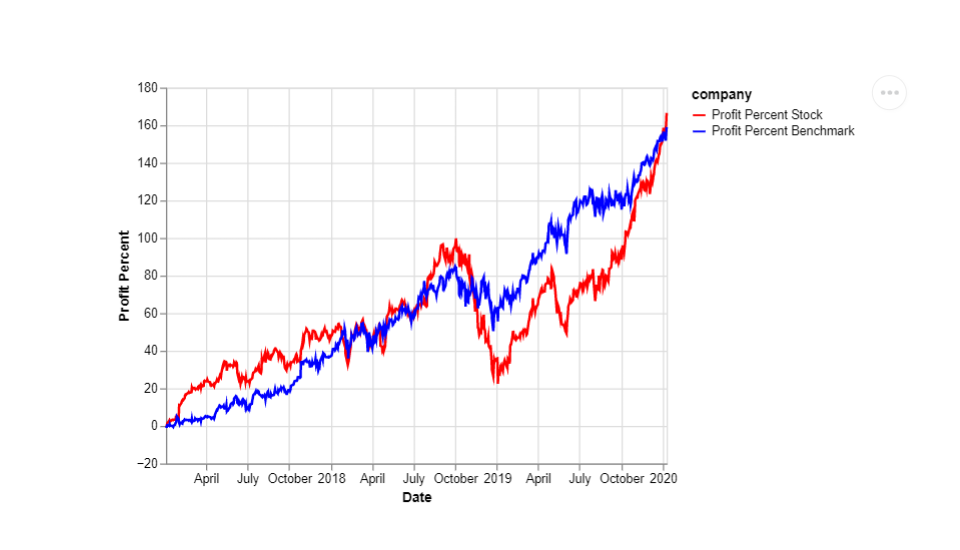
This package has been created to provide a very simple interface for checking movements in stock prices in comparison to the market. This is implemented by accessing public data from Yahoo Finance by selecting a ticker of the stock, range of start and end dates and benchmark for comparison, such as SP500 or NASDAQ. As a result of data processing with pystockwatch package, users will be able to generate two plots: one with two lines showing percentage change in profit since the start date and volumes of trading and another related to daily change in the volume of stock trades as shown at examples below
Functions description
This package is built with following four functions:
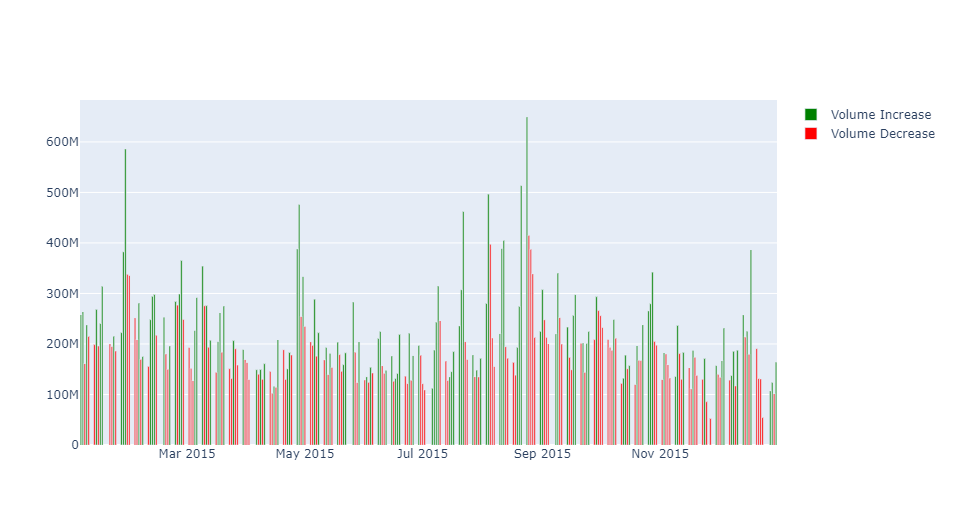
percent_changeCalculation of profit percentage change of a stock for a given period of time based on data extracted from Yahoo finance.profit_vizVisualization of profit percentage change trend of a stock against market benchmark for a given period of time. Note that during weekends and public holidays, stock market has no data available, this is handled in plotting as wellvolume_changeCalculation of daily trading volume change of a stock, whether it is increasing or decreasing. This data is used in next function for color mapping of bar plot.volume_vizVisualization of trading volume as bar plots colored by changes in volume in comparison with previous day. This plot is overlayed with line plots created with the second function. . Note that during weekends and public holidays, stock market has no data available, this is handled in plotting as well
More information about those functions can be found in docstrings of /src/pystockwatch/pystockwatch.py.
Comparison with similar packages
There are many packages written for analysis of stock data. One of the most popular Python package in this category is pyti, which gives a lot of manipulations with time series data, such as creating moving averages of stock price or calculating hundreds of parameters for technical analysis. Power of pystockwatch is in its simplicity, so users are not overwhelmed with all extra features and just have a simple view with key comparisons for a stock of interest.
Installation
$ pip install pystockwatch
Usage
After the sucessful installation of this package user will be required to input four parameters: stock_ticker, start_date, end_date and benchmark_ticker. Output results will be in form of an interactive plot based on "plotly" and "altair" package.
pystockwatch can be used to find the profit percent of stock prices in comparison to the market and check the trend in volume change of stocks and plot results as follows:
Import the functions from package with following commands:
from pystockwatch.pystockwatch import percent_change
from pystockwatch.pystockwatch import profit_viz
from pystockwatch.pystockwatch import volume_change
from pystockwatch.pystockwatch import volume_viz
To check the Profit percent
percent_change('AAPL', '2017-01-01', '2017-01-10')
To Visualize the profit percentage change trend of a stock against market benchmark
fig = profit_viz('AAPL', '2015-01-01', '2021-12-31', 'SPY')
fig.show()
To check daily trading volume change of a stock
volume_change('AAPL', '2021-01-01', '2022-01-01')
To Visualize the volume change trend of a stock
vol = volume_viz('AAPL', '2021-01-01', '2022-01-01')
vol.show()
Documentation
The documentation of this package is hosted on Read the Docs: here
Contributors
- Affrin Sultana
- Helin Wang
- Pavel Levchenko
- Shi Yan Wang
Contributing
Are you interested in contributing? Check out the contributing guidelines. Please note that this project is released with a Code of Conduct. By contributing to this project, you agree to abide by its terms.
Dependencies
Before the installation of this package please install the following packages:
- python = "^3.9"
- pandas = "^1.3.5"
- altair = "^4.2.0"
- altair_viewer = "^0.4.0"
- pandas-datareader = "^0.10.0"
License
pystockwatch was created by Affrin Sultana, Helin Wang, Pavel Levchenko, Shi Yan Wang.It is licensed under the terms of the MIT license.
Credits
pystockwatch was created with cookiecutter and the py-pkgs-cookiecutter template.
Release history Release notifications | RSS feed


Download files
Download the file for your platform. If you're not sure which to choose, learn more about installing packages.
Source Distribution
Built Distribution
Filter files by name, interpreter, ABI, and platform.
If you're not sure about the file name format, learn more about wheel file names.
Copy a direct link to the current filters
File details
Details for the file pystockwatch-0.3.4.tar.gz.
File metadata
- Download URL: pystockwatch-0.3.4.tar.gz
- Upload date:
- Size: 7.3 kB
- Tags: Source
- Uploaded using Trusted Publishing? No
- Uploaded via: twine/3.8.0 pkginfo/1.8.2 readme-renderer/32.0 requests/2.27.1 requests-toolbelt/0.9.1 urllib3/1.26.8 tqdm/4.62.3 importlib-metadata/4.10.1 keyring/23.5.0 rfc3986/2.0.0 colorama/0.4.4 CPython/3.9.10
File hashes
| Algorithm | Hash digest | |
|---|---|---|
| SHA256 |
65ee015e677b93e781045c0736f5f5ac7b9ea1a8d683d69c403305ab0b00ab60
|
|
| MD5 |
6b768dc3a1454b82e382b79f43cabf93
|
|
| BLAKE2b-256 |
f1090ff621c3ff257b618aefbd5efadc8bc3b0a042b335f6760679282ffe7a8e
|
File details
Details for the file pystockwatch-0.3.4-py3-none-any.whl.
File metadata
- Download URL: pystockwatch-0.3.4-py3-none-any.whl
- Upload date:
- Size: 6.9 kB
- Tags: Python 3
- Uploaded using Trusted Publishing? No
- Uploaded via: twine/3.8.0 pkginfo/1.8.2 readme-renderer/32.0 requests/2.27.1 requests-toolbelt/0.9.1 urllib3/1.26.8 tqdm/4.62.3 importlib-metadata/4.10.1 keyring/23.5.0 rfc3986/2.0.0 colorama/0.4.4 CPython/3.9.10
File hashes
| Algorithm | Hash digest | |
|---|---|---|
| SHA256 |
3d3be29100f10df170ef08af819f5bd64b33eadf51a195aa5acfb1383556f7d0
|
|
| MD5 |
d40d2338e633c16ef75b2d55370b2d97
|
|
| BLAKE2b-256 |
ba49ab58df5ae5fdbf67108e866f3d8dbd1f603fbe9488ec5aac4a2bb7be2b6e
|


