
Python Call Graph
Welcome! Python Call Graph is a Python module that creates call graph visualizations for Python applications.
This repo used to be pycallgraph which is still hosted at pypi link.
The uploader makes no representations of their contribution, and merely wanted this to work in python 3.5; with a goal to porting it to 3.11, 3.12 and 3.13
[! NOTE] Please give more ideas for problems or further use-cases for this repo. I am really glad folks like it, but it's mostly the original author work, and I don't yet know what more to add to this.

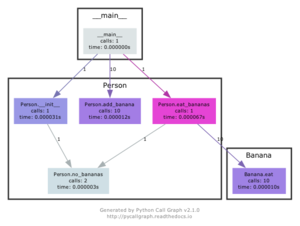
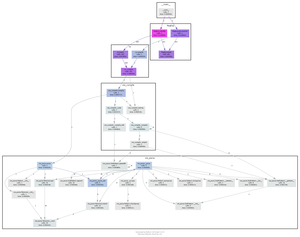
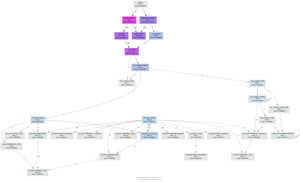
Screenshots
Click on the images below to see a larger version and the source code that generated them.
Project Status
The latest version is 2.1.6 which was released on 2025-06-06. The latest version has been tested running on Python versions 3.8 - 3.13
The project lives on GitHub, where you can report issues, contribute to the project by forking the project then creating a pull request, or just browse the source code.
The documentation needs some work stiil. Feel free to contribute :smile:
Features
- Support for Python 3.8 - 3.13.
- Static visualizations of the call graph using various tools such as Graphviz and Gephi.
- Execute pycallgraph from the command line or import it in your code.
- Customisable colors. You can programatically set the colors based on number of calls, time taken, memory usage, etc.
- Modules can be visually grouped together.
- Easily extendable to create your own output formats.
Quick Start
Installation is easy as
pip install python-call-graph
You can either use the command-line interface for a quick visualization of your Python script, or the pycallgraph module for more fine-grained settings.
The following examples specify graphviz as the outputter, so it's required to be installed. They will generate a file called pycallgraph.png.
The command-line method of running pycallgraph is
pycallgraph graphviz -- ./mypythonscript.py
A simple use of the API is
from pycallgraph import PyCallGraph
from pycallgraph.output import GraphvizOutput

with PyCallGraph(output=GraphvizOutput()):
    code_to_profile()
Documentation
Feel free to browse the documentation of pycallgraph for the usage guide and API reference.
1 maintainer

Metadata
1 maintainer
Release files for python-call-graph 2.1.6
For a detailed explanation of source distributions (sdists) and built distributions (wheels), please see the package formats documentation.
Source distribution (sdist)
| File | Size | Uploaded | |
|---|---|---|---|
| python-call-graph-2.1.6.tar.gz | 471.2 kB | Details |
Release files / python-call-graph-2.1.6.tar.gz
| Download URL | python-call-graph-2.1.6.tar.gz |
|---|---|
| Size | 471.2 kB |
| Tags | Source |
|
SHA-256 checksum How to use checksums |
24d49b1f348b6d85ab5ee886b240d38b983574e995bf38c18bbbe4c01865d950
|
|
BLAKE2b-256 checksum How to use checksums |
85f5d296d6e59a56098321ae032b4a8d1ff43ce999a3f14d8d9e2a61de122784
|
| Upload date | |
|
Uploaded using Trusted Publishing? What is trusted publishing? |
Yes |
| Uploaded via |
twine/6.1.0 CPython/3.13.7
|
Provenance
Provenance describes where a file came from. On PyPI, provenance is shared via attestations, which provide a verifiable record of the build or publishing details. View details, limitations and caveats.


PyPI Publish Attestation
PyPI verified that this artifact, at this checksum, originated from the publisher listed below.
Signed by GitHub Actions, verified by PyPI on Sep 14, 2025.
Transparency log













