
python-lightweight-charts




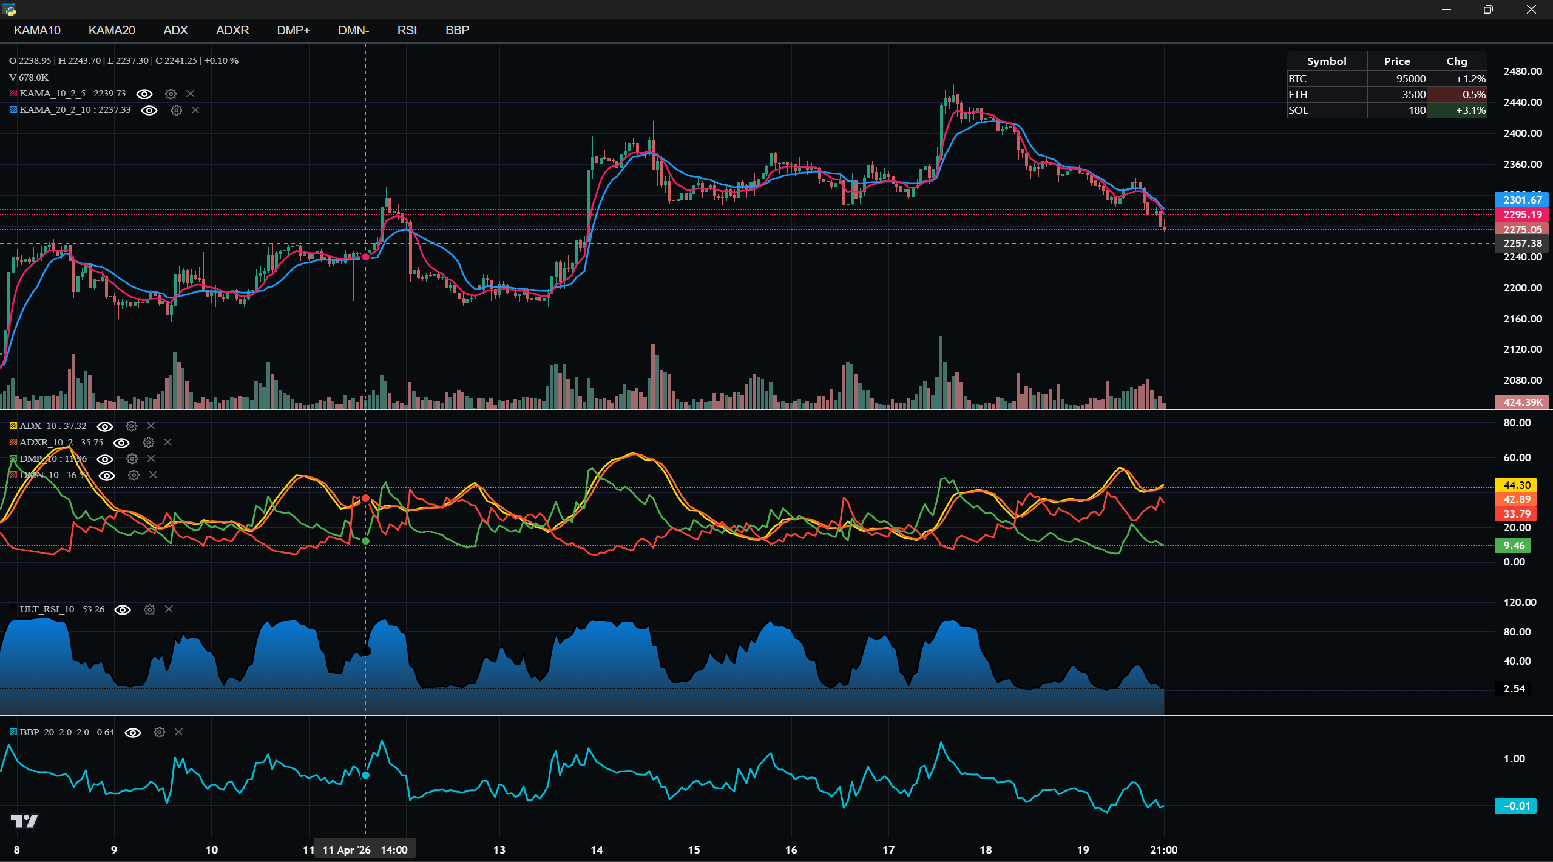
A maintained Python wrapper for TradingView's Lightweight Charts v5.x.
Fork of
louisnw01/lightweight-charts-python— original library by @louisnw01. This fork brings it up to Lightweight Charts v5, addsStreamChart, completes theIChartApisurface, and adds new plugins. Full credit and thanks to the original author.
Installation
pip install python-lightweight-charts
Features
- Streamlined for live data, with methods for updating directly from tick data.
- Multi-pane charts using Subcharts and a full pane-management API (
add_pane,move_pane,resize_pane,remove_pane). - The Toolbox — draw trendlines, rectangles, rays, and horizontal lines directly on charts.
- Events & Callbacks — timeframe selectors, search, hotkeys, and more.
- Tables for watchlists, order entry, and trade management.
- StreamChart — serve a chart over HTTP/WebSocket, viewable in any browser (no desktop window needed).
- Plugins:
Tooltip,BandsIndicator,SessionHighlighting,HeatmapSeries,VolumeProfile,PositionTool. - Full Lightweight Charts v5 IChartApi surface including
price_scale,time_scale, watermark, grid, crosshair, and more. - Direct integration of market data through Polygon.io's market data API.
Supports: Jupyter Notebooks, PyQt6, PyQt5, PySide6, wxPython, Streamlit, and asyncio.
PartTimeLarry: Interactive Brokers API and TradingView Charts in Python
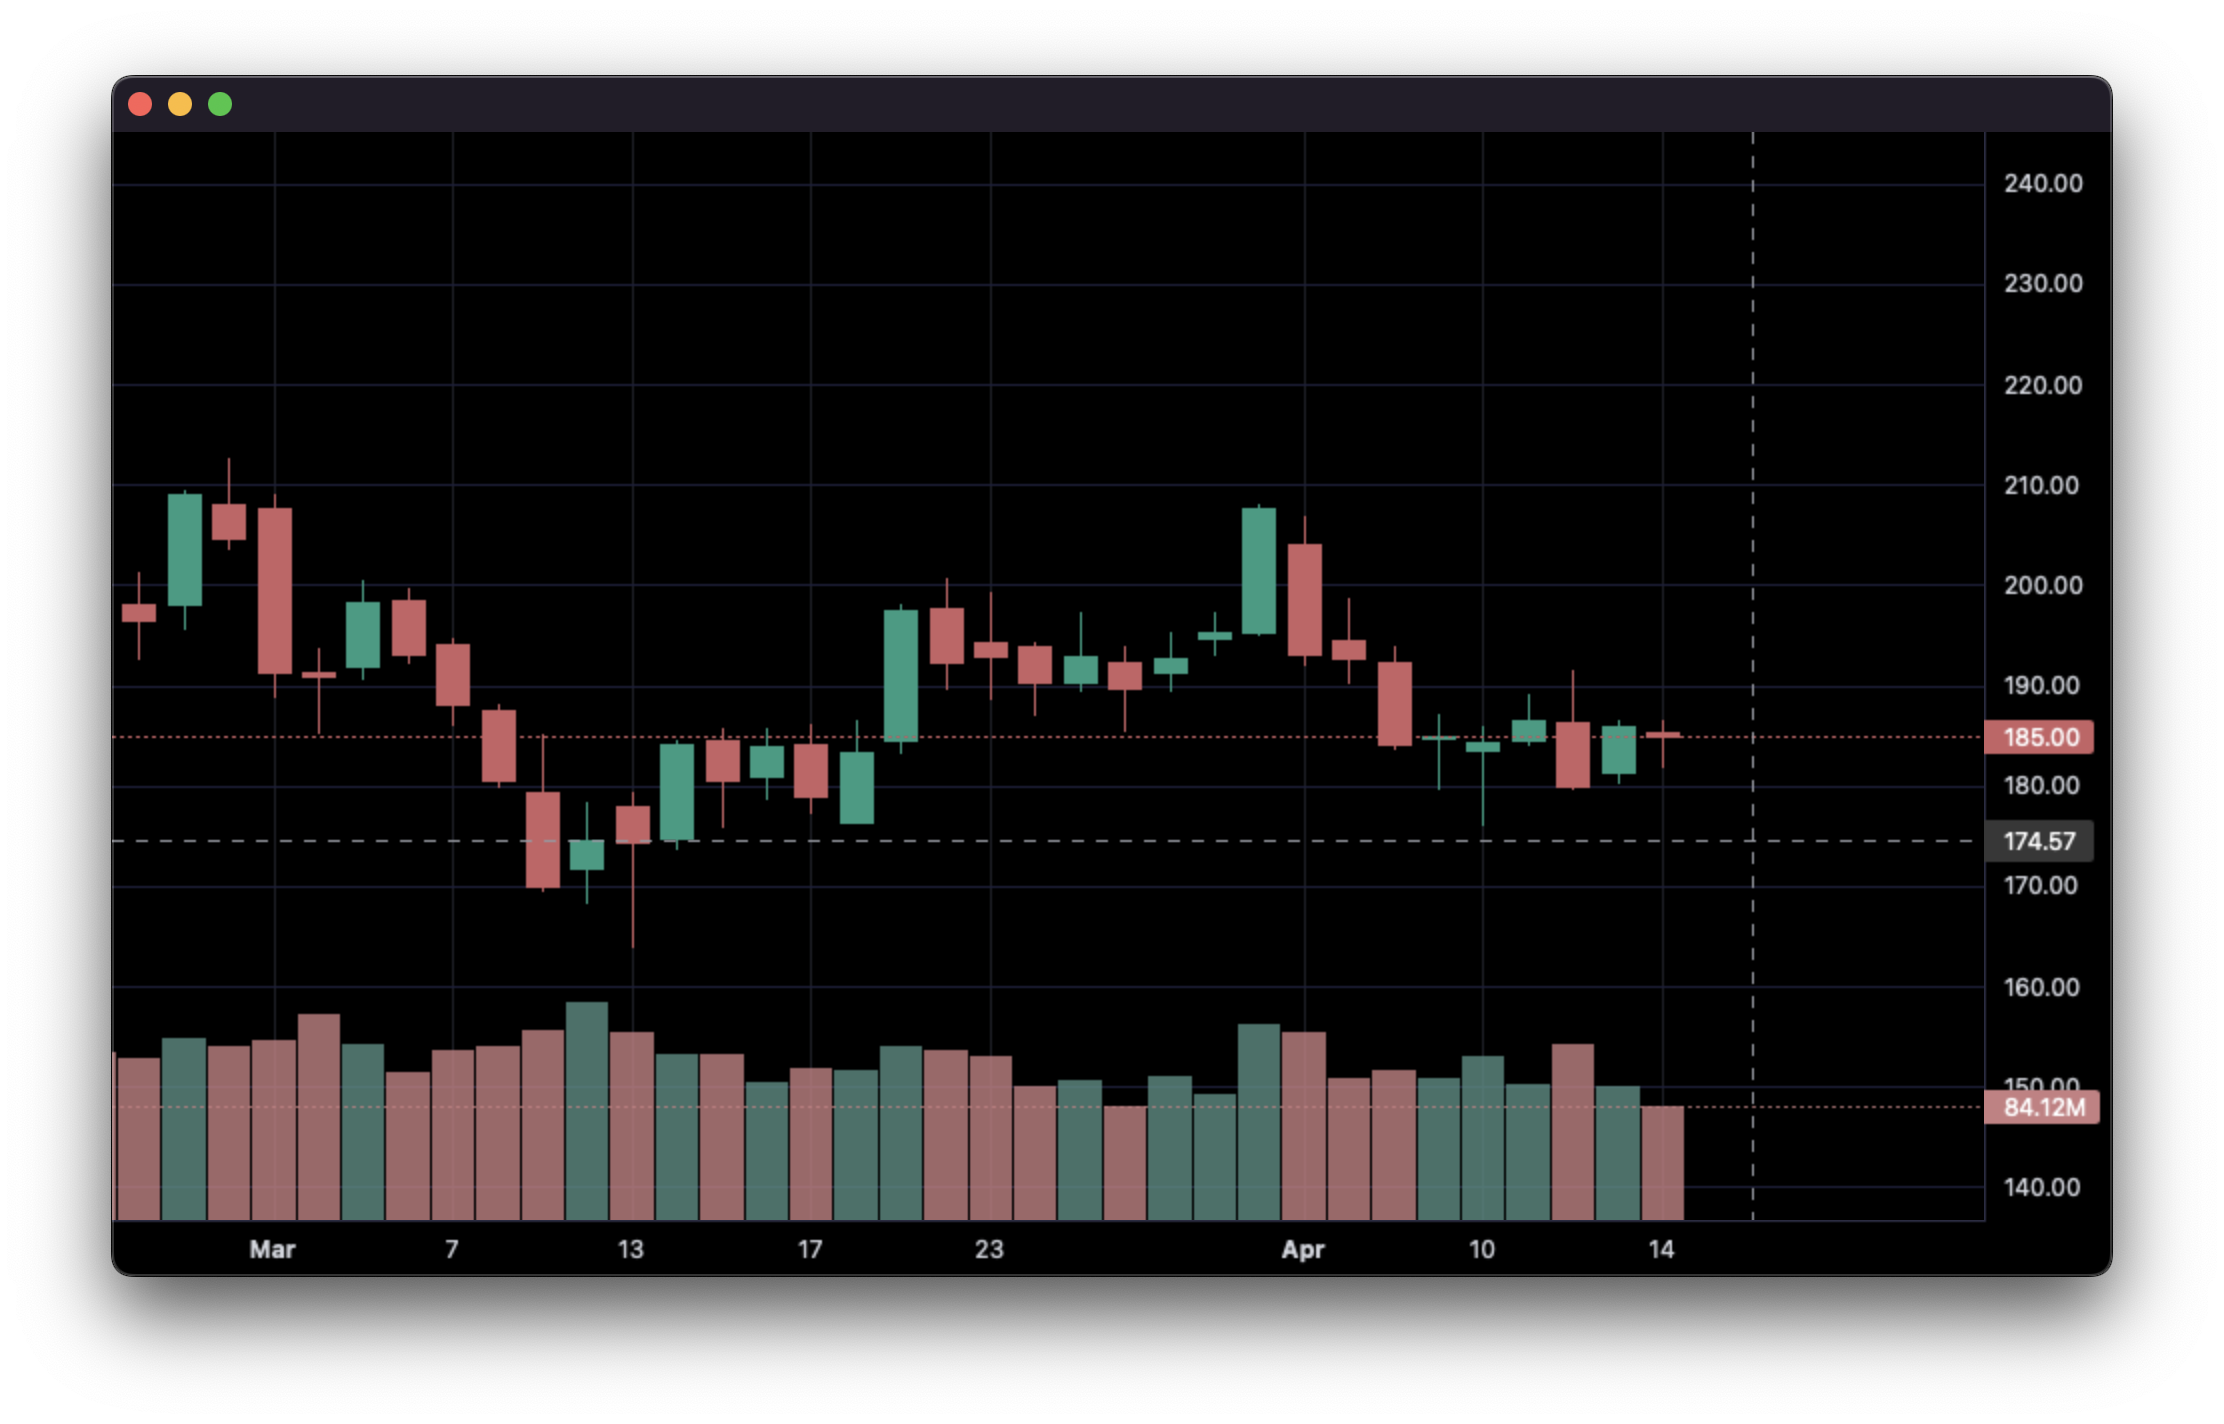
1. Display data from a csv:
import pandas as pd
from lightweight_charts import Chart


if __name__ == '__main__':

    chart = Chart()

    # Columns: time | open | high | low | close | volume
    df = pd.read_csv('ohlcv.csv')
    chart.set(df)

    chart.show(block=True)
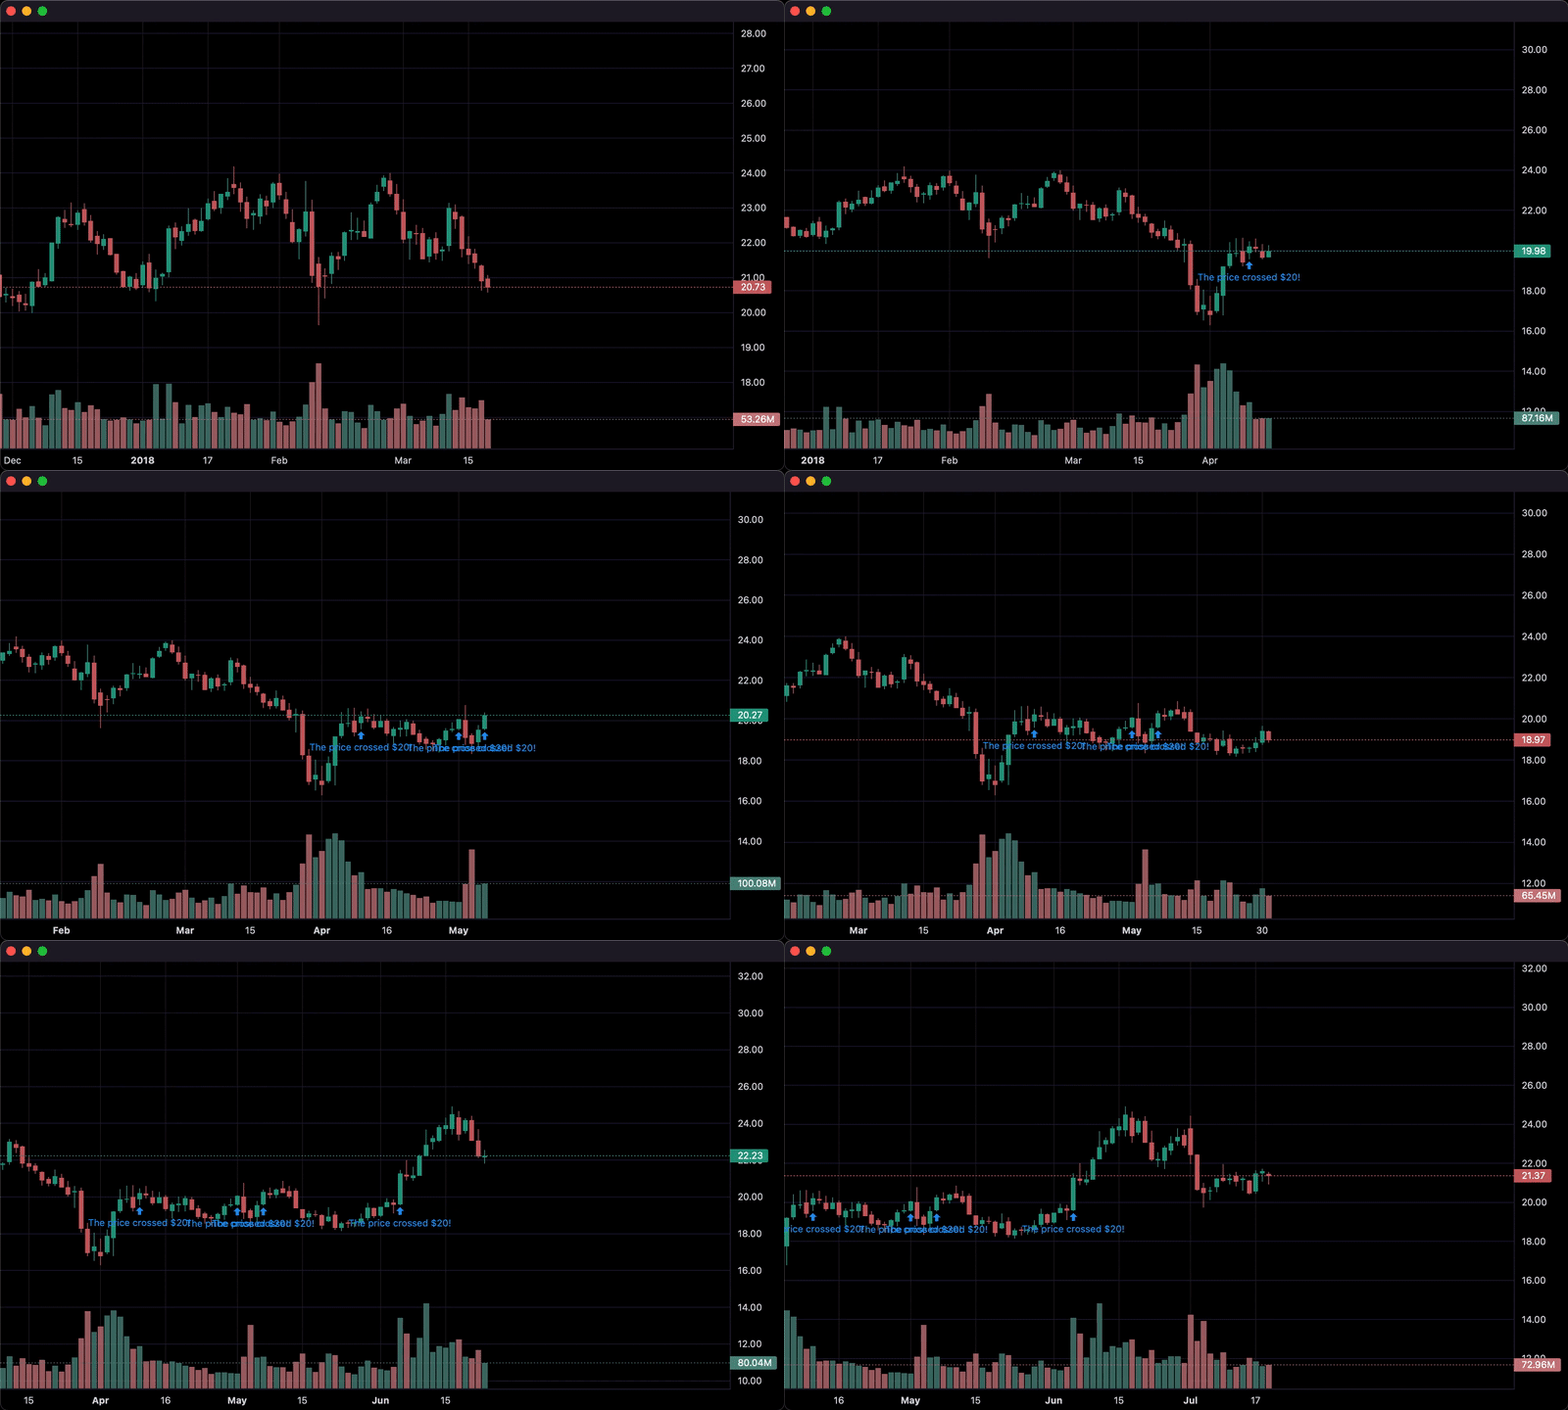
2. Updating bars in real-time:
import pandas as pd
from time import sleep
from lightweight_charts import Chart

if __name__ == '__main__':

    chart = Chart()

    df1 = pd.read_csv('ohlcv.csv')
    df2 = pd.read_csv('next_ohlcv.csv')

    chart.set(df1)

    chart.show()

    last_close = df1.iloc[-1]['close']

    for i, series in df2.iterrows():
        chart.update(series)

        if series['close'] > 20 and last_close < 20:
            chart.marker(text='The price crossed $20!')

        last_close = series['close']
        sleep(0.1)
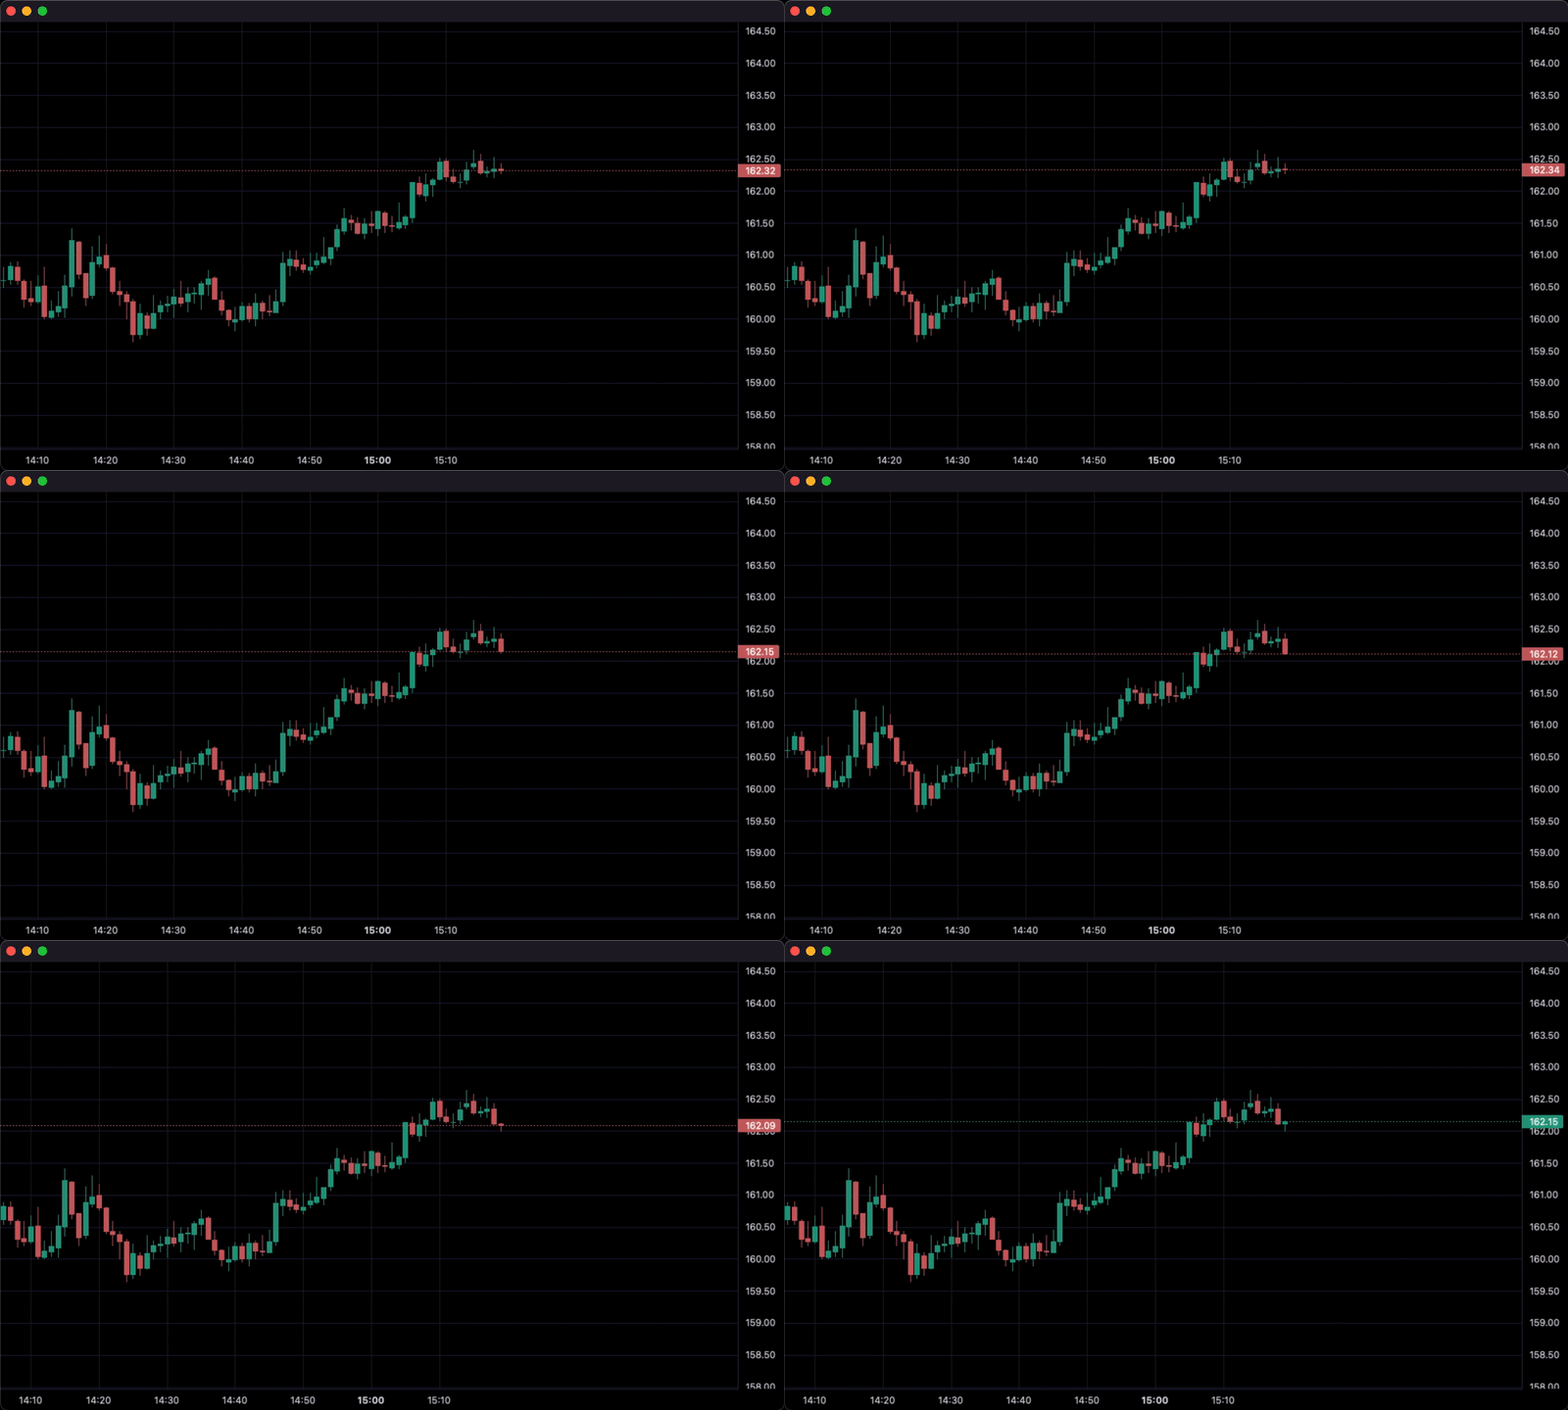
3. Updating bars from tick data in real-time:
import pandas as pd
from time import sleep
from lightweight_charts import Chart


if __name__ == '__main__':

    df1 = pd.read_csv('ohlc.csv')

    # Columns: time | price
    df2 = pd.read_csv('ticks.csv')

    chart = Chart()

    chart.set(df1)

    chart.show()

    for i, tick in df2.iterrows():
        chart.update_from_tick(tick)

        sleep(0.03)
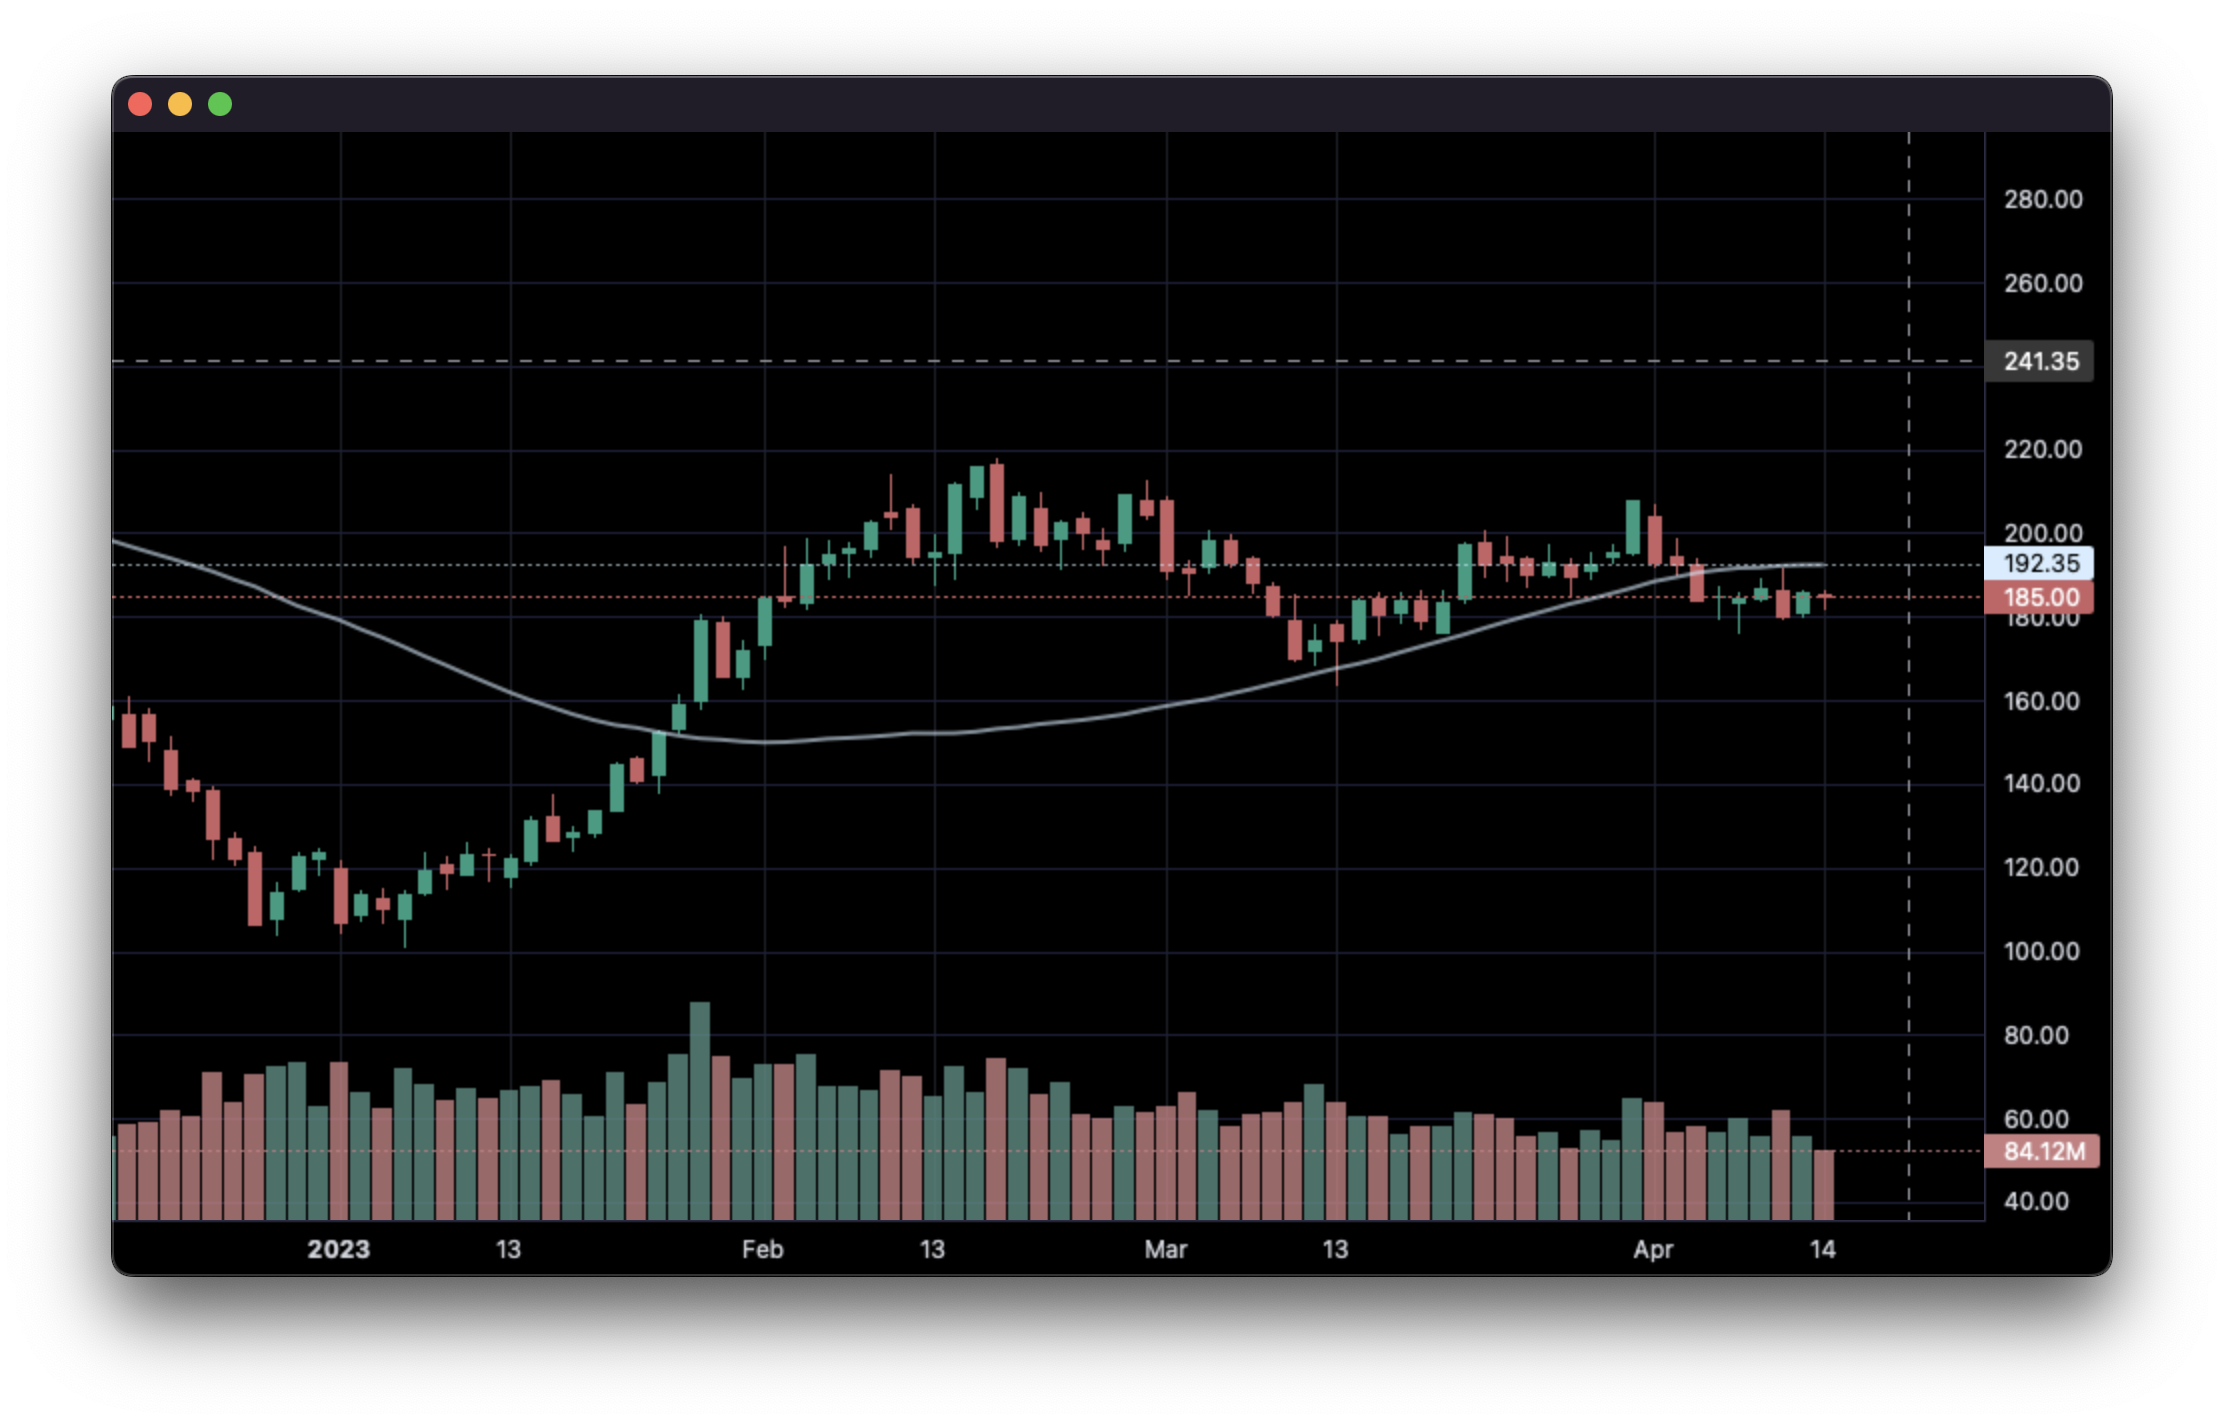
4. Line Indicators:
import pandas as pd
from lightweight_charts import Chart


def calculate_sma(df, period: int = 50):
    return pd.DataFrame({
        'time': df['date'],
        f'SMA {period}': df['close'].rolling(window=period).mean()
    }).dropna()


if __name__ == '__main__':
    chart = Chart()
    chart.legend(visible=True)

    df = pd.read_csv('ohlcv.csv')
    chart.set(df)

    line = chart.create_line('SMA 50')
    sma_data = calculate_sma(df, period=50)
    line.set(sma_data)

    chart.show(block=True)
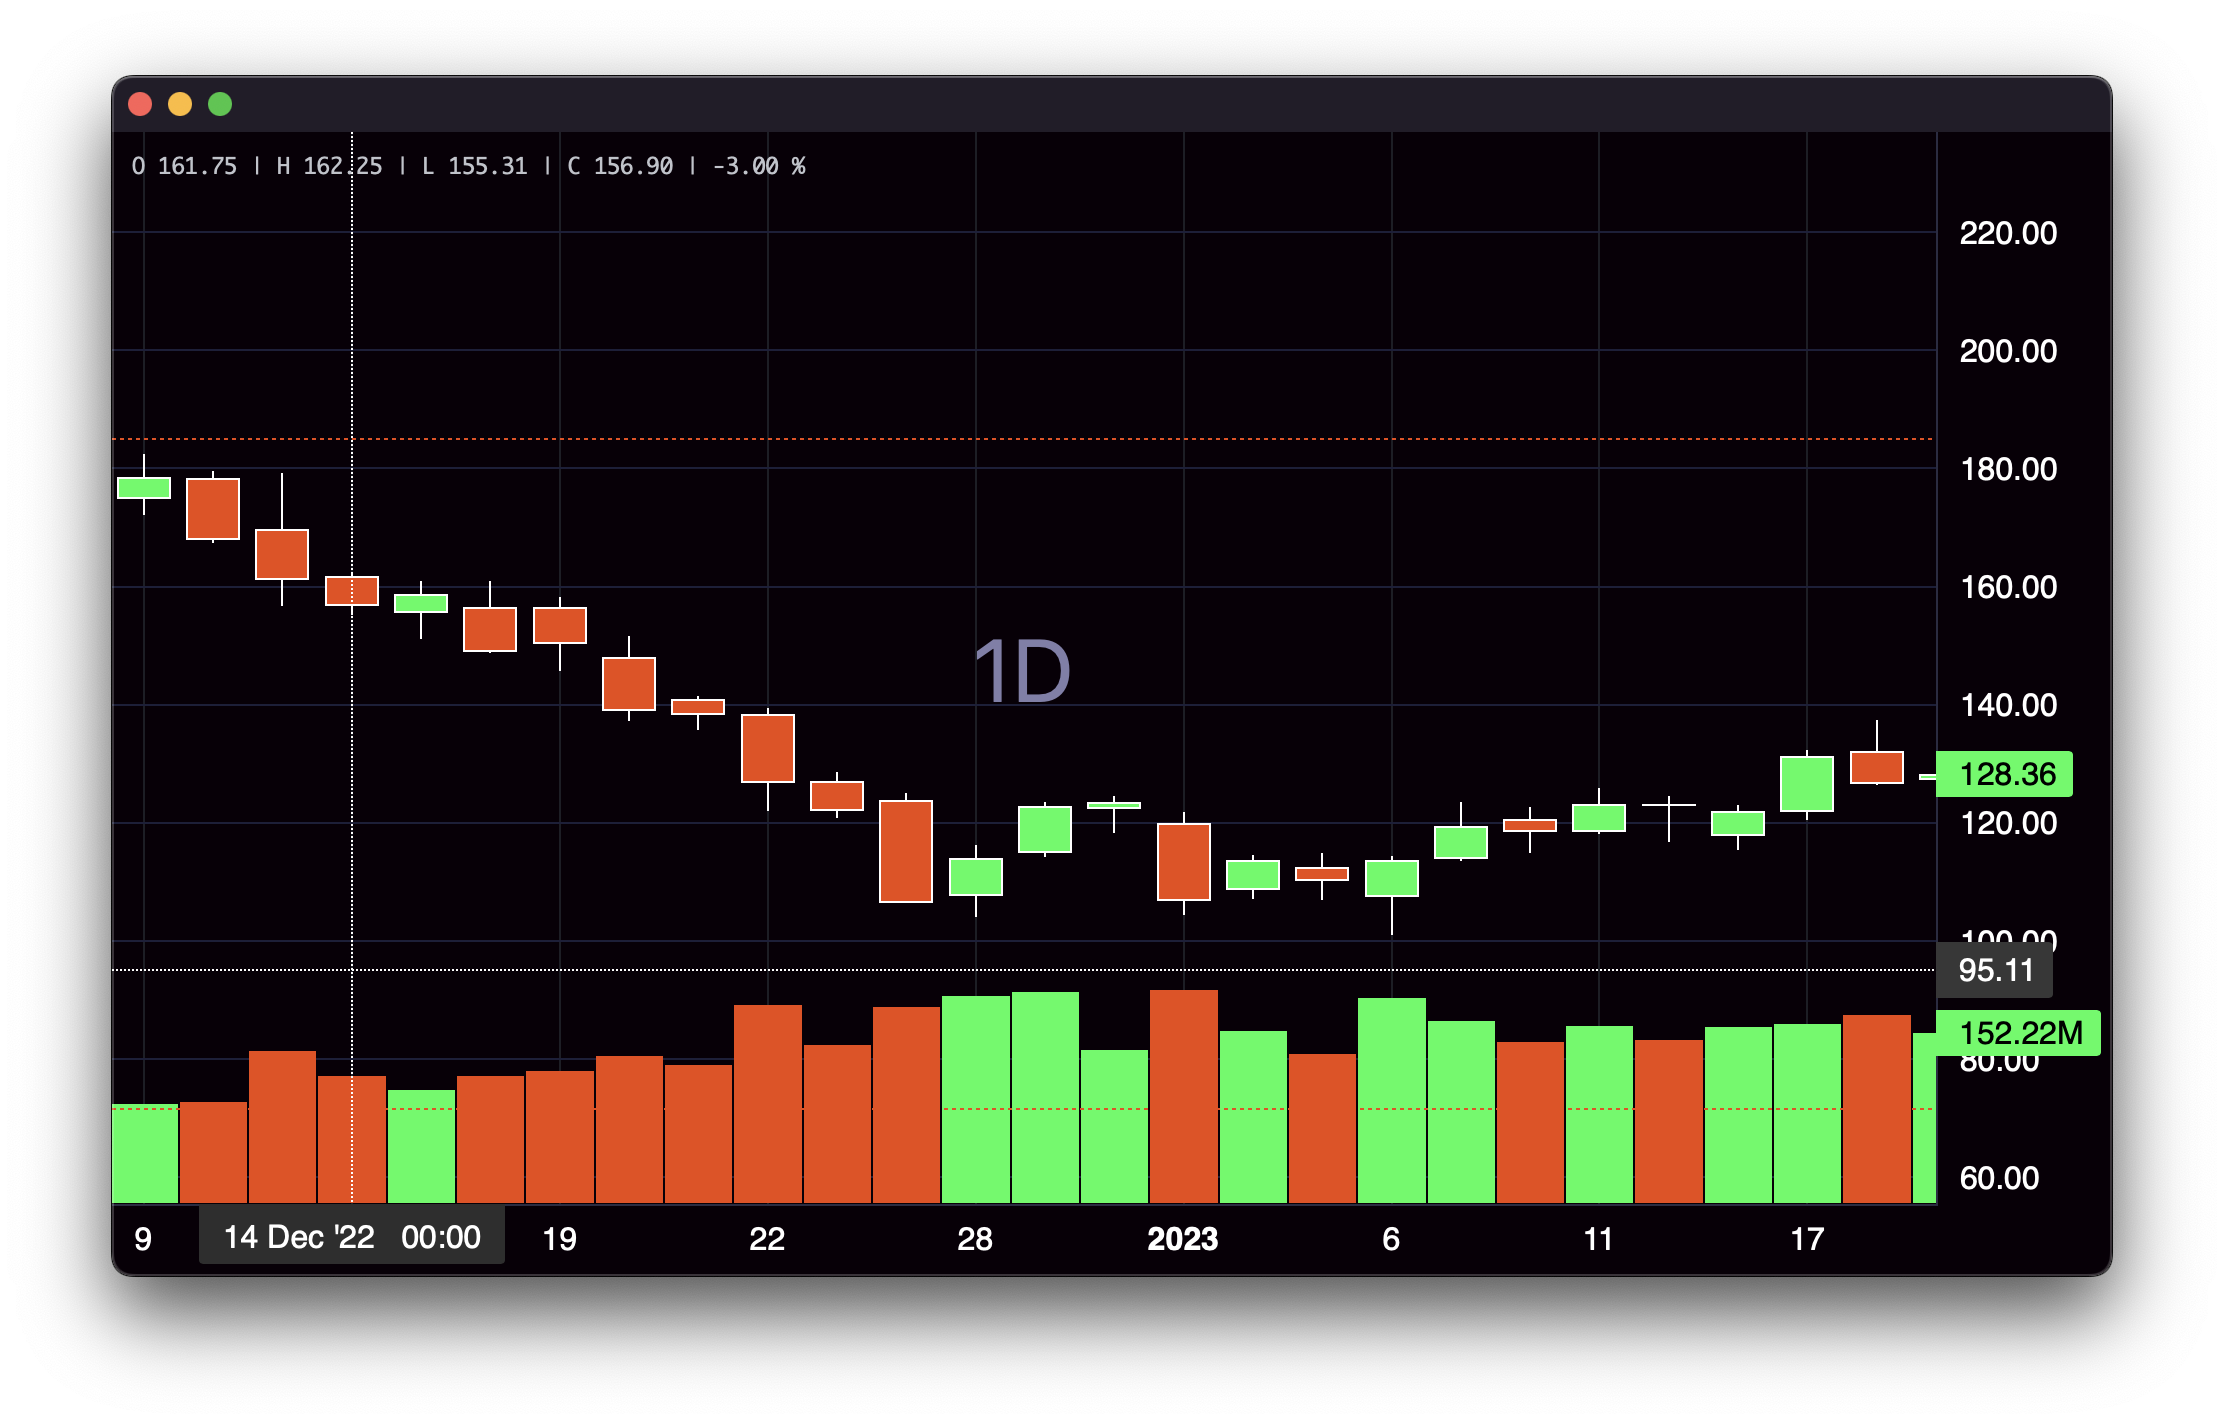
5. Styling:
import pandas as pd
from lightweight_charts import Chart


if __name__ == '__main__':

    chart = Chart()

    df = pd.read_csv('ohlcv.csv')

    chart.layout(background_color='#090008', text_color='#FFFFFF', font_size=16,
                 font_family='Helvetica')

    chart.candle_style(up_color='#00ff55', down_color='#ed4807',
                       border_up_color='#FFFFFF', border_down_color='#FFFFFF',
                       wick_up_color='#FFFFFF', wick_down_color='#FFFFFF')

    chart.volume_config(up_color='#00ff55', down_color='#ed4807')

    chart.watermark('1D', color='rgba(180, 180, 240, 0.7)')

    chart.crosshair(mode='normal', vert_color='#FFFFFF', vert_style='dotted',
                    horz_color='#FFFFFF', horz_style='dotted')

    chart.legend(visible=True, font_size=14)

    chart.set(df)

    chart.show(block=True)
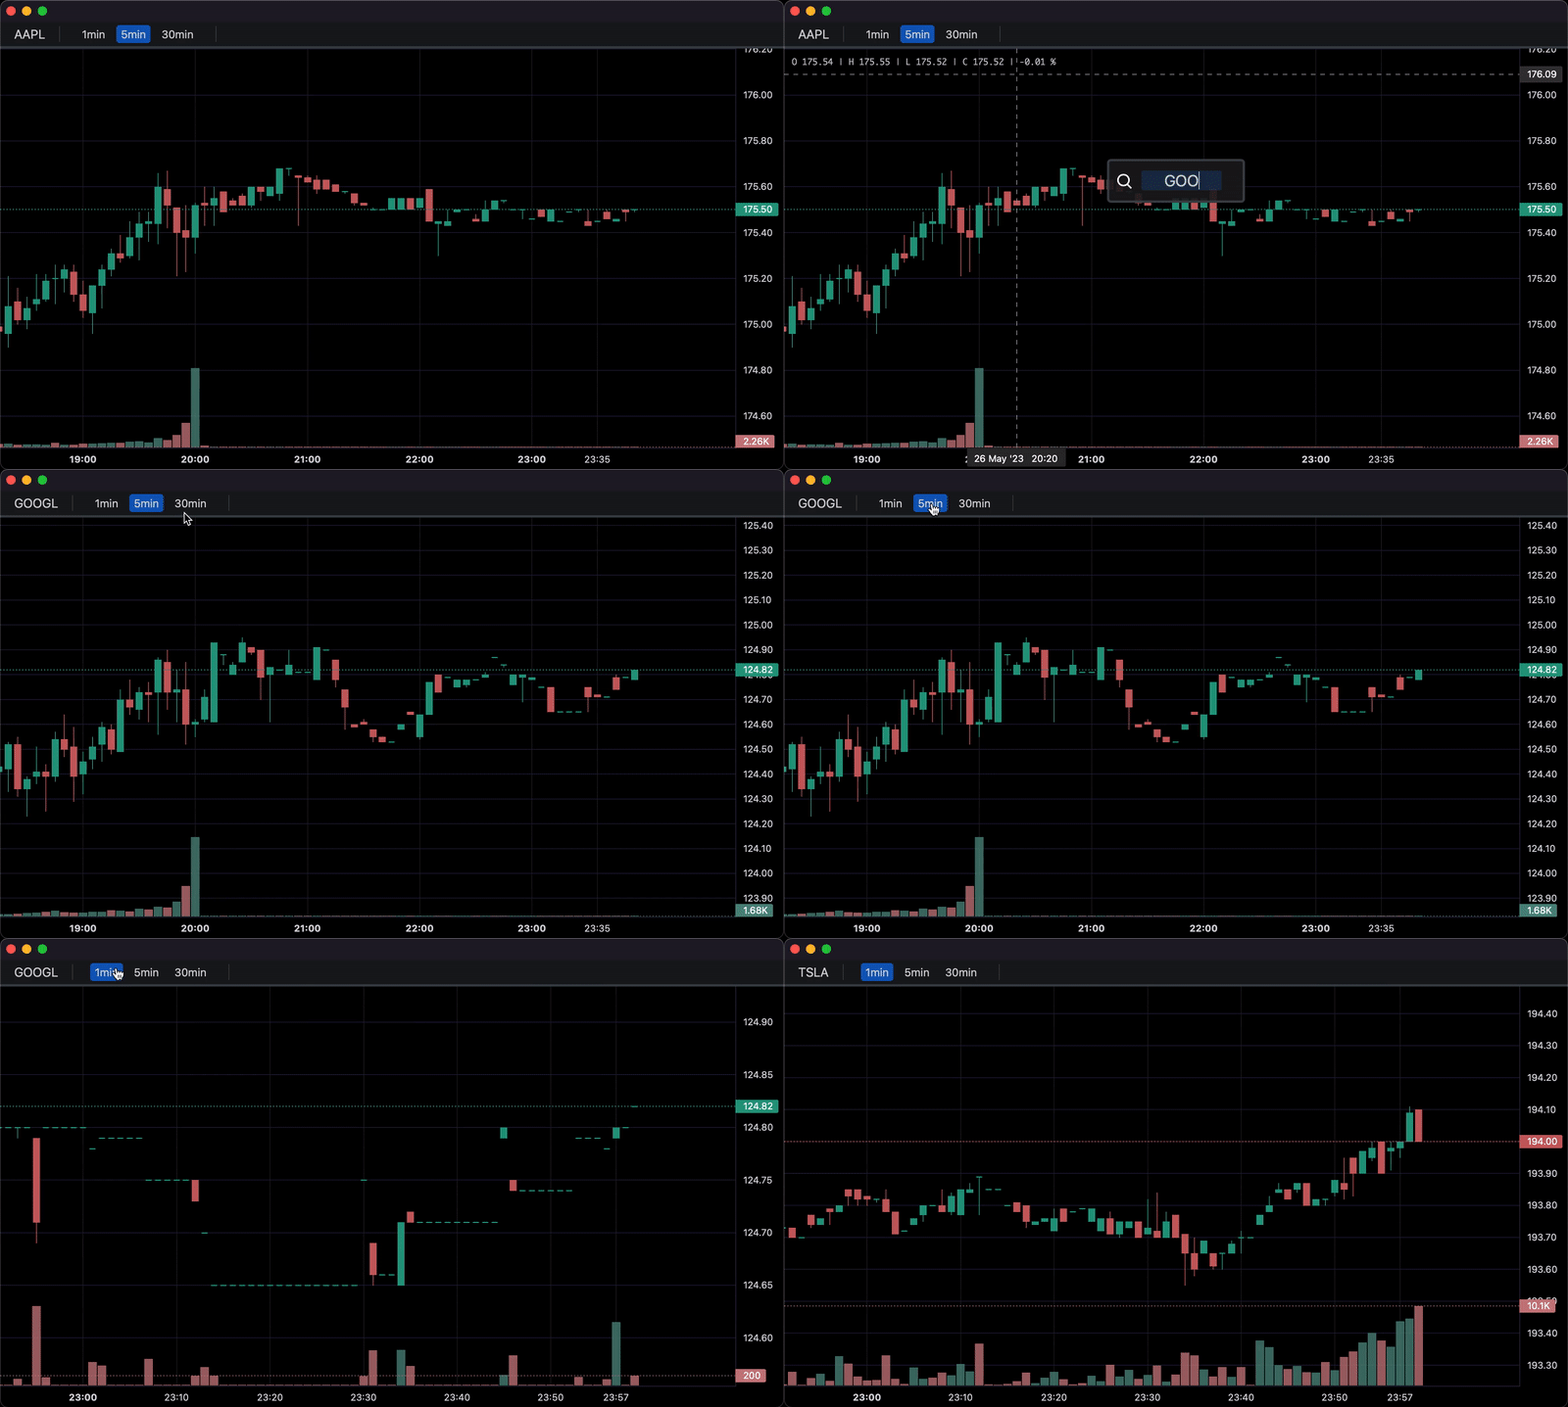
6. Callbacks:
import pandas as pd
from lightweight_charts import Chart


def get_bar_data(symbol, timeframe):
    if symbol not in ('AAPL', 'GOOGL', 'TSLA'):
        print(f'No data for "{symbol}"')
        return pd.DataFrame()
    return pd.read_csv(f'bar_data/{symbol}_{timeframe}.csv')


def on_search(chart, searched_string):  # Called when the user searches.
    new_data = get_bar_data(searched_string, chart.topbar['timeframe'].value)
    if new_data.empty:
        return
    chart.topbar['symbol'].set(searched_string)
    chart.set(new_data)


def on_timeframe_selection(chart):  # Called when the user changes the timeframe.
    new_data = get_bar_data(chart.topbar['symbol'].value, chart.topbar['timeframe'].value)
    if new_data.empty:
        return
    chart.set(new_data, True)


def on_horizontal_line_move(chart, line):
    print(f'Horizontal line moved to: {line.price}')


if __name__ == '__main__':
    chart = Chart(toolbox=True)
    chart.legend(True)

    chart.events.search += on_search

    chart.topbar.textbox('symbol', 'TSLA')
    chart.topbar.switcher('timeframe', ('1min', '5min', '30min'), default='5min',
                          func=on_timeframe_selection)

    df = get_bar_data('TSLA', '5min')
    chart.set(df)

    chart.horizontal_line(200, func=on_horizontal_line_move)

    chart.show(block=True)
7. StreamChart — browser-based chart over HTTP/WebSocket:
StreamChart spins up a local FastAPI/Uvicorn server and streams data to any browser tab. No desktop window is required — ideal for headless servers, notebooks, or remote development.
import pandas as pd
from lightweight_charts import StreamChart

if __name__ == '__main__':
    chart = StreamChart()

    df = pd.read_csv('ohlcv.csv')   # columns: time | open | high | low | close | volume
    chart.set(df)

    chart.show(port=8080, block=True)
Running the script prints a URL such as:
Chart server running at http://127.0.0.1:8080/?token=<64-hex-chars> — press Ctrl+C to stop
Open that URL in your browser to view the chart. The URL contains a one-time security token — keep it private.
Tip: pass
open_browser=Truetochart.show()to launch the browser automatically.
8. Plugins:
import pandas as pd
from lightweight_charts import Chart
from lightweight_charts.plugins import BandsIndicator, Tooltip

if __name__ == '__main__':
    chart = Chart()

    df = pd.read_csv('ohlcv.csv')
    chart.set(df)

    # Bollinger Bands
    upper = df['close'].rolling(20).mean() + 2 * df['close'].rolling(20).std()
    lower = df['close'].rolling(20).mean() - 2 * df['close'].rolling(20).std()
    bands = BandsIndicator(chart)
    bands.set(df['time'], upper, lower)

    # Hover tooltip
    tooltip = Tooltip(chart)

    chart.show(block=True)
Available plugins: Tooltip, BandsIndicator, SessionHighlighting, HeatmapSeries, VolumeProfile, PositionTool.
See the examples/ directory for a runnable script for each plugin.
Maintained by Gopal Parashar · gopal.parashar421@gmail.com
This is a maintained fork of louisnw01/lightweight-charts-python by @louisnw01. Full credit to the original author.
This package is an independent creation and has not been endorsed, sponsored, or approved by TradingView. The author of this package does not have any official relationship with TradingView, and the package does not represent the views or opinions of TradingView.
1 maintainer

Release files for python-lightweight-charts 1.3.0
For a detailed explanation of source distributions (sdists) and built distributions (wheels), please see the package formats documentation.
Source distribution (sdist)
| File | Size | Uploaded | |
|---|---|---|---|
| python_lightweight_charts-1.3.0.tar.gz | 211.6 kB | Details |
Built distribution (wheel)
| File | Interpreter | ABI | Platform | Reset |
|---|---|---|---|---|
| python_lightweight_charts-1.3.0-py3-none-any.whl | Python 3 | none | any | Details |
Total release size: 424.9 kB
Release files / python_lightweight_charts-1.3.0.tar.gz
| Download URL | python_lightweight_charts-1.3.0.tar.gz |
|---|---|
| Size | 211.6 kB |
| Tags | Source |
|
SHA-256 checksum How to use checksums |
75030ebde86ca8d1d4b2502a198e13b1c7dfdcd134472c5249fd94be8e6a7427
|
|
BLAKE2b-256 checksum How to use checksums |
a4b135e5b0aad2facc29bfe5e0783a8582e37b117ad815f68cdaf6fed1146b2f
|
| Upload date | |
|
Uploaded using Trusted Publishing? What is trusted publishing? |
Yes |
| Uploaded via |
twine/6.1.0 CPython/3.13.12
|
Provenance
Provenance describes where a file came from. On PyPI, provenance is shared via attestations, which provide a verifiable record of the build or publishing details. View details, limitations and caveats.


PyPI Publish Attestation
PyPI verified that this artifact, at this checksum, originated from the publisher listed below.
Signed by GitHub Actions, verified by PyPI on Jun 19, 2026.
Transparency logRelease files / python_lightweight_charts-1.3.0-py3-none-any.whl
| Download URL | python_lightweight_charts-1.3.0-py3-none-any.whl |
|---|---|
| Size | 213.3 kB |
| Tags | Python 3 |
|
SHA-256 checksum How to use checksums |
dd6fcf672e0e318cdc3983e8070b0759d0147bca26bdf7da55b4ebd55dc2ee75
|
|
BLAKE2b-256 checksum How to use checksums |
109a3c92ff5c1cbeaf517a3d1c55f408bb87f051a42834778c2a8f40ff238501
|
| Upload date | |
|
Uploaded using Trusted Publishing? What is trusted publishing? |
Yes |
| Uploaded via |
twine/6.1.0 CPython/3.13.12
|
Provenance
Provenance describes where a file came from. On PyPI, provenance is shared via attestations, which provide a verifiable record of the build or publishing details. View details, limitations and caveats.
PyPI Publish Attestation
PyPI verified that this artifact, at this checksum, originated from the publisher listed below.
Signed by GitHub Actions, verified by PyPI on Jun 19, 2026.
Transparency log













