
python-statsd
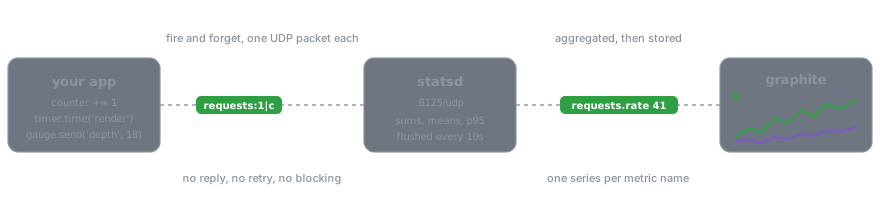










python-statsd is a client for Etsy's statsd server, a front end and proxy
for the Graphite stats collection and graphing server. It supports Python
3.10 and newer, and it has no dependencies.
pip install python-statsd
import statsd

counter = statsd.Counter('app')
counter += 1

with statsd.Timer('app').time('render'):
    pass  # the work you are measuring
Two metrics, two UDP packets, nothing blocking. A statsd server that is down costs you graphs rather than requests.
What goes on the wire
Every line under udp :8125 < in this recording is a packet the client
sent, caught by a real listener on the other end:
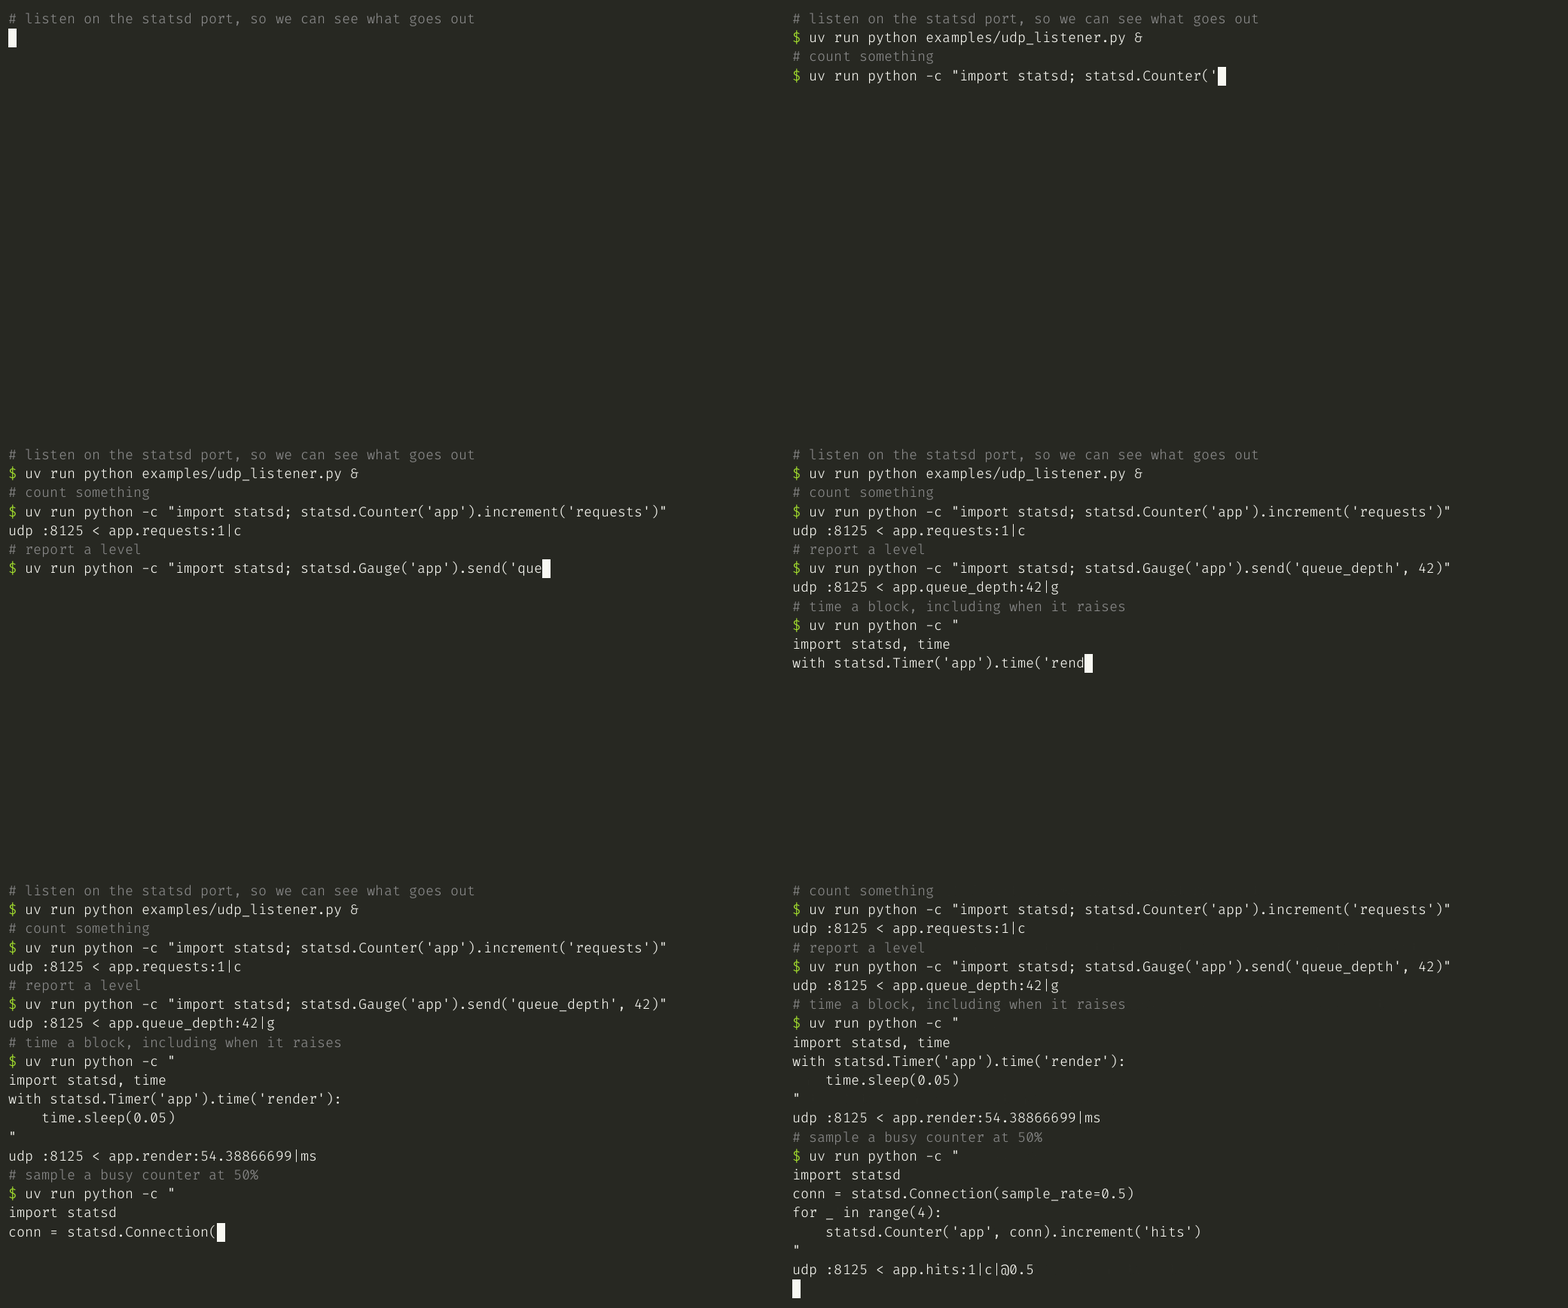
Note the last one. At sample_rate=0.5 four increments produced a single
packet, and it carries |@0.5 so the server knows to multiply back up.
The metric types
| Type | A burst of values becomes | Reach for it when |
|---|---|---|
Counter |
their sum | you are counting events |
Gauge |
the last one | you are reporting a level |
Timer |
mean, median, percentiles | you are measuring duration |
Average |
their mean | the server should average samples |
Raw |
stored as sent | you already did the summarising |
import statsd

counter = statsd.Counter('app')
counter.increment('requests')  # app.requests:1|c

gauge = statsd.Gauge('app')
gauge.send('queue_depth', 42)  # app.queue_depth:42|g

average = statsd.Average('app')
average.send('batch', 123)  # app.batch:123|a

raw = statsd.Raw('app')
raw.send('summary', 42, timestamp=1234567890)  # app.summary:42|r|1234567890
Timers come in three forms, and the context manager is the one to reach for, because it reports the block that raised as well as the block that did not:
import statsd

timer = statsd.Timer('app')

with timer.time('render'):
    pass  # the work you are measuring


@timer.decorate
def render_page():  # sends app.render_page
    pass
Names build themselves when you nest clients, which keeps the string formatting out of your call sites:
import statsd

app = statsd.Client('app')
queries = app.get_client('database').get_client('queries', statsd.Counter)

queries.increment()  # app.database.queries:1|c
See it working
The repository ships a compose file with statsd, Graphite and Grafana, so you can watch a metric arrive instead of taking anyone's word for it:
docker compose up -d
uv run python examples/send_metrics.py --seconds 120
Then open http://localhost:3000. Grafana comes up with the datasource configured and this dashboard loaded, no login in the way:
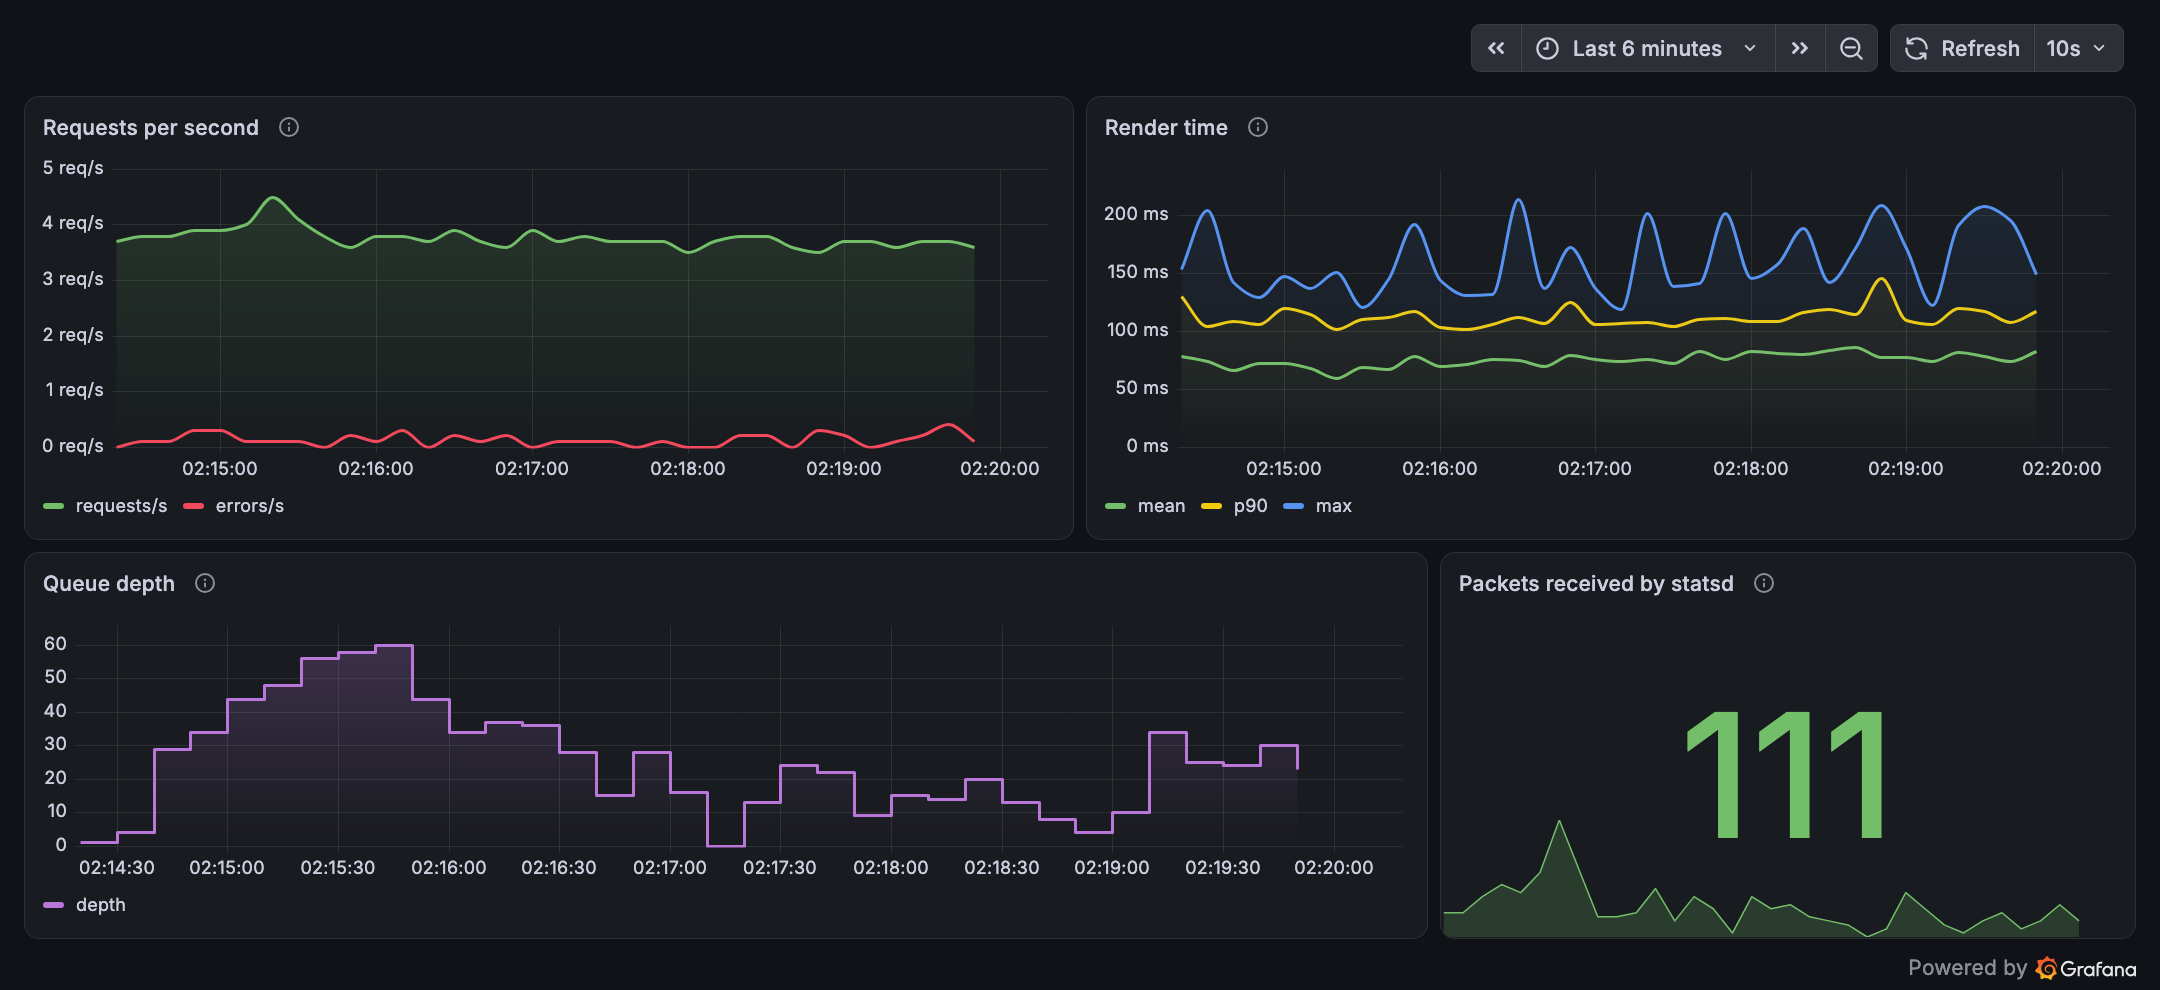
That screenshot is the stack in this repository, fed by
examples/send_metrics.py through this client. The
local stack guide
covers how statsd renames your metrics on the way through, and what to
check when nothing shows up.
Configuration
Set the defaults once at startup and every client built afterwards follows:
import statsd

statsd.Connection.set_defaults(host='localhost', port=8125, sample_rate=1)
Or build connections yourself when one destination is not enough:
import statsd

connection = statsd.Connection(host='statsd-1', port=8125, sample_rate=0.1)
statsd.Counter('app.requests', connection).increment()
One trap worth knowing before it costs you an afternoon: a falsy argument
means "use the default", so Connection(sample_rate=0) sends everything.
Pass disabled=True to send nothing.
Documentation
Full documentation is at python-statsd.readthedocs.io.
- Metrics: the five types, how to choose, and the exact bytes each one writes
- Connections: destinations, sampling, disabling, failure behaviour, threads and forks
- Patterns: naming, cardinality, client trees, WSGI and Celery integration
- Local stack: docker compose, and how to debug a metric that never arrives
For Django, use django-statsd, the sister project built on this client. It times views and reports the queries per request without you writing any of it.
Note on the package name
This project is published on PyPI as python-statsd and installs a module
called statsd. A different project, jsocol's client, is published as
statsd and installs a module called statsd as well. Installing both in
one environment leaves you with whichever was written last, so pick one.
Contributing
Bug reports and patches are welcome, and CONTRIBUTING.md covers the
development setup: uv sync --all-extras, uv run pytest, and
uv run tox -p auto to run everything CI runs. Every code sample in this
README and in the documentation is executed by the test suite, so a change
in behaviour tends to tell you which paragraph it just made wrong.
Links
- Source: https://github.com/WoLpH/python-statsd
- Issues: https://github.com/WoLpH/python-statsd/issues
- Statsd: https://github.com/etsy/statsd
- Graphite: https://graphiteapp.org/
2 maintainers


Download files
Download the file for your platform. If you're not sure which to choose, learn more about installing packages.
Source Distribution
Built Distribution
Filter files by name, interpreter, ABI, and platform.
If you're not sure about the file name format, learn more about wheel file names.
Copy a direct link to the current filters
File details
Details for the file python_statsd-3.0.0.tar.gz.
File metadata
- Download URL: python_statsd-3.0.0.tar.gz
- Upload date:
- Size: 12.4 kB
- Tags: Source
- Uploaded using Trusted Publishing? Yes
- Uploaded via:
twine/7.0.0 CPython/3.13.14
File hashes
| Algorithm | Hash digest | |
|---|---|---|
| SHA256 |
f7f7957ddf6757a231e316ef2ca6bd47ce33a701c57b4049406308f811e9f76e
|
|
| MD5 |
b33f05ea37fd30f6ee299fbc612098b2
|
|
| BLAKE2b-256 |
01a5f881bb12332f80aa016998b6779aa5966bd8dc57f92c327a6f1fb8d3a1e7
|
Provenance
The following attestation bundles were made for python_statsd-3.0.0.tar.gz:
Publisher:
publish.yml on wolph/python-statsd
-
Statement:
-
Statement type:
https://in-toto.io/Statement/v1 -
Predicate type:
https://docs.pypi.org/attestations/publish/v1 -
Subject name:
python_statsd-3.0.0.tar.gz -
Subject digest:
f7f7957ddf6757a231e316ef2ca6bd47ce33a701c57b4049406308f811e9f76e - Sigstore transparency entry: 2807390805
- Sigstore integration time:
-
Permalink:
wolph/python-statsd@8013b7d0f1375294892fa63419a64006f8d63d1f -
Branch / Tag:
refs/tags/v3.0.0 - Owner: https://github.com/wolph
-
Access:
public
-
Token Issuer:
https://token.actions.githubusercontent.com -
Runner Environment:
github-hosted -
Publication workflow:
publish.yml@8013b7d0f1375294892fa63419a64006f8d63d1f -
Trigger Event:
release
-
Statement type:
File details
Details for the file python_statsd-3.0.0-py3-none-any.whl.
File metadata
- Download URL: python_statsd-3.0.0-py3-none-any.whl
- Upload date:
- Size: 15.7 kB
- Tags: Python 3
- Uploaded using Trusted Publishing? Yes
- Uploaded via:
twine/7.0.0 CPython/3.13.14
File hashes
| Algorithm | Hash digest | |
|---|---|---|
| SHA256 |
2ab8f8722f6725ecc39895b6ffe9f2a6752b6aa00786b77cc66058d06e06d320
|
|
| MD5 |
5291776bc8f023d8e6ae321272d8e4a3
|
|
| BLAKE2b-256 |
d727b9dabdcaf24c8a6e366deae5c22a5d9015dca9900451fdb8d3f834249f5e
|
Provenance
The following attestation bundles were made for python_statsd-3.0.0-py3-none-any.whl:
Publisher:
publish.yml on wolph/python-statsd
-
Statement:
-
Statement type:
https://in-toto.io/Statement/v1 -
Predicate type:
https://docs.pypi.org/attestations/publish/v1 -
Subject name:
python_statsd-3.0.0-py3-none-any.whl -
Subject digest:
2ab8f8722f6725ecc39895b6ffe9f2a6752b6aa00786b77cc66058d06e06d320 - Sigstore transparency entry: 2807390854
- Sigstore integration time:
-
Permalink:
wolph/python-statsd@8013b7d0f1375294892fa63419a64006f8d63d1f -
Branch / Tag:
refs/tags/v3.0.0 - Owner: https://github.com/wolph
-
Access:
public
-
Token Issuer:
https://token.actions.githubusercontent.com -
Runner Environment:
github-hosted -
Publication workflow:
publish.yml@8013b7d0f1375294892fa63419a64006f8d63d1f -
Trigger Event:
release
-
Statement type:














