
pytracecall: A debugging module with sync and async decorators (CallTracer and aCallTracer) for tracing function calls, and a function (stack) for logging the current call stack

Project description





A powerful, flexible, and user-friendly debugging module for tracing function calls in Python.
pytracecall provides simple yet powerful tools to help you understand your code's execution flow without a full step-by-step debugger. It is designed to integrate seamlessly with Python's standard logging module and can produce output for human analysis, IDEs, and automated systems.
Why PyTraceCall?
- Unmatched Insight, Zero Intrusion: Get deep insights into your code's execution flow, arguments, return values, and performance without modifying your core logic. The decorator pattern keeps your code clean and readable.
- Debug Concurrency with Confidence: Built from the ground up with
contextvars,pytracecallprovides clear, isolated traces for complexasyncioapplications, eliminating the guesswork of concurrent execution flows. - From Quick Glance to Deep Analysis: Whether you need a quick print-style debug, a detailed performance profile with exclusive timings, or structured JSON for automated analysis, the flexible API scales to your needs.
- Highly Configurable & User-Friendly: Fine-tune everything from output colors and argument visibility to conditional tracing triggers. The power is in your hands.
- A Joy to Use: With features like clickable IDE/terminal integration and beautiful
richtree views, debugging stops being a chore and becomes an insightful, and even enjoyable, experience.
Features
-
Synchronous and Asynchronous Tracing: Decorators for both standard (
def) and asynchronous (async def) functions. -
Concurrency Safe: Uses
contextvarsto safely trace concurrent tasks without mixing up call chains. -
A variety of output options:
- Traditional Text Output: It is default, the old school never dies.
- IDE & Terminal Integration: Optionally generates log entries that are clickable in modern IDEs (VSCode, PyCharm) and terminals (with OSC 8 support, like iTerm2), taking you directly to the source code line.
- Rich Interactive Output: Optional integration with the
richlibrary to render call stacks as beautiful, dynamic trees. - Structured JSON Output: Log trace events as JSON objects for easy parsing, filtering, and analysis by automated systems.
-
Conditional Tracing: Define custom rules to activate tracing only for specific calls, preventing log spam and focusing on what matters.
-
Argument & Return Value Control: Mask sensitive data (like passwords), truncate long values, and even hide arguments (like
self) from the output. Consider use it with the filter-url module -
Builtin Performance Profiling: Measure execution time with multiple system clocks. Differentiate between inclusive time (total) and exclusive time (function's own work, excluding children).
-
Runtime Control: Programmatically enable or disable any tracer instance on the fly.
Installation
You can install the package from PyPI using pip.
pip install pytracecall
To enable the optional rich integration for beautiful tree-like logging, install the rich extra:
pip install "pytracecall[rich]"
Usage Examples
Basic Synchronous Tracing
First, ensure you configure Python's logging module to see the output.
import logging
from calltracer import CallTracer

# Configure logging to display DEBUG level messages
logging.basicConfig(
    level=logging.DEBUG,
    format='%(asctime)s - %(message)s',
    datefmt='%H:%M:%S'
)

trace = CallTracer()

@trace
def add(x, y):
    return x + y

add(10, 5)
Output:
21:15:10 - --> Calling add(x=10, y=5)
21:15:10 - <-- Exiting add(x=10, y=5), returned: 15
Advanced Features Showcase
The true power of pytracecall lies in its rich configuration.
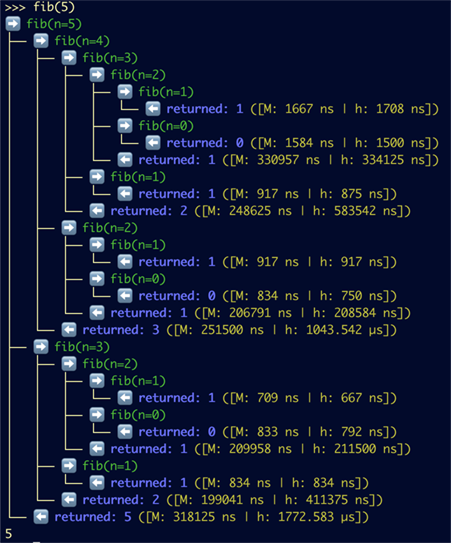
Rich Interactive Trees
For the most intuitive visualization, use the RichPyTraceHandler.
Code (rex.py):
import logging
from calltracer import CallTracer, DFMT, RichPyTraceHandler

# 1. Configure a logger to use the Rich handler exclusively
log = logging.getLogger("rich_demo")
log.setLevel(logging.DEBUG)
log.handlers = [RichPyTraceHandler(overwrite=False)] # `overwrite=False` for append-only tree
log.propagate = False

# 2. Configure the tracer to output JSON for the handler to consume
trace = CallTracer(logger=log, output="json", timing="Mh")

@trace
def fib(n):
    if n <= 1:
        return n
    return fib(n-1) + fib(n-2)

fib(5)
Output:
Call Chain Tracing (trace_chain)
Set trace_chain=True to see the full context for every call.
trace_with_chain = CallTracer(trace_chain=True)
Output:

Performance Profiling (timing)
Measure performance using different clocks. Use lowercase for inclusive time and uppercase for exclusive time. Inclusive means that the total execution time will be printed, while exclusive indicates that the execution time of the nested functions/methods decorated by the same object will be substraced first (i.e. the execution time of this only level will be printed). See an example on the screentshot above (in the Call Chain Tracing Section ).
If you need this feature, set one or more timers in the timing parameter. The following timers are available:
- "m" for
time.monotonic_ns - "h" for
time.perf_counter_ns(high resolution) - "c" for
time.process_time_ns(pure CPU time for all threads) - "t" for
time.thread_time_ns(CPU time per this thread)
Example:
# M: Exclusive monotonic time, h: Inclusive perf_counter time
profile_trace = CallTracer(timing="Mh", timing_fmt=DFMT.SINGLE)
IDE & Terminal Integration
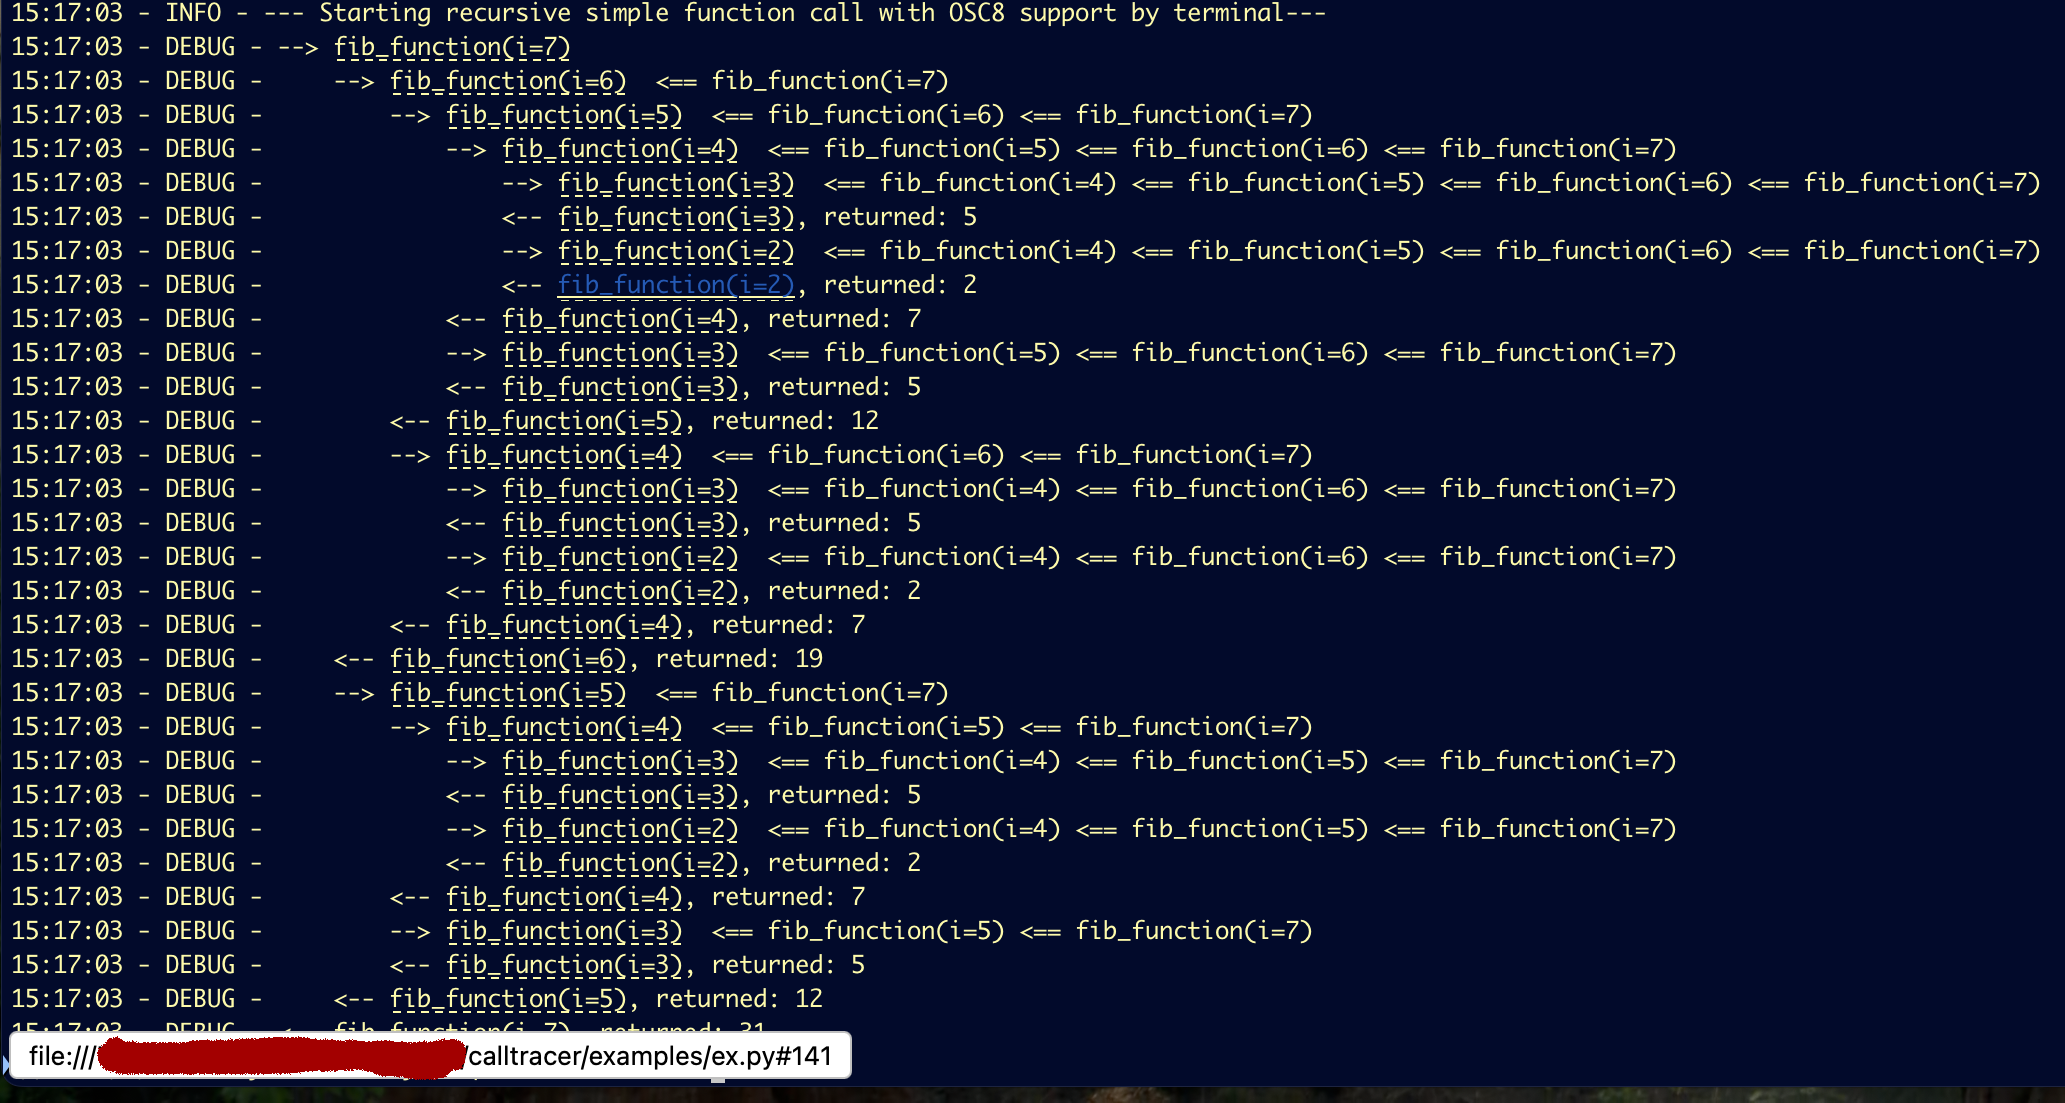
Make your logs clickable! ide_support creates links for IDEs, while term_support uses OSC 8 for modern terminals.
# For clickable links in PyCharm/VSCode
ide_trace = CallTracer(ide_support=True)

# For Ctrl/Cmd-Click in iTerm2 and other modern terminals
term_trace = CallTracer(term_support=True)
Output in iTerm2 (with term_support=True): The function signature becomes a clickable link (check the bottom left corner) that opens the file at the correct line in your editor:
Asynchronous Tracing
aCallTracer handles async functions and concurrency flawlessly, keeping call chains isolated.
Output:

Full API Reference
The CallTracer and aCallTracer classes share the same rich set of initialization parameters, inherited from a base class.
CallTracer / aCallTracer Parameters
__init__(self,
         level=logging.DEBUG,
         trace_chain=False,
         logger=None,
         transform=None,
         max_argval_len=None,
         return_transform: Optional[Callable] = None,
         max_return_len: Optional[int] = None,
         condition: Optional[Callable] = None,
         timing: str = None,
         timing_fmt: DFMT = DFMT.SINGLE,
         output: str = 'text',
         ide_support: bool = False,
         term_support: bool = False,
         rel_path: bool = True)
All arguments have default value, i.e. are optional.
-
level(int): The logging level for trace messages (check the docs for theloggingmodule) -
logger(logging.Logger): A custom logger instance to use -
trace_chain(bool): IfTrue, logs the full call chain for each event, showing the sequence of all decorated call preceeding this one -
transform(dict): A dictionary of callbacks to transform/hide argument values. Keys are(func_qualname, arg_name)tuples. A wildcard('*', arg_name)can be used. Values are callback functions to be called (take an agrument value as an input). If a callback returnsNone, only the argument name is printed. -
max_argval_len(int): Maximum length for the string representation of argument values. -
return_transform(Callable): A function to transform the return value before logging. Takes a return value as an argument. -
max_return_len(int): Maximum length for the string representation of the return value. -
condition(Callable): A function(func_name, *args, **kwargs) -> boolthat determines if tracing should be active for a call. If it returnsFalse, this call and ALL NESTED decorated calls are skipped. Useful -
timing(str): Enables [poor mens'] profiling. A string of characters specifying clocks to use (monotonic,high-perf,cpu,thread). Lowercase measures inclusive (total) time. Uppercase measures exclusive time (total time minus decorated child calls). -
timing_fmt(DFMT): The display format for timing values (DFMT.NANO,DFMT.MICRO,DFMT.SEC,DFMT.SINGLE,DFMT.HUMAN):DFMT.NANO: Plain nanoseconds (e.g., "123 ns")DFMT.MICRO: Plain microseconds (e.g., "0.123 µs")DFMT.SEC: Plain seconds (e.g., "0.000000123 s")DFMT.SINGLE: A "smart" format that uses the single most appropriate unit (ns, µs, s, min, or hr) depending on the magnitudeDFMT.HUMAN: A compound, human-readable format for larger durations (e.g., "5 min, 23.4 s"). For small values (<100ms), it behaves likeSINGLE
-
output(str): The output format.'text'(default) for human-readable logs or'json'for structured logging -
ide_support(bool): IfTrue, formats text logs to be clickable in IDEs (e.g., PyCharm, VSCode) -
term_support(bool): IfTrue, formats text logs with OSC 8 hyperlinks for modern terminals. Ifide_supportis set,term_supportwill be ignored. -
rel_path(bool): IfTrue, uses relative paths foride_supportandterm_support, othervise uses an absolute one (which might be important forterm_supporton some terminals)
Methods:
enable()/disable(): Each tracer instance has these methods to control tracing at runtime.
RichPyTraceHandler Parameters
The handler for beautiful rich tree output.
__init__(self,
         overwrite: bool = False,
         color_enter: str = "green",
         color_exit: str = "bold blue",
         color_exception: str = "bold red",
         color_timing: str = "yellow")
All arguments have default value, i.e. are optional.
overwrite(bool): IfFalse(default), creates an append-only tree showing both enter and exit events. IfTrue, uses aLiveanimated display to overwrite enter nodes with exit information (might be usefult if functions execute a long time, almost senseless for the fast functions)color_*(str): Rich markup strings to customize the output colors.
stack() Function
stack(level=logging.DEBUG, logger=None, limit=None, start=0)
Logs the current call stack. All arguments have default value, i.e. are optional.
level(int): The logging level for the stack trace messagelogger(logging.Logger): The logger to uselimit(int): Maximum number of frames to show,None(defaults) means no limit.start(int): Frame offset to start from
Release history Release notifications | RSS feed


Download files
Download the file for your platform. If you're not sure which to choose, learn more about installing packages.
Source Distribution
Built Distribution
Filter files by name, interpreter, ABI, and platform.
If you're not sure about the file name format, learn more about wheel file names.
Copy a direct link to the current filters
File details
Details for the file pytracecall-4.2.2.tar.gz.
File metadata
- Download URL: pytracecall-4.2.2.tar.gz
- Upload date:
- Size: 26.8 kB
- Tags: Source
- Uploaded using Trusted Publishing? No
- Uploaded via: twine/6.1.0 CPython/3.12.10
File hashes
| Algorithm | Hash digest | |
|---|---|---|
| SHA256 |
dc23f977cf200a6e5f849475beea6df3670e02410174a7f0dbcf09f001f5f1e8
|
|
| MD5 |
f7213970af8a83996036935a2c191e3b
|
|
| BLAKE2b-256 |
592c670c194f3400040a869fb47452af21f4aba39bd389e711dbd420c9f68d22
|
File details
Details for the file pytracecall-4.2.2-py3-none-any.whl.
File metadata
- Download URL: pytracecall-4.2.2-py3-none-any.whl
- Upload date:
- Size: 25.7 kB
- Tags: Python 3
- Uploaded using Trusted Publishing? No
- Uploaded via: twine/6.1.0 CPython/3.12.10
File hashes
| Algorithm | Hash digest | |
|---|---|---|
| SHA256 |
f0d683eab7ddb40d79d6bafc936c0dc92a0854cfaf75ce5ff5e04c175a1d8d3e
|
|
| MD5 |
d1046f54335ba27cc00bbab93c57227b
|
|
| BLAKE2b-256 |
6c279e1cb058e6f9e7ef115ffee6391d7884a1cc85b848aafff5f7536b5930ac
|






