
Post-mortem Python trace profiler that emits JSON plus an HTML viewer and OTLP exporter.

Project description
PyTraceFlow.





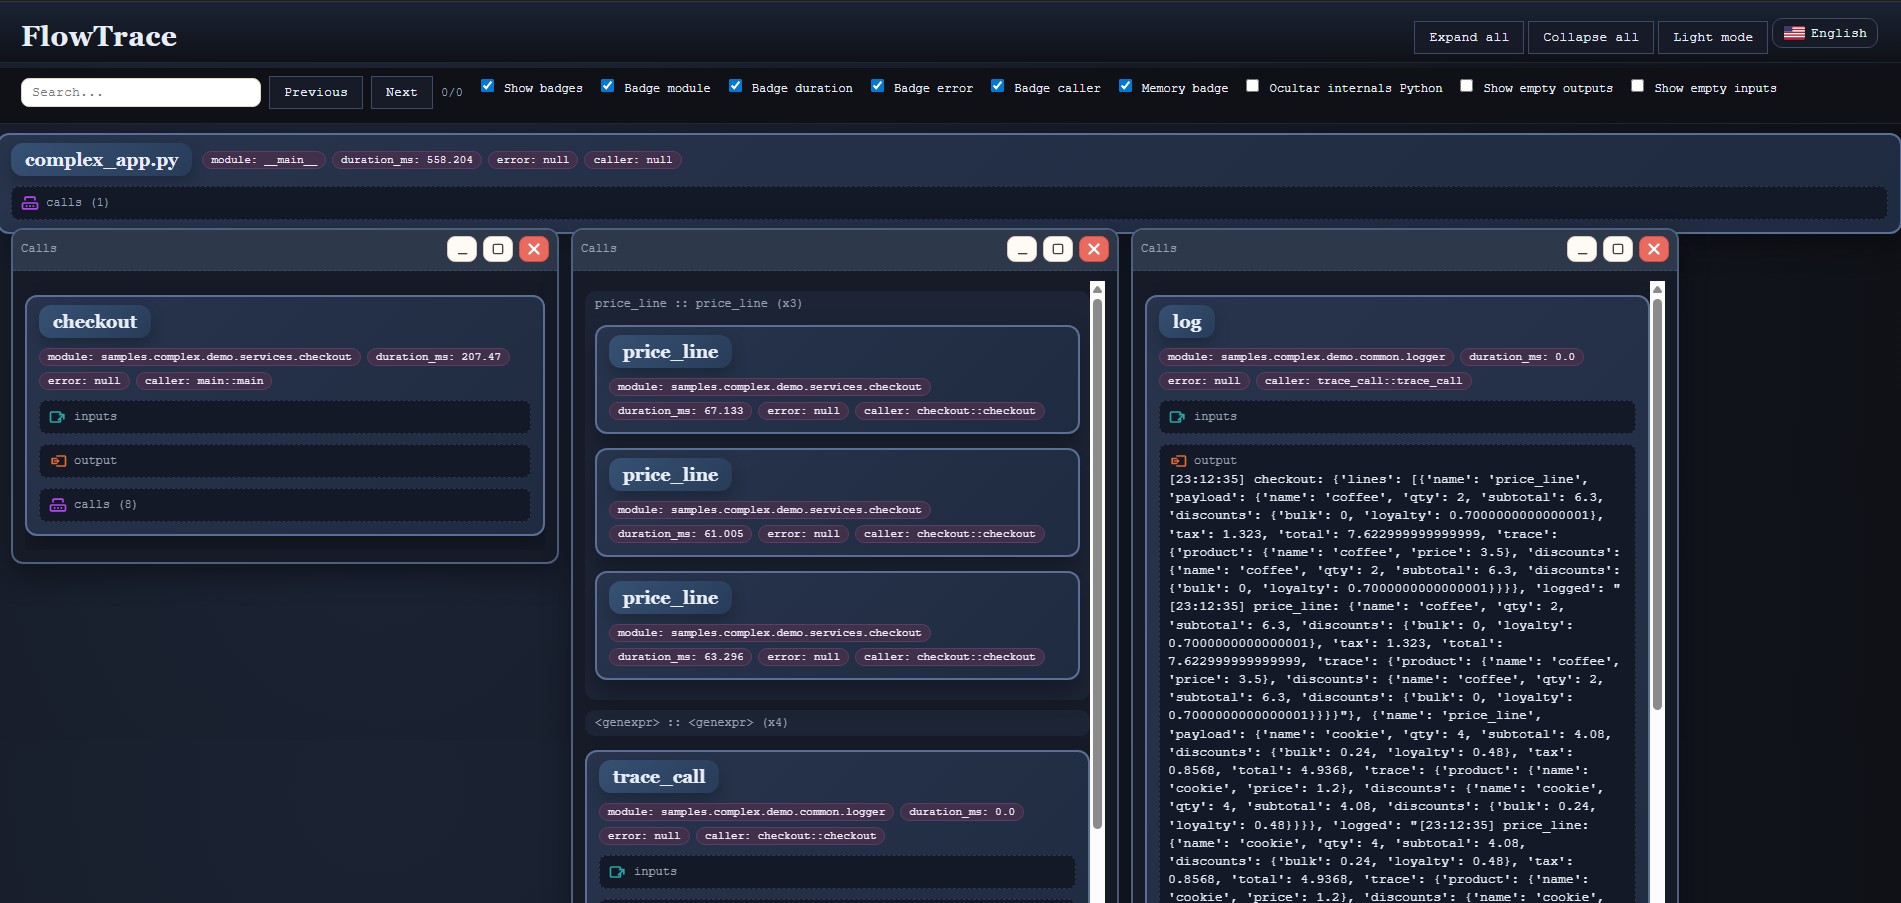
FlowTrace is a trace visualizer designed as a "post-mortem debugger": instead of pausing and resuming, it captures calls (inputs, outputs, caller, module, duration, errors) into a hierarchical JSON so you can inspect them later without re-running.
Quick start (3 steps)
- Capture the complex sample to JSON:
python pytraceflow.py -s samples/complex/complex_app.py -o pft_complex.json - Render the HTML viewer:
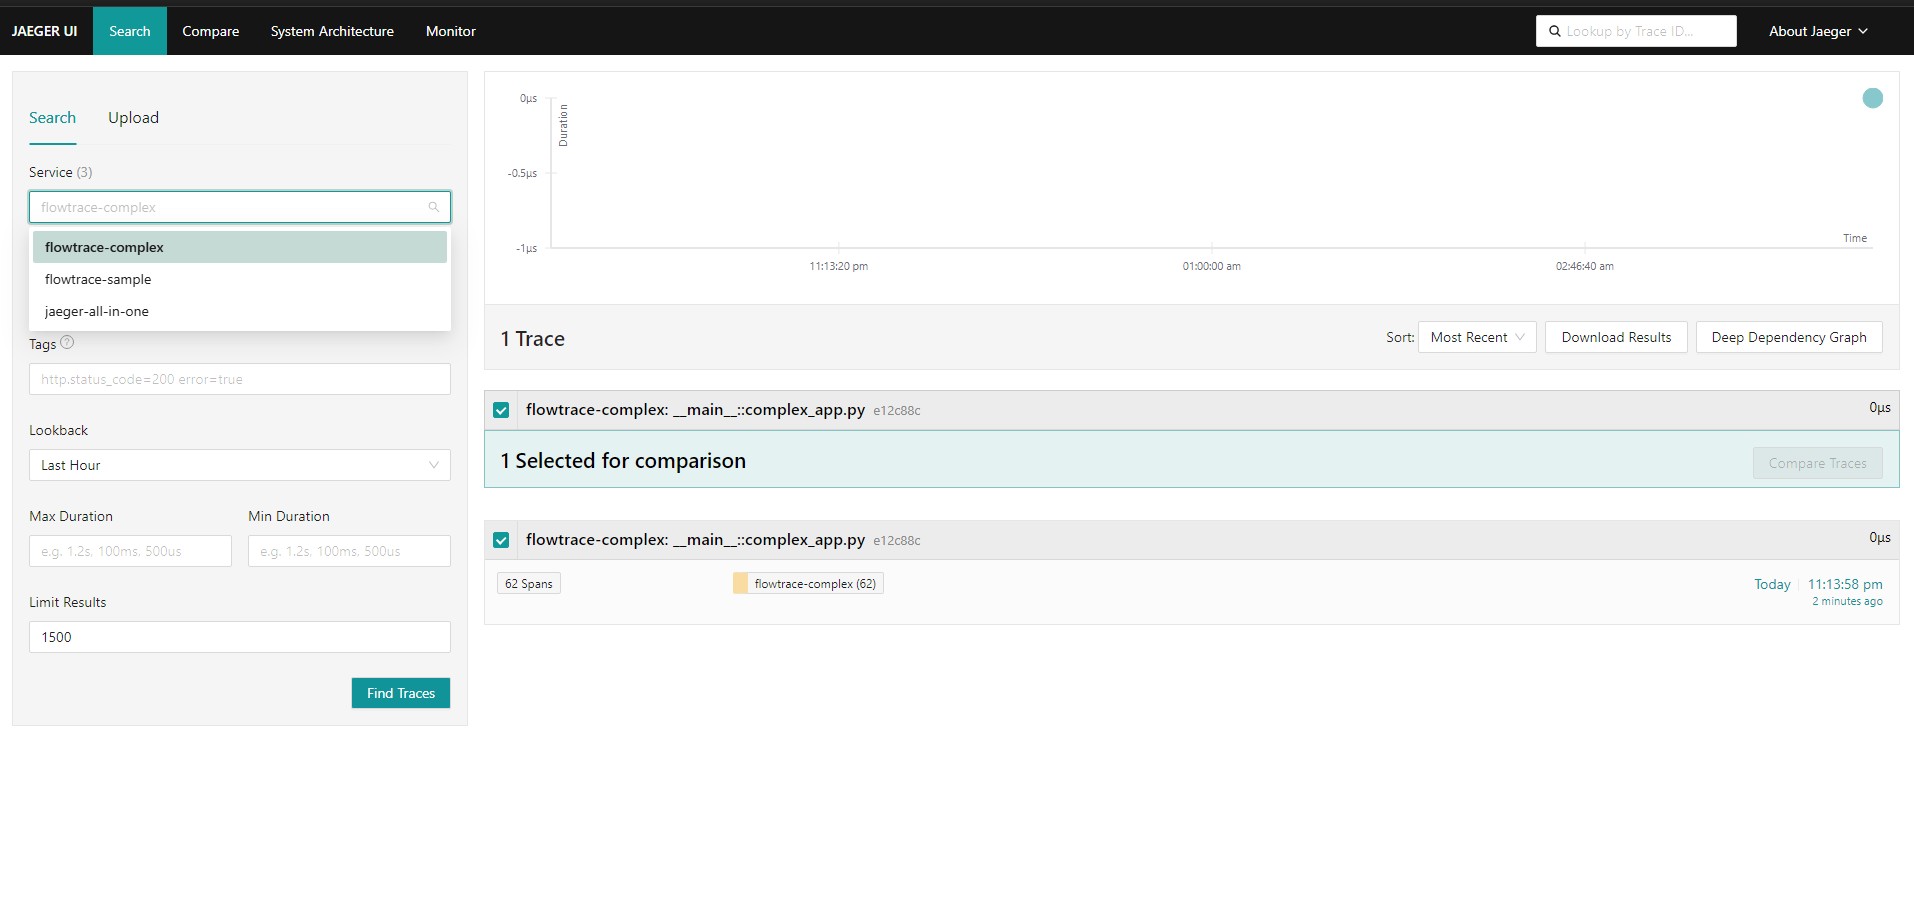
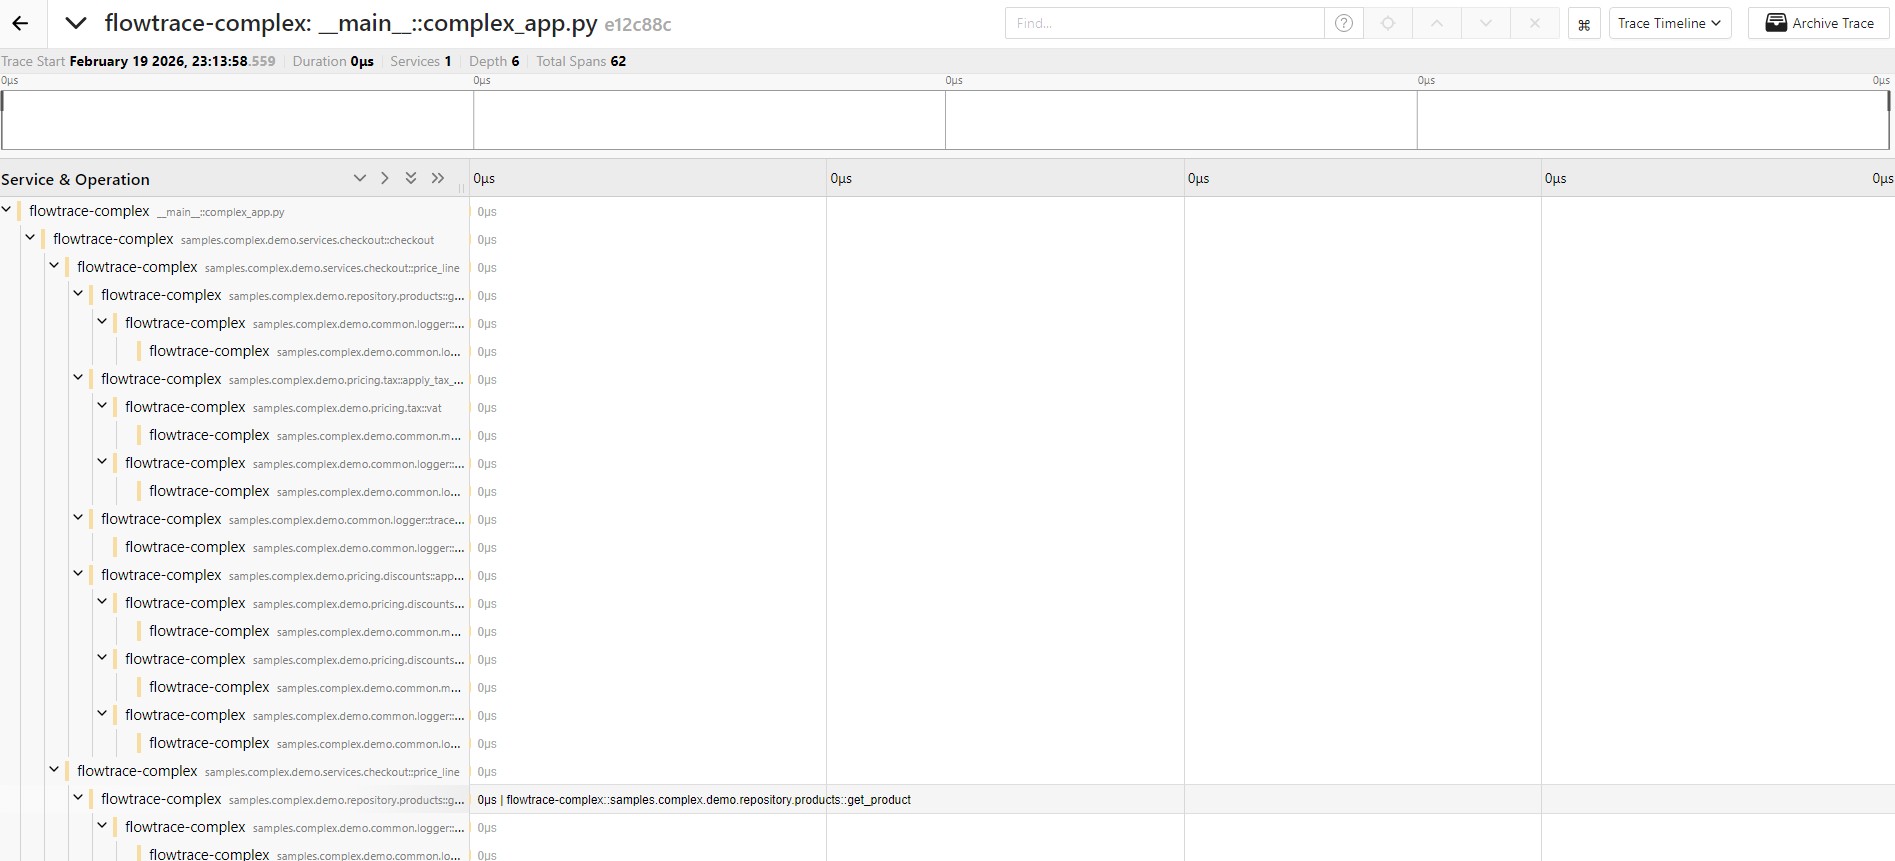
python pytraceflow_visual.py -i pft_complex.json -o pft_complex.html - Optional export to OTLP/Jaeger (HTTP 4318):
python export_otlp.py -i pft_complex.json --endpoint http://localhost:4318/v1/traces --service pytraceflow-complex
Basic flow
- Profile a script:
python pytraceflow.py -s your_script.py -o pft.json - Generate the viewer:
python pytraceflow_visual.py -i pft.json -o pft.html - Open
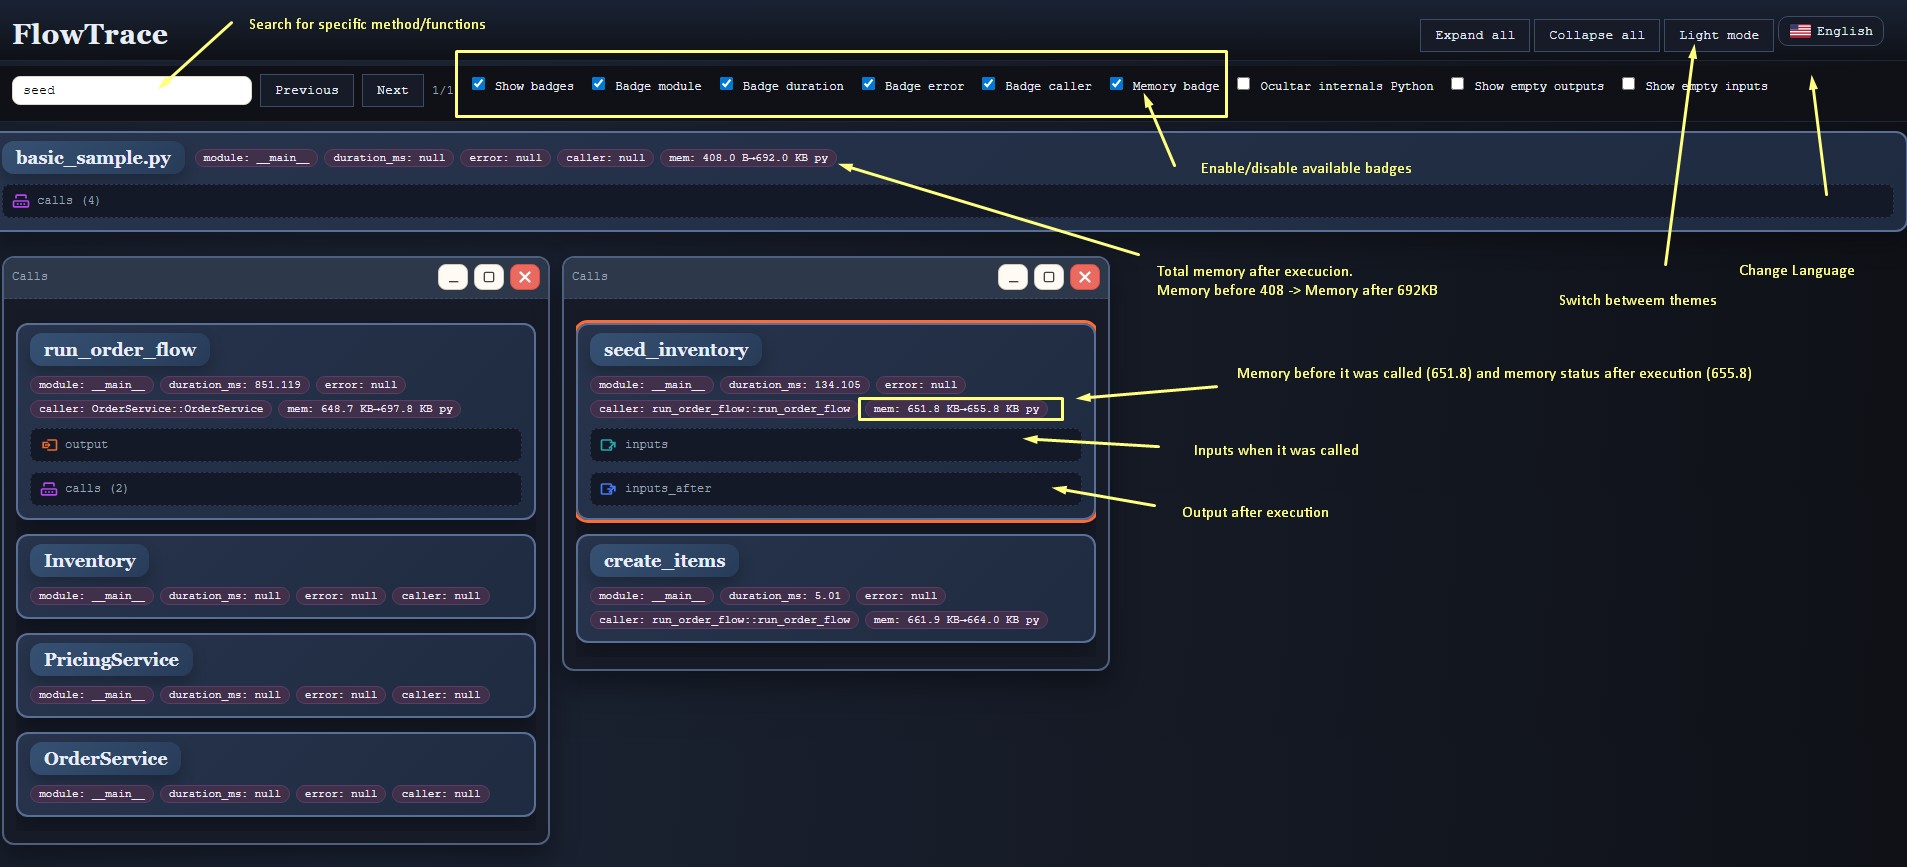
pft.htmland browse:- Search terms: opens the matching node in a floating panel.
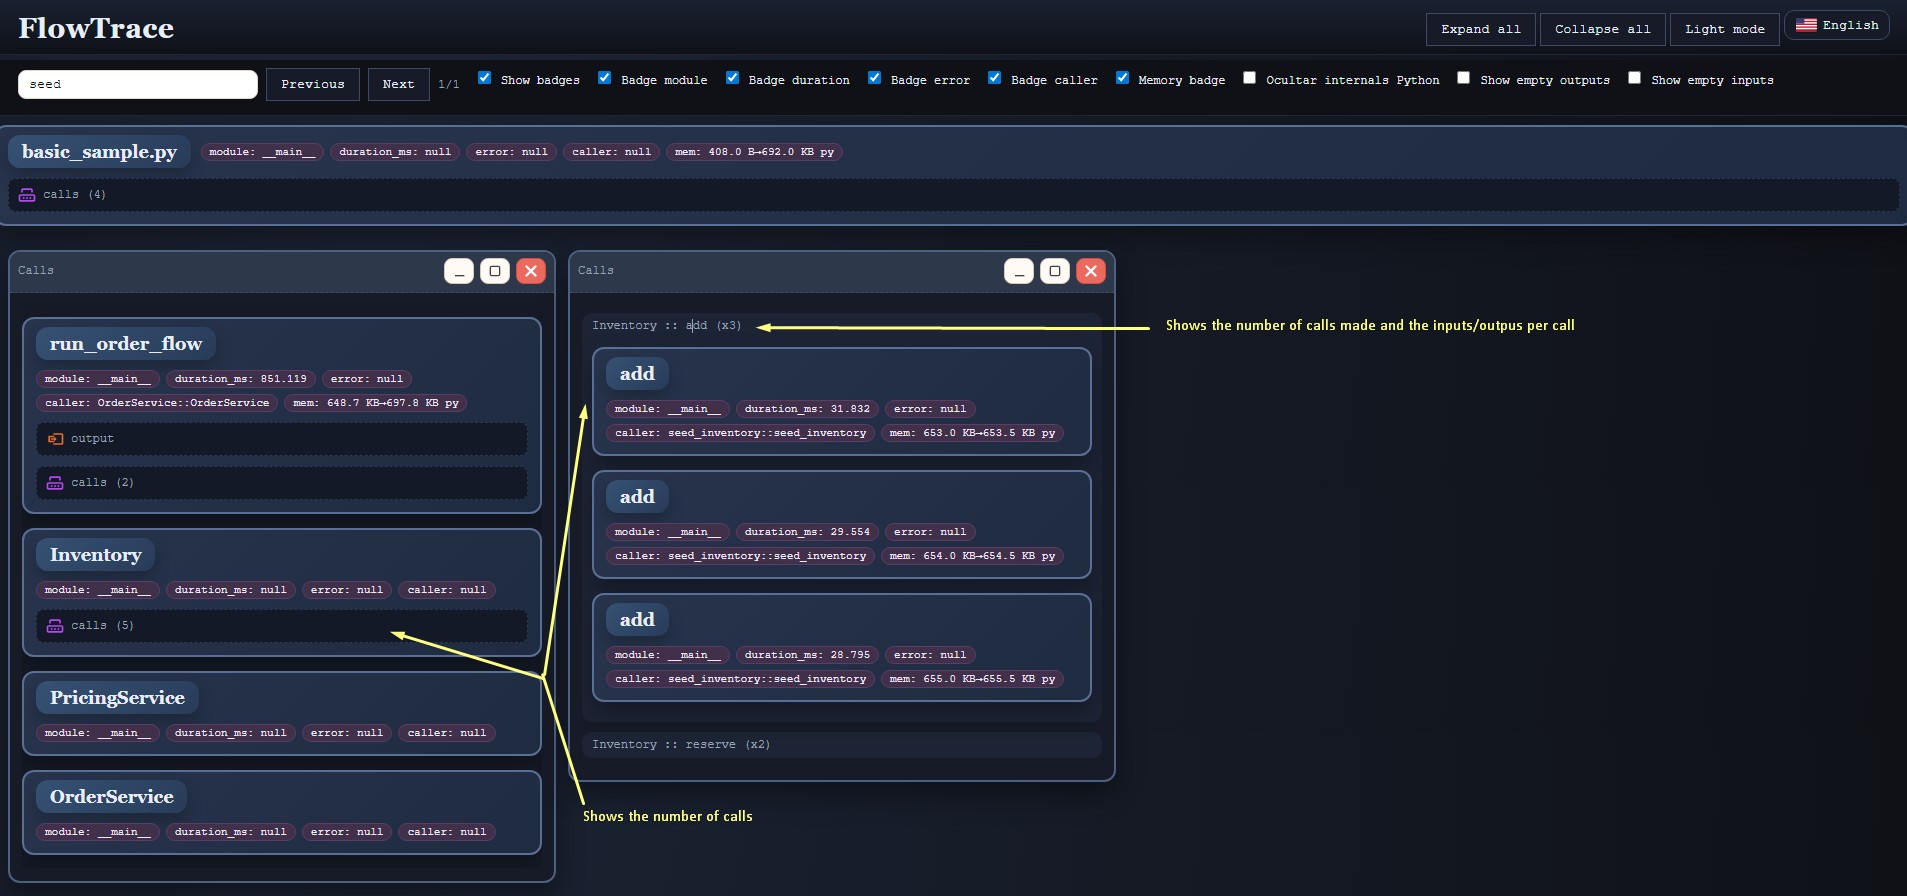
- Expand/collapse nodes; open calls.
- Controls to show/hide badges, Python internals, language (es/en), and light/dark mode.
Passing script arguments
- Any arguments unknown to
pytraceflow.pyare forwarded to the profiled script (no--separator required). - Example with options:
python pytraceflow.py -s samples/basic/basic_sample.py --customer "ana maria" --tier gold --coffee 3 - Example with positionals:
python pytraceflow.py -s samples/basic/basic_positional_sample.py "juan perez" silver 1 2 0 0.18
Features
- Captures inputs/outputs, caller, module, duration, and errors.
- Groups instances and nested calls while preserving hierarchy.
- Search with highlighting and floating panels; option to hide Python internals.
- Dark mode by default, quick controls, and multi-language.
- Performance knobs:
--flush-interval(seconds, <=0 disables background flush),--flush-every-call(legacy, slower),--log-flushes(stderr). - Overhead controls: memoria desactivada por defecto; habilita con
--with-memory(usa psutil + tracemalloc), o combina--no-tracemalloc/--no-memory.--skip-inputsevita serializar args/kwargs. - Root entry now records total runtime; STDERR line:
[FlowTrace] Profiling finished in X.XXXs (script=...). - Export existing traces to OTLP/Jaeger via
export_otlp.py, with span names enriched by module and instance id to make nested calls distinct in Jaeger UI.
CLI options
-s/--script(required): target script path.-o/--output: JSON output path (defaultpft.json).--flush-interval: seconds between background flushes;<=0disables thread (default1.0).--flush-every-call: force flush on every event (slow; legacy).--log-flushes: log each flush to stderr.--with-memory: enable memory snapshots (psutil + tracemalloc). Default is off; expect slower runs when enabled.--no-memory: disable memory snapshots.--no-tracemalloc: keep psutil but skip tracemalloc.--skip-inputs: do not serialize call inputs/outputs.- OTLP export (optional, requires
opentelemetry-*):--export-otlp-endpoint http://localhost:4318/v1/traces,--export-otlp-service myapp, repeat--export-otlp-header key=valuefor extra headers. - Any other args are forwarded to the profiled script.
Usage examples
- Default fast run:
python pytraceflow.py -s samples/basic/basic_sample.py -o pft.json - With memory metrics:
python pytraceflow.py -s samples/basic/basic_sample.py --with-memory --flush-interval 2.0 - Minimal overhead:
python pytraceflow.py -s samples/basic/basic_sample.py --flush-interval 0 --skip-inputs - Legacy per-call flush with logs:
python pytraceflow.py -s samples/basic/basic_sample.py --flush-every-call --log-flushes - Memory via psutil only:
python pytraceflow.py -s samples/basic/basic_sample.py --with-memory --no-tracemalloc - Export to OTLP/HTTP:
python pytraceflow.py -s samples/basic/basic_sample.py --export-otlp-endpoint http://localhost:4318/v1/traces --export-otlp-service pytraceflow-sample - Export a saved trace to Jaeger (OTLP/HTTP, port 4318):
python export_otlp.py -i pft.json --endpoint http://localhost:4318/v1/traces --service pytraceflow-sample - Export with custom headers (auth/tenant):
python export_otlp.py -i pft.json --endpoint http://localhost:4318/v1/traces --service pytraceflow-sample --header Authorization=Bearer_TOKEN --header X-Tenant=acme
Included examples
script.pybasic example.complex_app.pywith modulesdemo/...(prices, taxes, discounts).conc_demo.pywith CPU-bound (multiprocessing) and IO-bound (threads) to view concurrent traces.basic_positional_sample.pyshows the same flow using positional arguments.error_sample.pyintentionally fails (missing config) to show the error badge.
Backlog / ideas
- Filters by module/class/time.
- Export filtered views.
License
MIT License. See LICENSE for full text.
FlowTrace es un visualizador de trazas de ejecucion, pensado como un "debugger post-mortem": en lugar de parar y reanudar, captura las llamadas (inputs, outputs, caller, modulo, duracion, errores) en un JSON jerarquico para inspeccionarlo despues sin reejecutar.
Inicio rápido (3 pasos)
- Capturar el ejemplo complejo a JSON:
python pytraceflow.py -s samples/complex/complex_app.py -o pft_complex.json - Generar el visor HTML:
python pytraceflow_visual.py -i pft_complex.json -o pft_complex.html - Exportar a OTLP/Jaeger (HTTP 4318):
python export_otlp.py -i pft_complex.json --endpoint http://localhost:4318/v1/traces --service pytraceflow-complex
Flujo basico
- Perfilar un script:
python pytraceflow.py -s tu_script.py -o pft.json - Generar visor:
python pytraceflow_visual.py -i pft.json -o pft.html - Abrir
pft.htmly navegar:- Buscar trminos: abre el nodo coincidente en panel flotante.
- Expandir/colapsar nodos; abrir calls.
- Controles para mostrar/ocultar badges, internals de Python, idioma (es/en) y modo claro/oscuro.
Pasar argumentos al script
- Cualquier argumento que
pytraceflow.pyno reconoce se reenvia al script perfilado (no hace falta--). - Ejemplo con opciones:
python pytraceflow.py -s samples/basic/basic_sample.py --customer "ana maria" --tier gold --coffee 3 - Ejemplo con posicionales:
python pytraceflow.py -s samples/basic/basic_positional_sample.py "juan perez" silver 1 2 0 0.18
Caracteristicas
- Captura inputs/outputs, caller, modulo, duracion y errores.
- Agrupa instancias y llamadas anidadas preservando jerarquia.
- Buscador con resaltado y paneles flotantes; opcion para ocultar internals de Python.
- Modo oscuro por defecto, controles rapidos y multilenguaje.
- Ajustes de performance:
--flush-interval(segundos, <=0 desactiva flush en background),--flush-every-call(modo anterior, mas lento),--log-flushes(stderr). - Controles de overhead: memoria viene desactivada por defecto;
--with-memoryla habilita (psutil + tracemalloc), combinable con--no-tracemalloc/--no-memory.--skip-inputsevita serializar args/kwargs. - La llamada raiz registra el tiempo total; se imprime en STDERR
[FlowTrace] Profiling finished in X.XXXs (script=...). - Export de trazas existentes a OTLP/Jaeger con
export_otlp.py; los spans incluyen módulo e id de instancia para distinguir llamadas anidadas en Jaeger.
Opciones CLI
-s/--script(obligatorio): ruta del script a perfilar.-o/--output: ruta del JSON de salida (por defectopft.json).--flush-interval: segundos entre flushes en background;<=0desactiva el hilo (por defecto1.0).--flush-every-call: fuerza flush en cada evento (lento; legado).--log-flushes: loguea cada flush a stderr.--with-memory: habilita snapshots de memoria (psutil + tracemalloc). Por defecto está apagado; al activarlo las ejecuciones serán más lentas.--no-memory: desactiva snapshots de memoria.--no-tracemalloc: deja psutil pero omite tracemalloc.--skip-inputs: no serializa inputs/outputs de las llamadas.- Export OTLP (opcional, requiere
opentelemetry-*):--export-otlp-endpoint http://localhost:4318/v1/traces,--export-otlp-service miapp, headers extra con--export-otlp-header clave=valor(repetible). - Cualquier otro argumento se reenvía al script perfilado.
Ejemplos de uso
- Ejecución rápida por defecto:
python pytraceflow.py -s samples/basic/basic_sample.py -o pft.json - Con métricas de memoria:
python pytraceflow.py -s samples/basic/basic_sample.py --with-memory --flush-interval 2.0 - Overhead mínimo:
python pytraceflow.py -s samples/basic/basic_sample.py --flush-interval 0 --skip-inputs - Flush por llamada con logs:
python pytraceflow.py -s samples/basic/basic_sample.py --flush-every-call --log-flushes - Solo psutil (sin tracemalloc):
python pytraceflow.py -s samples/basic/basic_sample.py --with-memory --no-tracemalloc - Export a OTLP/HTTP:
python pytraceflow.py -s samples/basic/basic_sample.py --export-otlp-endpoint http://localhost:4318/v1/traces --export-otlp-service pytraceflow-sample - Exportar un JSON ya capturado a Jaeger (OTLP/HTTP, puerto 4318):
python export_otlp.py -i pft.json --endpoint http://localhost:4318/v1/traces --service pytraceflow-sample - Exportar con cabeceras extra (auth/tenant):
python export_otlp.py -i pft.json --endpoint http://localhost:4318/v1/traces --service pytraceflow-sample --header Authorization=Bearer_TOKEN --header X-Tenant=acme
Ejemplos incluidos
script.pyejemplo basico.complex_app.pycon modulosdemo/...(precios, impuestos, descuentos).conc_demo.pycon CPU-bound (multiproceso) e IO-bound (hilos) para ver trazas concurrentes.basic_positional_sample.pymuestra el mismo flujo usando argumentos posicionales.error_sample.pyfalla adrede (config faltante) para ver el badge de error.error_internal_sample.pyfalla dentro de una llamada interna (validate_config) para ver errores anidados.
Pendientes / ideas
- Filtros por mdulo/clase/tiempo.
- Export de vistas filtradas.
- Integracin con spans/telemetra.
Licencia
MIT License. Ver LICENSE para el texto completo.
Release history Release notifications | RSS feed


Download files
Download the file for your platform. If you're not sure which to choose, learn more about installing packages.
Source Distribution
Built Distribution
Filter files by name, interpreter, ABI, and platform.
If you're not sure about the file name format, learn more about wheel file names.
Copy a direct link to the current filters
File details
Details for the file pytraceflow-0.1.5.tar.gz.
File metadata
- Download URL: pytraceflow-0.1.5.tar.gz
- Upload date:
- Size: 31.6 kB
- Tags: Source
- Uploaded using Trusted Publishing? No
- Uploaded via: twine/6.2.0 CPython/3.12.4
File hashes
| Algorithm | Hash digest | |
|---|---|---|
| SHA256 |
9064faedf340e5890c48c0beae825a7918da486ffc59554090941c6d31137afe
|
|
| MD5 |
daefd2e9c903c128a78c54d89322d354
|
|
| BLAKE2b-256 |
592223e9f1382fc865b90e7b8ea0f3affbd745d73103918db0174a604440ce67
|
File details
Details for the file pytraceflow-0.1.5-py3-none-any.whl.
File metadata
- Download URL: pytraceflow-0.1.5-py3-none-any.whl
- Upload date:
- Size: 25.2 kB
- Tags: Python 3
- Uploaded using Trusted Publishing? No
- Uploaded via: twine/6.2.0 CPython/3.12.4
File hashes
| Algorithm | Hash digest | |
|---|---|---|
| SHA256 |
a31f98556e223e6cc0f7b97afb878be77265ea006abf096e3a5c3c04a7fce4a9
|
|
| MD5 |
637d32e4b28c5213923f0b3b8cec1511
|
|
| BLAKE2b-256 |
afaa39e60ad21b3319ad99b0e404e79c69e2f8610c765a3240de73ee0a9ab4f9
|






