Interactive Network Visualizations

Project description


Interactive Network Visualizations
This tool leverages the amazing vis-network library (https://visjs.github.io/vis-network/docs/network/) to provide interactive visualizations.
Installation
pip install pyvis-networkSample Usage
>>> from pyvis_network import network, dataset
>>> nodes_df, edges_df = dataset().load_as_df("Example1")
>>> graph1 = network(title="Example1").add_df(nodes_df=nodes_df,edges_df=edges_df)
>>> graph1.show("example1.html")
>>> graph2 = graph1.clone_graph()
>>> graph2.show("example1_cloned.html")
>>> from pyvis_network import network, dataset
>>> nodes_df, edges_df = dataset().load_as_df("Machine_Learning")
>>> network(title="Machine Learning").add_df(nodes_df=nodes_df,edges_df=edges_df).show("ml.html")
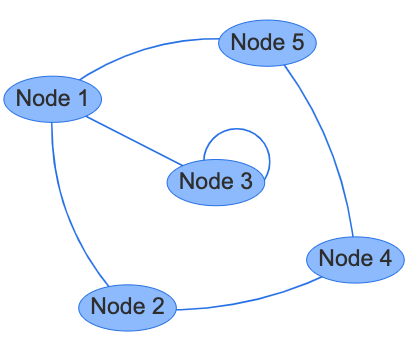
Sample Screenshot
Example1
Release history Release notifications | RSS feed


Download files
Download the file for your platform. If you're not sure which to choose, learn more about installing packages.
Source Distribution
pyvis-network-0.0.6.tar.gz
(48.4 kB
view details)
Built Distribution
Filter files by name, interpreter, ABI, and platform.
If you're not sure about the file name format, learn more about wheel file names.
Copy a direct link to the current filters
File details
Details for the file pyvis-network-0.0.6.tar.gz.
File metadata
- Download URL: pyvis-network-0.0.6.tar.gz
- Upload date:
- Size: 48.4 kB
- Tags: Source
- Uploaded using Trusted Publishing? No
- Uploaded via: twine/3.2.0 pkginfo/1.5.0.1 requests/2.26.0 setuptools/59.4.0 requests-toolbelt/0.9.1 tqdm/4.49.0 CPython/3.8.3
File hashes
| Algorithm | Hash digest | |
|---|---|---|
| SHA256 |
c5dc11cd5e8de2f02b181741b8599ef2388c1d8f6eb65d721163c68d51803781
|
|
| MD5 |
efc0da01f58470ed708dcf753340f3c3
|
|
| BLAKE2b-256 |
80d0a891da8eb87276756c6ff0fa9c9506ad61948bc71e547146750b45324f4e
|
File details
Details for the file pyvis_network-0.0.6-py3-none-any.whl.
File metadata
- Download URL: pyvis_network-0.0.6-py3-none-any.whl
- Upload date:
- Size: 49.6 kB
- Tags: Python 3
- Uploaded using Trusted Publishing? No
- Uploaded via: twine/3.2.0 pkginfo/1.5.0.1 requests/2.26.0 setuptools/59.4.0 requests-toolbelt/0.9.1 tqdm/4.49.0 CPython/3.8.3
File hashes
| Algorithm | Hash digest | |
|---|---|---|
| SHA256 |
8d110456e1af4f634bf7a3e306077104e9b6d511aa37bab03c9eb152e3bbccf3
|
|
| MD5 |
f2a28af22ba0b9d8263ccab99d2cb177
|
|
| BLAKE2b-256 |
3eb79ed53162e01d69ba5b3465f896c10e41e98ff71b2ee016b28a5e654e120e
|


