
Draws Manhattan plot and QQ plot using plink assoc output

Project description
qqman for Python


About This Fork
This is a modernized fork of satchellhong/qqman with the following enhancements:
- Added Parameters: Additional
point_sizeparameter for Manhattan plots to control marker size - Modernized Dependencies: Updated to support Python 3.9+ and newer python package versions
- Modern Packaging: Added
pyproject.tomland updated dependency specifications
Original Project
The original qqman library was created by satchellhong and is inspired by the R package r-qqman.
License
This fork maintains the original MIT License. See the LICENSE file for details.
Original Copyright: Copyright (c) 2020 satchellhong Fork Enhancements: Additional parameters and modernization updates
Contents
- Introduction
1.1. Installation
1.2. Requirements
1.3. Features - Manhattan Plot
2.1. Parameters
2.2. Examples - QQ Plot
3.1. Parameters
3.2. Examples
1. Introduction
1.1. Installation
Using pip
$ pip install qqman
1.2. Requirements
- Python 3.10+
- matplotlib >= 3.7.0
- pandas >= 1.5.3
- numpy >= 1.23.5
Using uv (recommended - 10-100x faster)
$ pip install uv
$ uv pip install qqman
Using pip
$ pip install qqman
All dependencies will be installed automatically.
1.3. Features
2. Manhattan Plot
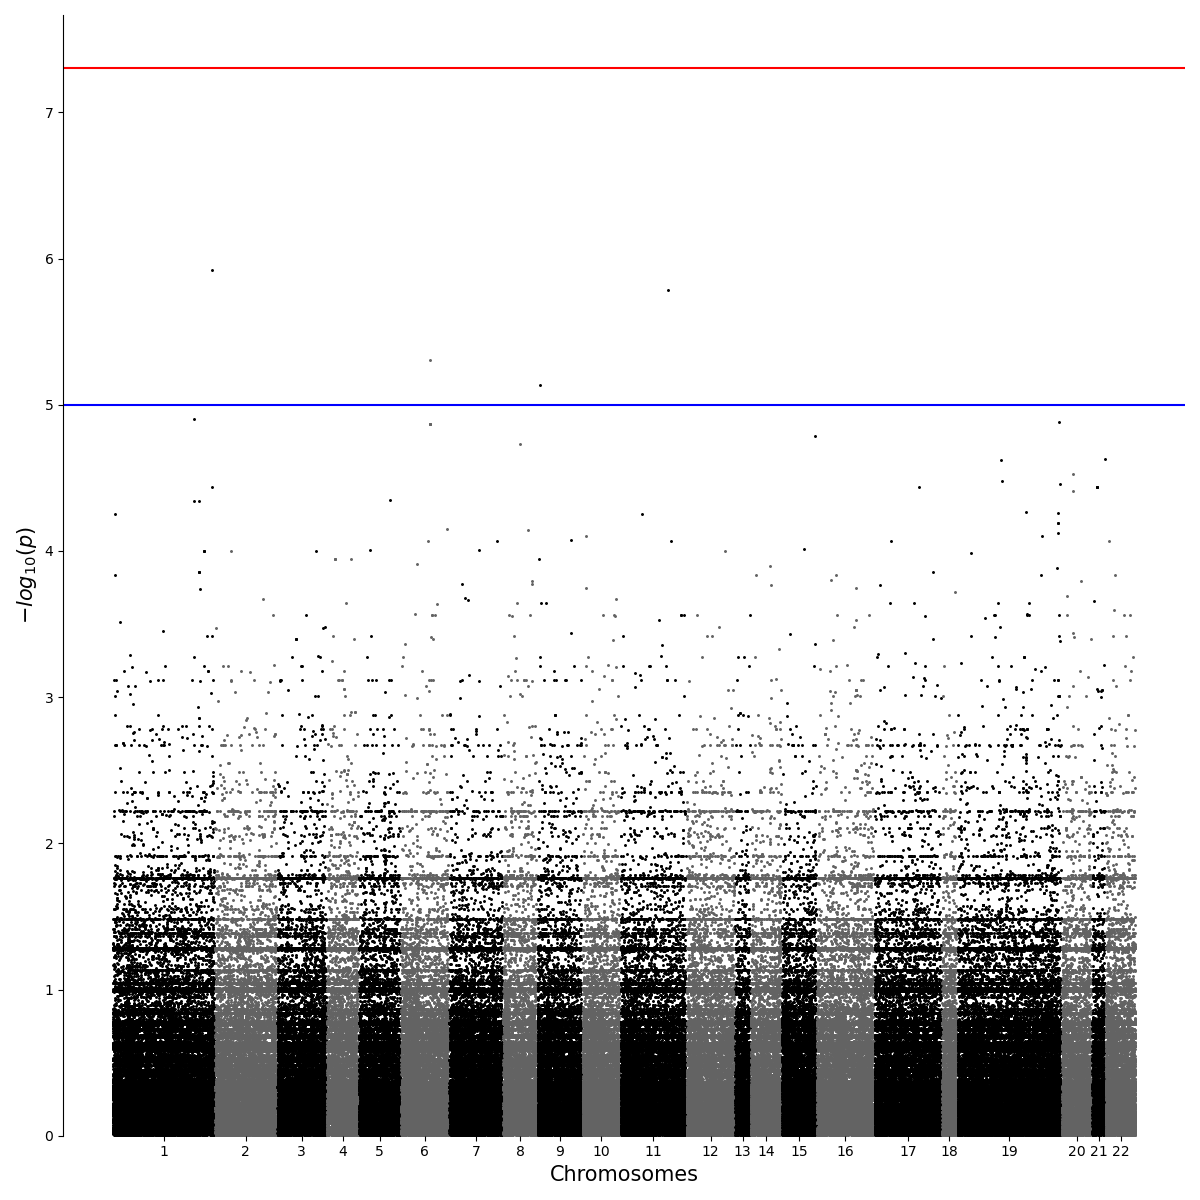
Draws Manhattan plot from PLINK --assoc output or any assoc formatted data that contains [chromosome/basepair/p-value] as columns.
2.1. Parameters
assoc : string or pandas.DataFrame
|
- Input file path and name of the Plink assoc output. - Pandas DataFrame with columns [chromosome/basepair/p-value] |
|---|---|
out : string( optional ) |
Output path and file name of the plot. (ie. out="./Manhattan.png") |
cmap : Colormap( optional : default=Greys_r ) |
A Colormap instance or registered colormap name. matplotlib.cm.get_cmap() |
cmap_var : int or list( optional : default=2 ) |
int : Number of colors to use list : Specific colors to use in colormap |
show : bool( optional ) |
If true, the plot will be shown on your screen. (This option doesn't work in CUI environment.) |
gap : float( optional : default=10) |
A size of gaps between the group of scatter markers of each chromosome in Manhattan plot |
ax : subplot( optional ) |
If given, this subplot is used to plot in instead of a new figure being created. |
title : string( optional ) |
A title of the plot. |
title_size : int( optional ) |
A size of the title of the plot. |
label_size : int( optional ) |
A size of x and y labels of the plot. |
xtick_size : int( optional ) |
A size of xtick labels. |
ytick_size : int( optional ) |
A size of ytick labels. |
xrotation : float( optional ) |
A rotation degree of xtick labels. |
yrotation : float( optional ) |
A rotation degree of ytick labels. |
col_chr : string( optional : default="CHR" ) |
A string denoting the column name for the chromosome. Defaults to PLINK’s "CHR" Said column must be numeric. If you have X, Y, or MT chromosomes, be sure to renumber these 23, 24, 25, etc. |
col_bp : string( optional : default="BP" ) |
A string denoting the column name for the chromosomal position. Defaults to PLINK’s "BP" Said column must be numeric. |
col_p : string( optional : default="P" ) |
A string denoting the column name for the p-value. Defaults to PLINK’s "P" Said column must be numeric. |
col_snp : string( optional : default="SNP" ) |
A string denoting the column name for the SNP name (rs number). Defaults to PLINK's "SNP" Said column should be a character |
point_size : int( optional : default=8 ) |
The size of the scatter plot markers in the Manhattan plot |
suggestiveline : string( optional : default=-log_10(1e-5) ) |
Where to draw a "suggestive" line. Set to False to disable. |
genomewideline : string( optional : default=-log_10(5e-8) ) |
Where to draw a "genome-wide sigificant" line. Set to False to disable. |
2.2. Examples
2.2.1. Simple
from qqman import qqman

if __name__ == "__main__":
	qqman.manhattan("../../temp.assoc",out="./Manhattan.png")
2.2.2. Using Subplot
from qqman import qqman
import pandas as pd
import matplotlib.pyplot as plt

if __name__ == "__main__":
	df_assoc = pd.read_csv("../../temp.assoc", header=0, delim_whitespace=True)

	figure, axes = plt.subplots(nrows=2, ncols=2, figsize = (20,20))

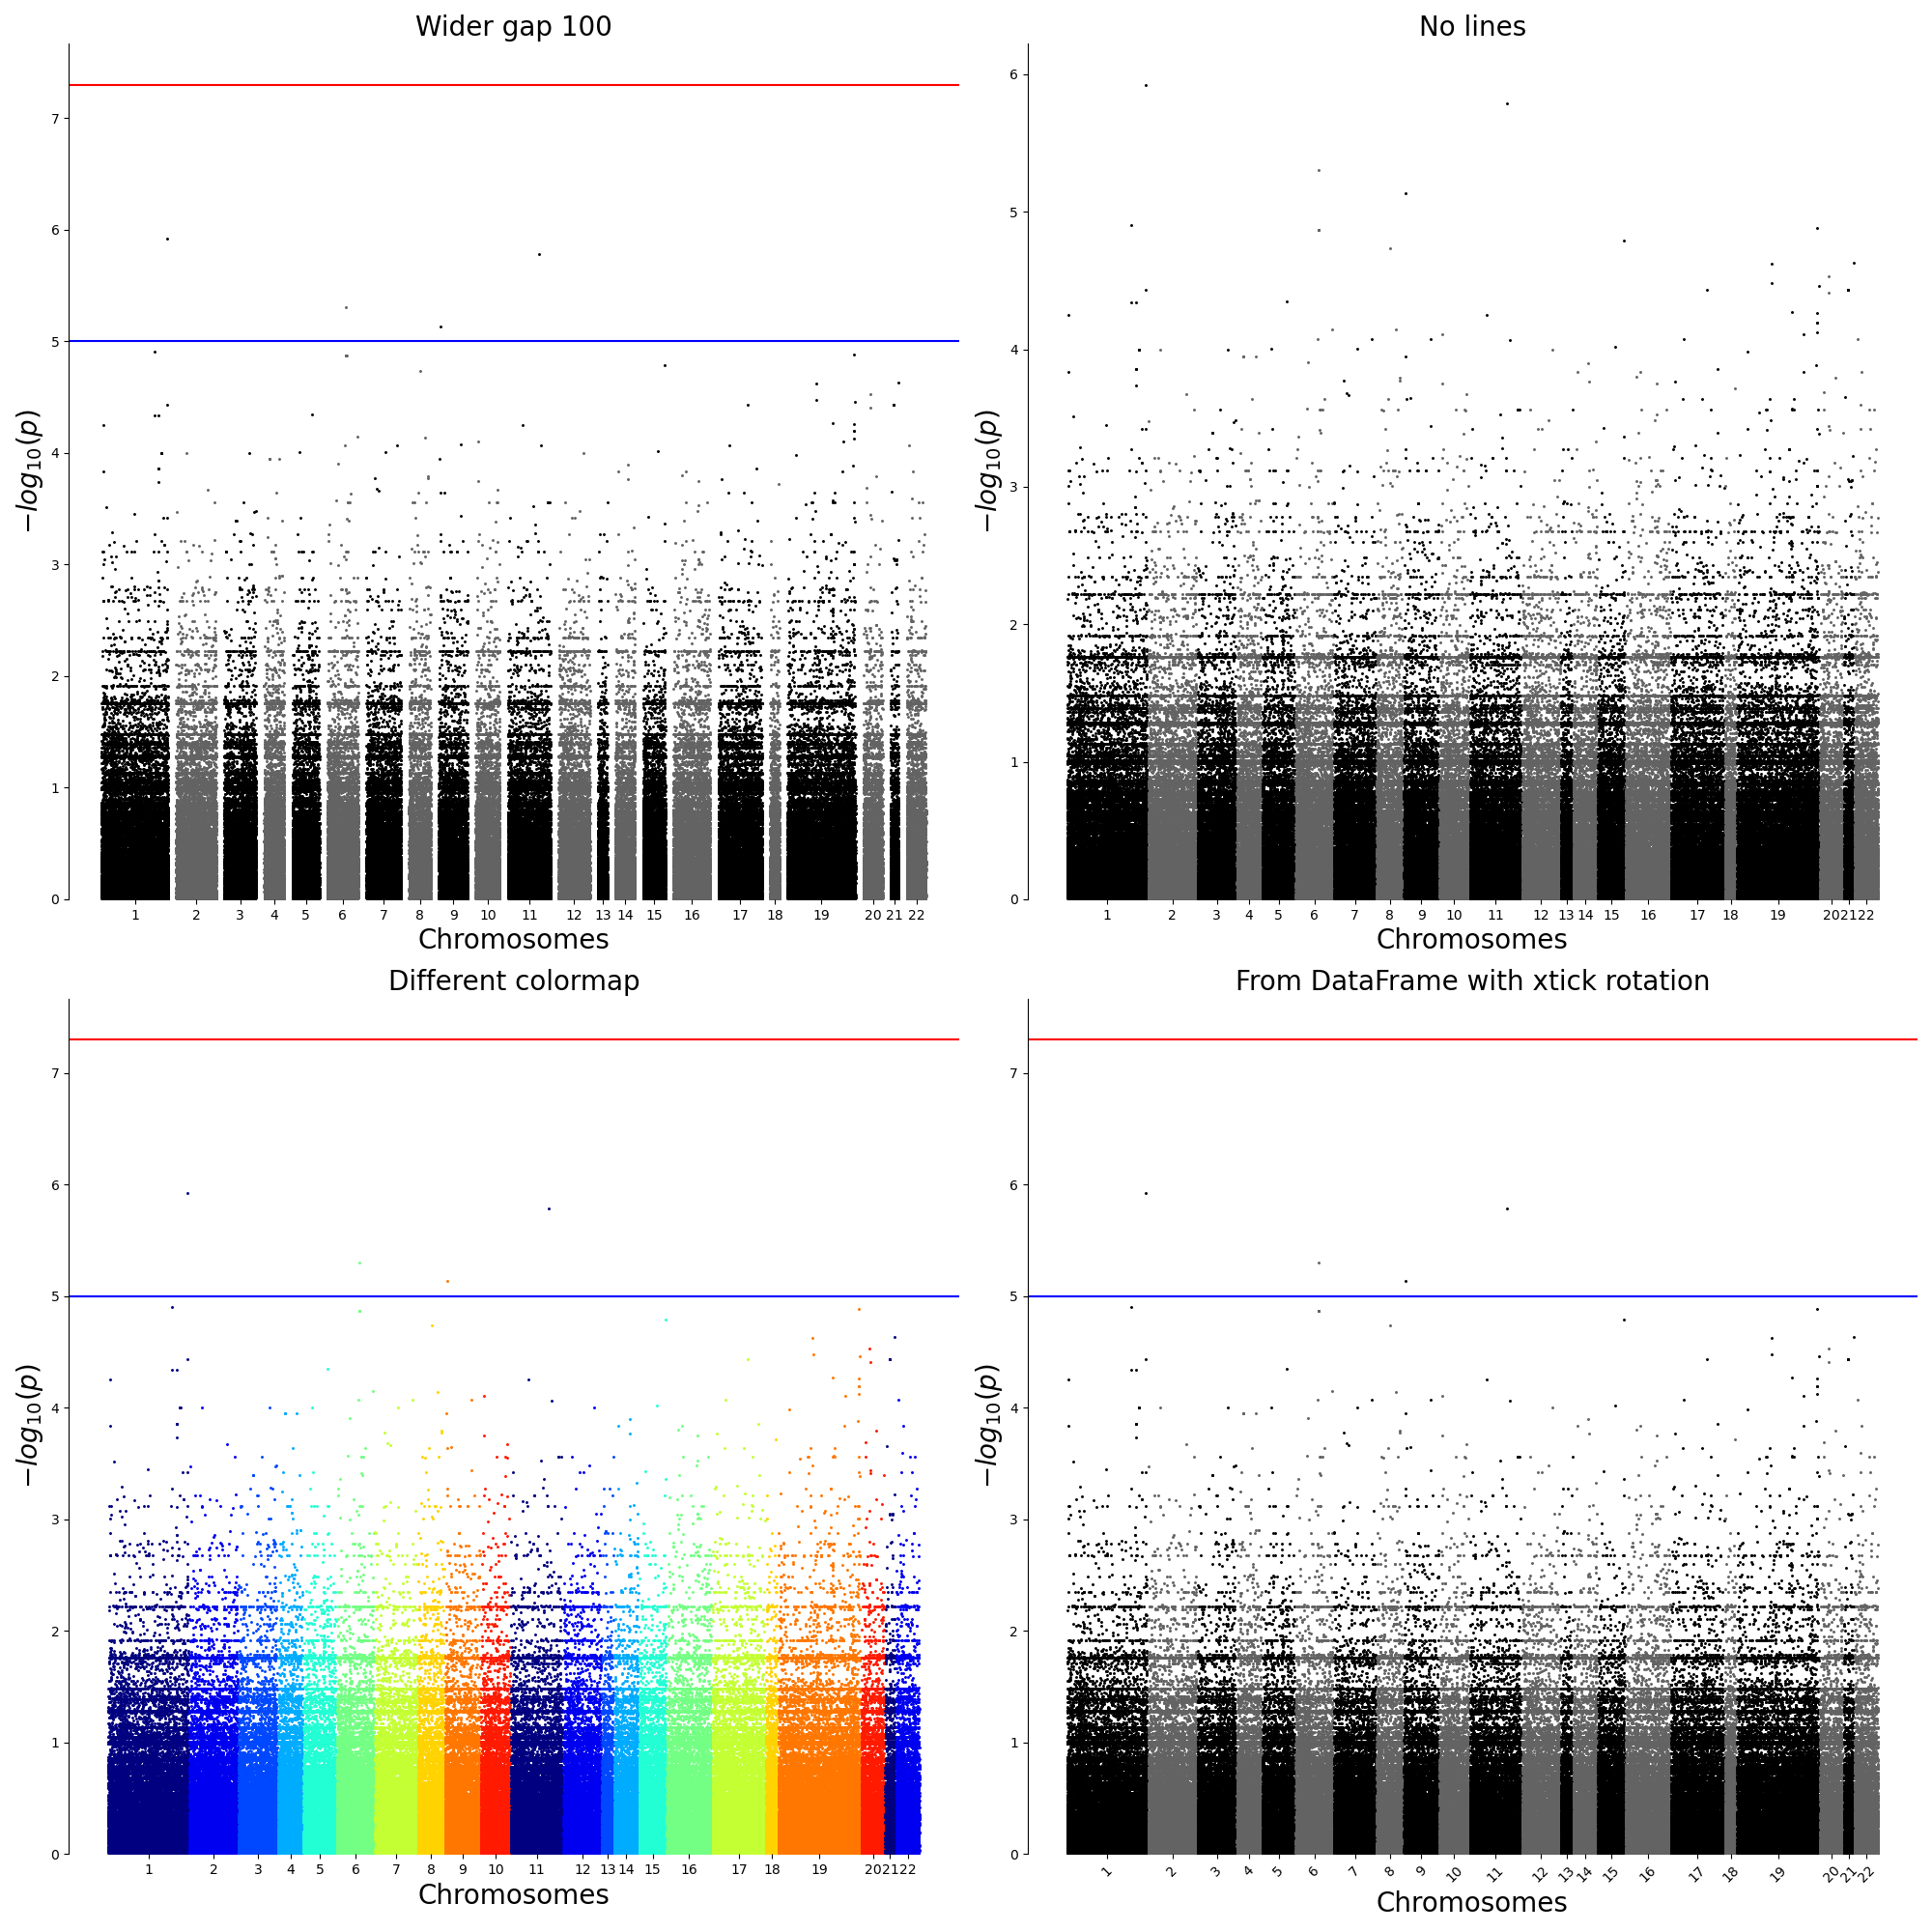
	qqman.manhattan("../../temp.assoc", ax=axes[0,0],title="Wider gap 100", gap=100)
	qqman.manhattan("../../temp.assoc", ax=axes[0,1],title="No lines",suggestiveline=False, genomewideline=False)
	qqman.manhattan("../../temp.assoc", ax=axes[1,0],title="Different colormap",cmap=plt.get_cmap("jet"),cmap_var=10)
	qqman.manhattan(df_assoc, ax=axes[1,1],title="From DataFrame with xtick rotation",xrotation=45)

	figure.tight_layout()
	plt.savefig("./manhattan.png",format="png")
	plt.clf()
	plt.close()
3. QQ Plot
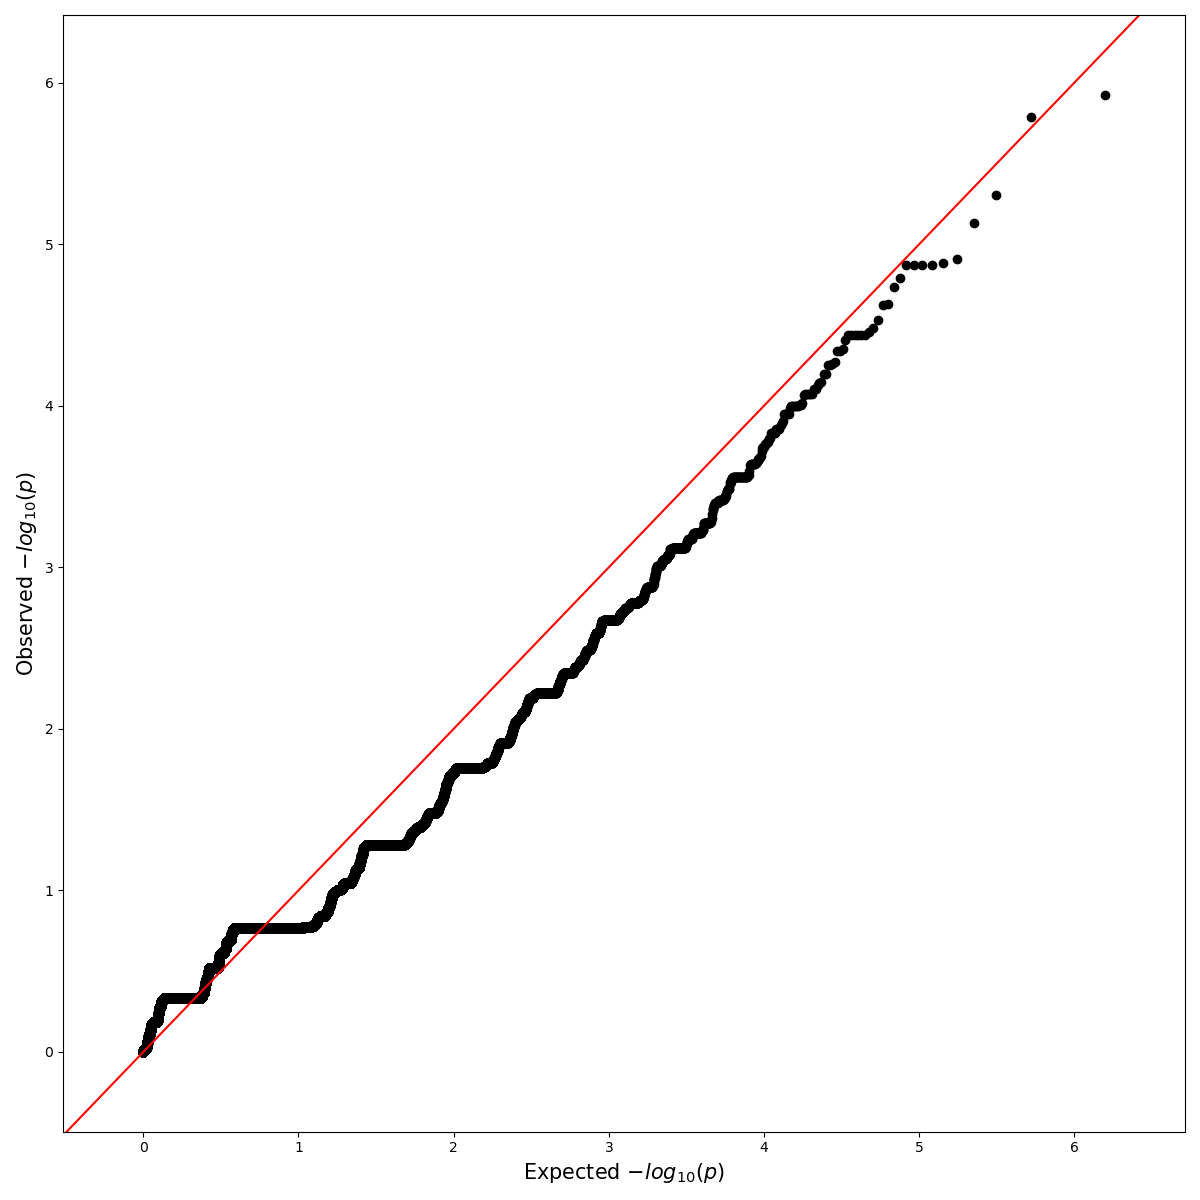
Draws a quantile-quantile plot from p-values of GWAS.
3.1. Parameters
assoctypes: [string, pandas.DataFrame, numpy.array, list] |
- Input file path and name of the Plink assoc output. - Pandas DataFrame with columns [chromosome/basepair/p-value] |
|---|---|
out : string( optional ) |
Output path and file name of the plot. (ie. out="./Manhattan.png") |
point_size : int( optional ) |
The size of the scatter graph points (default s=5). |
show : bool( optional ) |
If true, the plot will be shown on your screen. (This option doesn't work in CUI environment.) |
ax : subplot( optional ) |
If given, this subplot is used to plot in instead of a new figure being created. |
title : string( optional ) |
A title of the plot. |
title_size : int( optional ) |
A size of the title of the plot. |
label_size : int( optional ) |
A size of x and y labels of the plot. |
xtick_size : int( optional ) |
A size of xtick labels. |
ytick_size : int( optional ) |
A size of ytick labels. |
xrotation : float( optional ) |
A rotation degree of xtick labels. |
yrotation : float( optional ) |
A rotation degree of ytick labels. |
col_p : string( optional : default="P" ) |
A string denoting the column name for the p-value. Defaults to PLINK’s "P" Said column must be numeric. |
3.2. Examples
3.2.1. Simple
from qqman import qqman

if __name__ == "__main__":
	qqman.qqplot("../../temp.assoc",out="./QQplot.png")
3.2.2. Using Subplot
from qqman import qqman
import pandas as pd
import matplotlib.pyplot as plt

if __name__ == "__main__":
	df_assoc = pd.read_csv("../../temp.assoc", header=0, delim_whitespace=True)
	p_vals = list(df_assoc['P'])

	figure, axes = plt.subplots(nrows=2, ncols=2, figsize = (20,20))

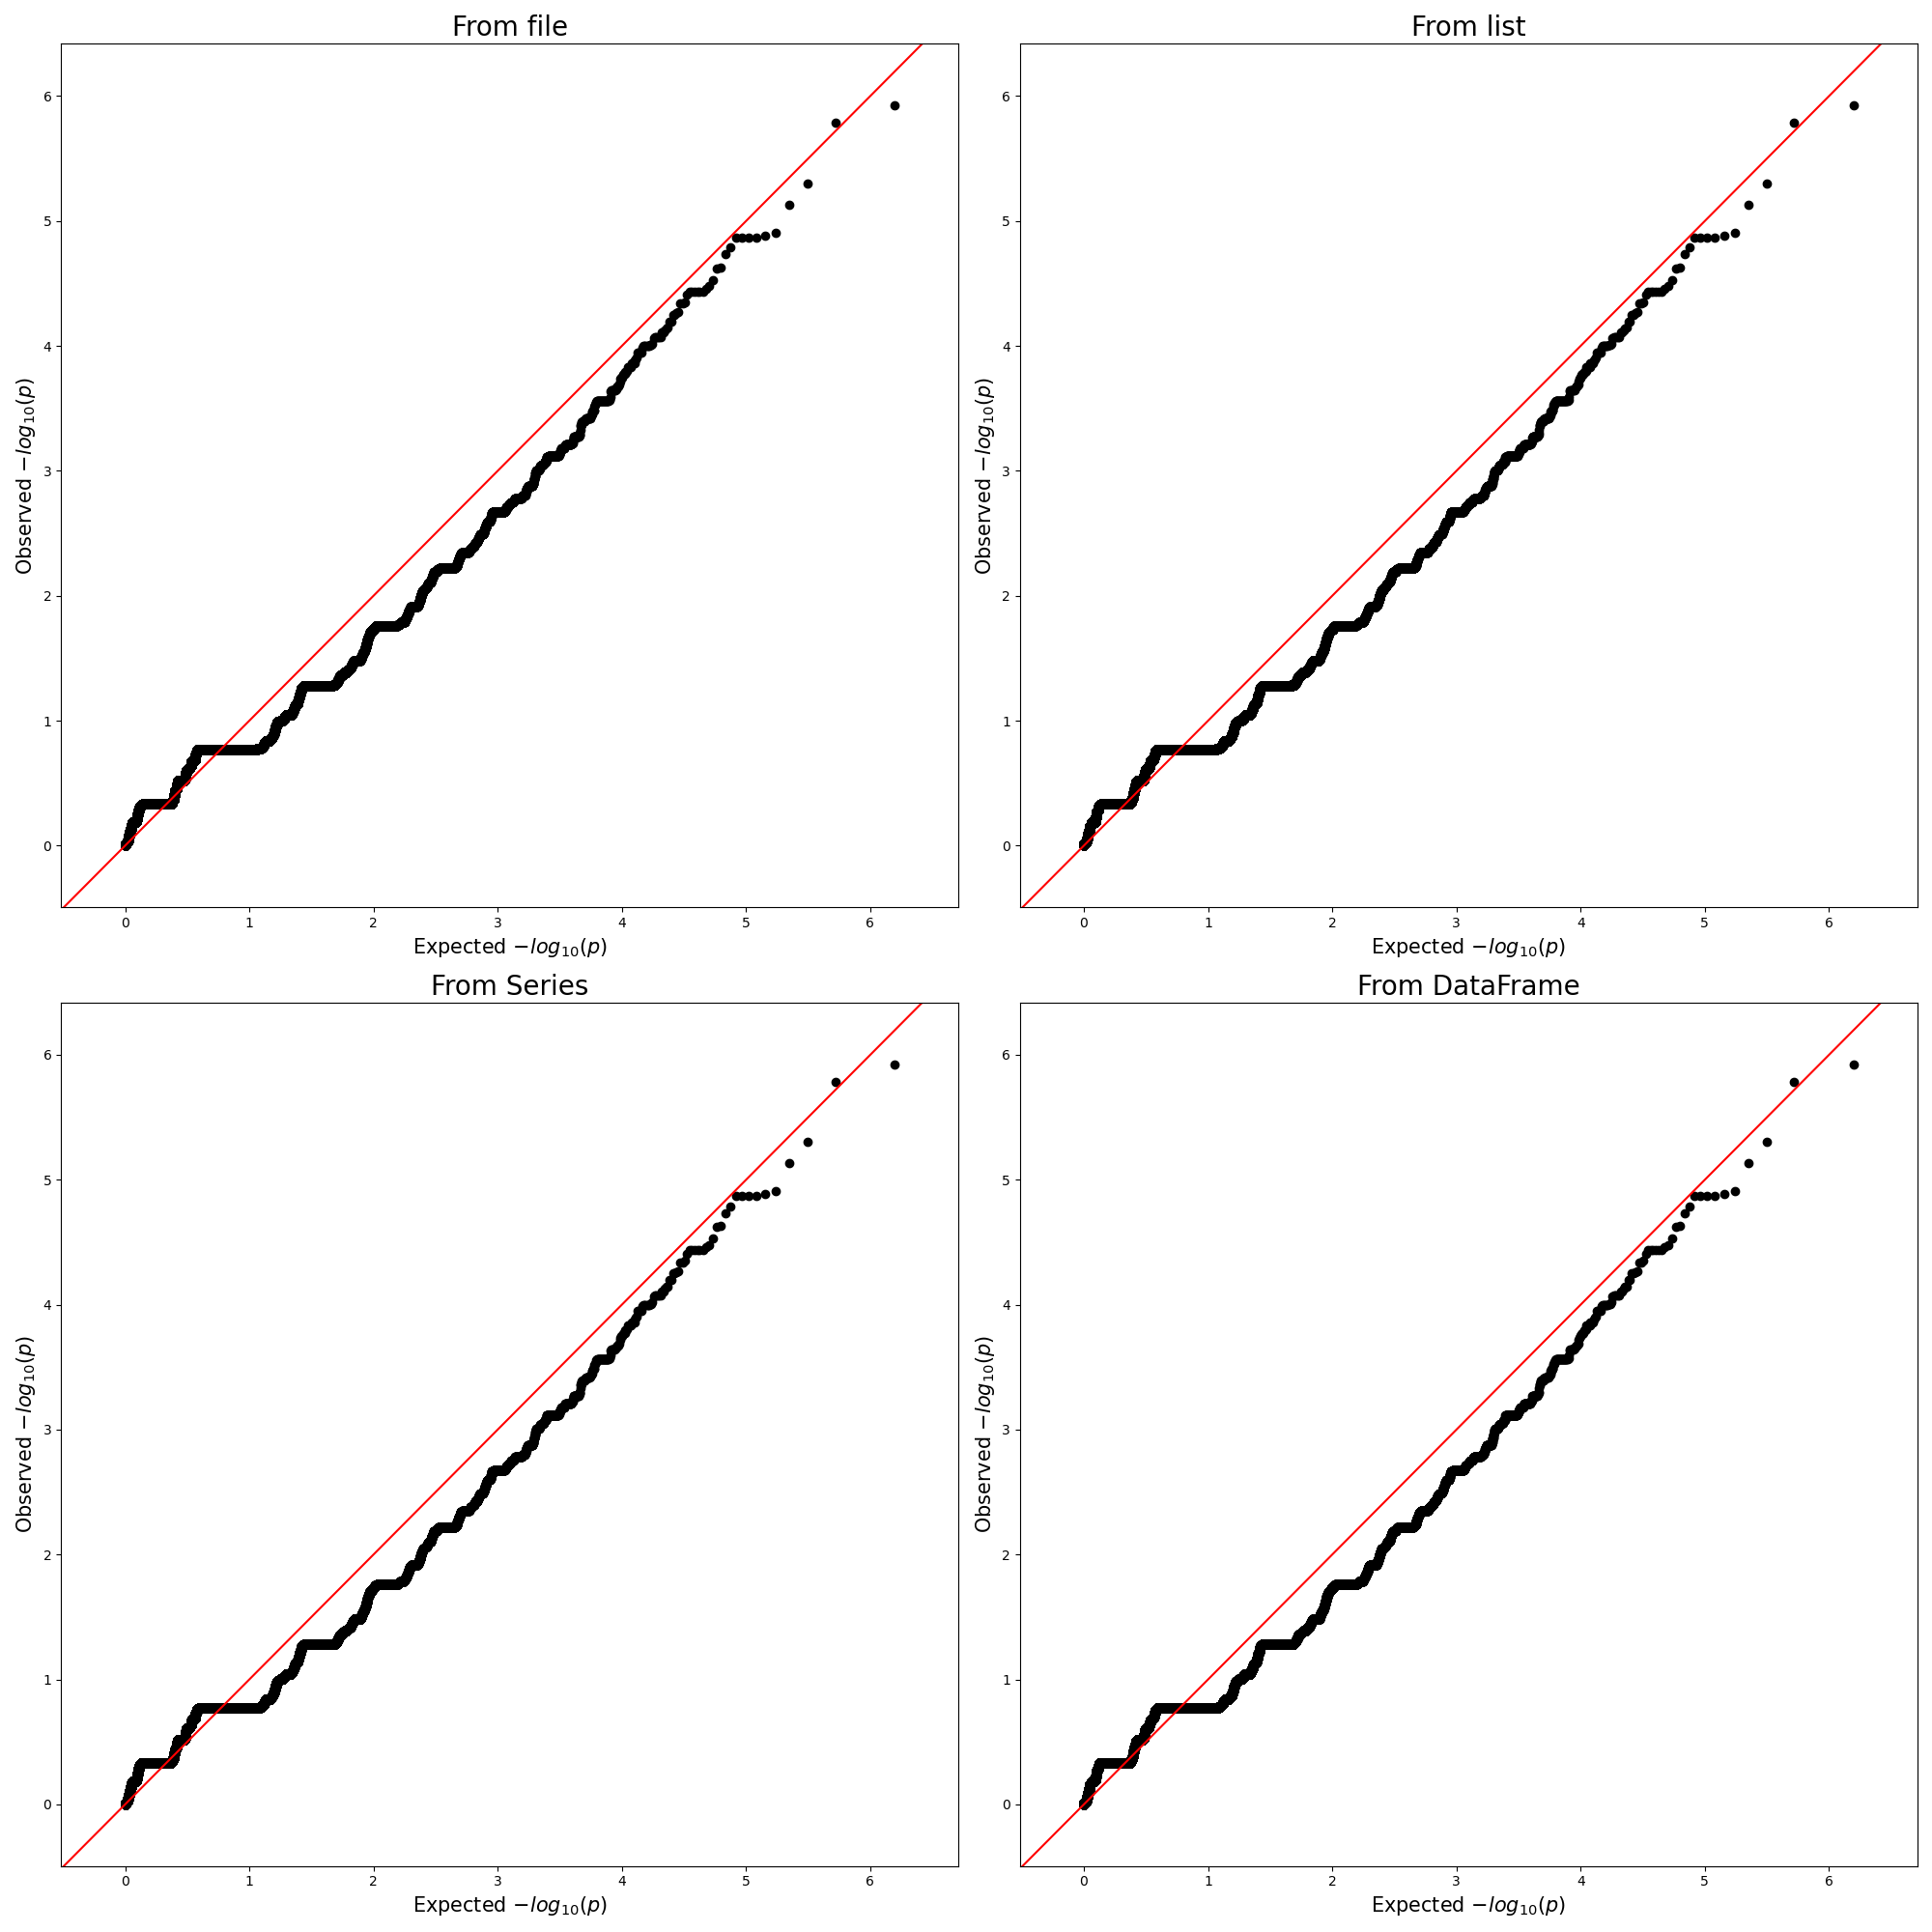
	qqman.qqplot("../../temp.assoc", ax=axes[0,0],title="From file")
	qqman.qqplot(p_vals, ax=axes[0,1],title="From list")
	qqman.qqplot(df_assoc.P, ax=axes[1,0],title="From Series")
	qqman.qqplot(df_assoc, ax=axes[1,1],title="From DataFrame")

	figure.tight_layout()
	plt.savefig("./SubQQplot.png",format="png")
	plt.clf()
	plt.close()
Release history Release notifications | RSS feed


Download files
Download the file for your platform. If you're not sure which to choose, learn more about installing packages.
Source Distribution
Built Distribution
Filter files by name, interpreter, ABI, and platform.
If you're not sure about the file name format, learn more about wheel file names.
Copy a direct link to the current filters
File details
Details for the file qqman-1.0.8.tar.gz.
File metadata
- Download URL: qqman-1.0.8.tar.gz
- Upload date:
- Size: 972.8 kB
- Tags: Source
- Uploaded using Trusted Publishing? No
- Uploaded via: twine/6.2.0 CPython/3.10.19
File hashes
| Algorithm | Hash digest | |
|---|---|---|
| SHA256 |
455e571901336983a73041feb134dd6e71e8d8972f4549a21afdc0ff0bdad91b
|
|
| MD5 |
8fa61e9c2fdcac009f24cef70df004ea
|
|
| BLAKE2b-256 |
7b97c59bd1c574062529bf735a184c5af214d011bdb84c60f57aa861742b393e
|
File details
Details for the file qqman-1.0.8-py3-none-any.whl.
File metadata
- Download URL: qqman-1.0.8-py3-none-any.whl
- Upload date:
- Size: 7.8 kB
- Tags: Python 3
- Uploaded using Trusted Publishing? No
- Uploaded via: twine/6.2.0 CPython/3.10.19
File hashes
| Algorithm | Hash digest | |
|---|---|---|
| SHA256 |
77460d80bfdab168ae6e1ecf1a2b5a7b415683e74fbd35f84270b8d546ab320c
|
|
| MD5 |
528153d51786ad29784526e818bb5071
|
|
| BLAKE2b-256 |
39ccfebaf27fa10ee054df37755448b3f261396c2eee7d1a9c68e1a2770176ea
|






