

QualiSR-Lab: Reduced-Reference IQA for SR
Oleg Ryabinin1,2 | Evgeney Bogatyrev1,2,3 | Khaled Abud1,2,3 | Dmitriy Vatolin1,2,3
1Lomonosov Moscow State University, 119991, Moscow, Russia
2AI Center, Lomonosov Moscow State University
3MSU Institute for Artificial Intelligence, Lomonosov Moscow State University
Overview
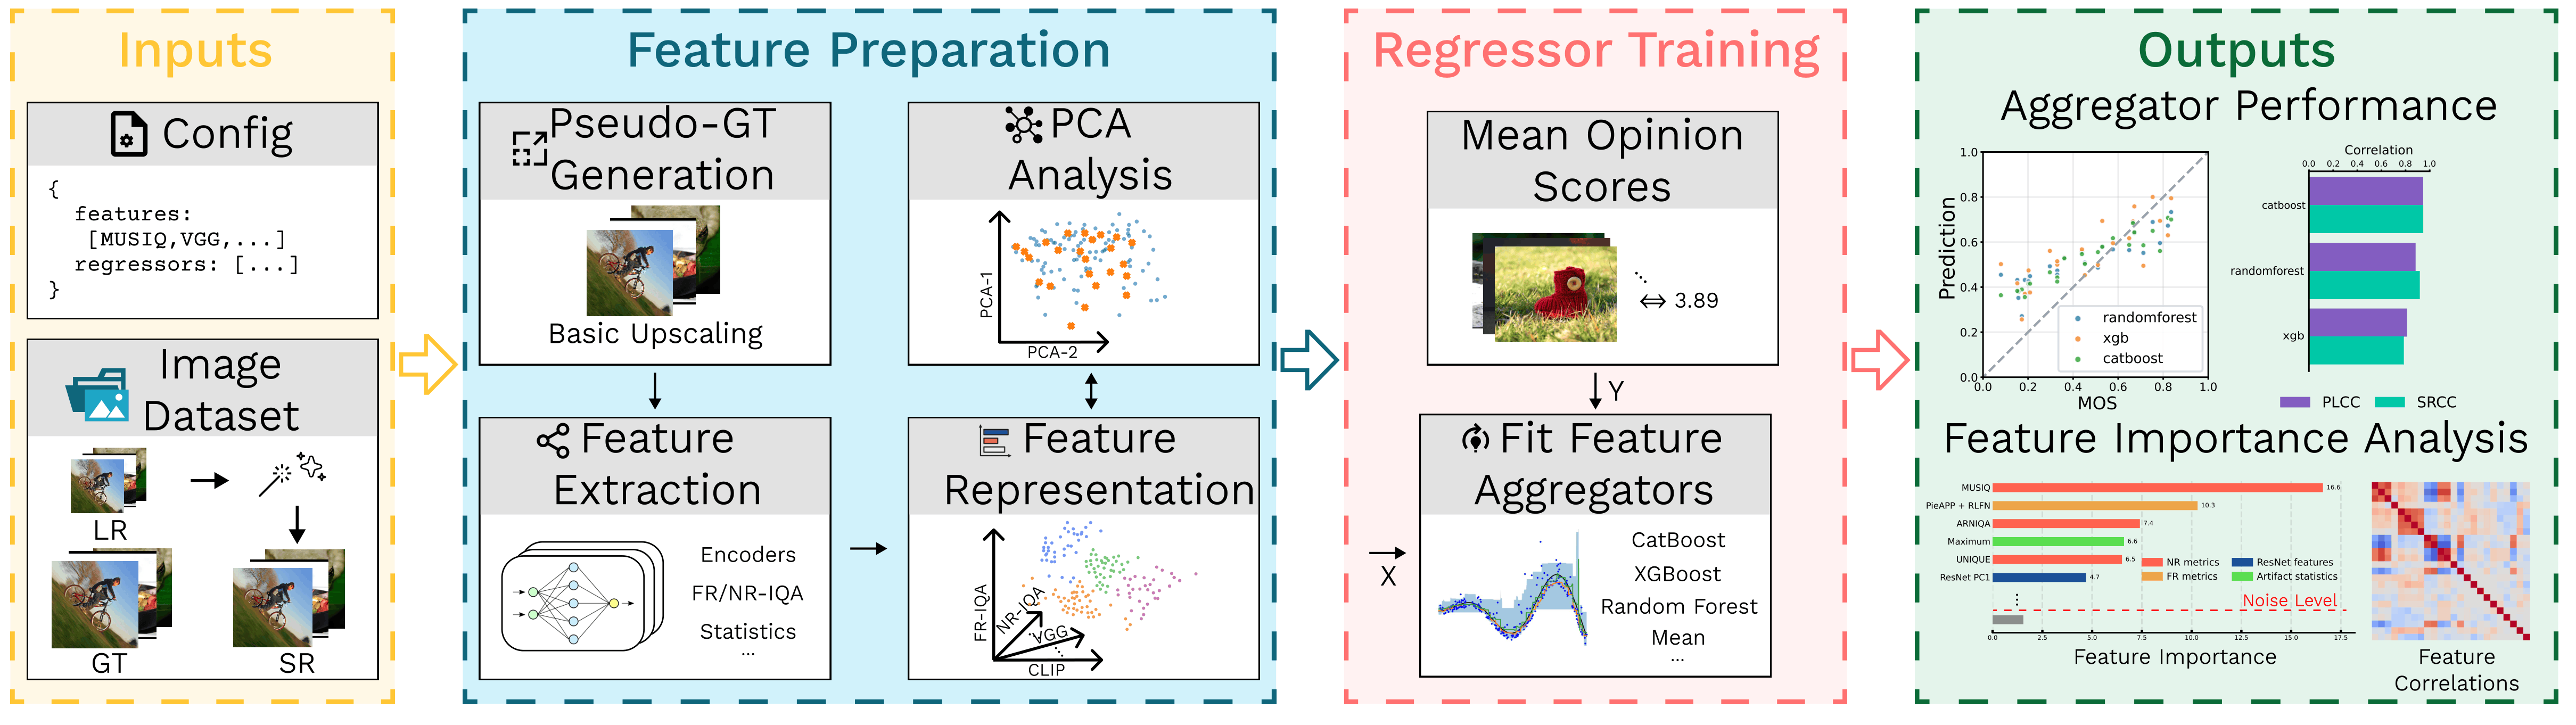
This project studies which features extracted from Low-Resolution (LR) and Super-Resolution (SR) images are most informative for Image Quality Assessment (IQA). Its purpose is to assist researchers in studying the best features for their upscaled image quality metrics by providing a pipeline to extract the features and build a comprehensive graphical summary on their contribution to IQA and correlation of the resulting metric with human scores.
The proposed pipeline is:
-
Prepare labels and features
Compute image features and attach normalized quality labels. -
Train regressors
Fit regression models on the resulting tabular data to obtain a simple Reduced-Reference (RR) quality metric. -
Analyze feature importance and correlation
Evaluate feature importance and compute PLCC/SRCC to identify the most informative features for SR quality assessment.
The sections below describe the required data format and the workflow.
Installation and quickstart
Python 3.12 or 3.13 is required. From the repository root:
python -m pip install -c requirements.txt -e ".[regressors]"
qualisr-run-regressors
This runs Random Forest, XGBoost, and CatBoost on the packaged labels and precomputed features for 120 SR images. No image download is needed. Results and plots are written to plots/baseline@pca5/; add --no-plots to skip plotting.
For image feature extraction, install the additional dependencies:
python -m pip install -c requirements.txt -e ".[features,regressors]"
The PyPI package is also available:
python -m pip install "qualisr-lab[features,regressors]==0.2.0"
The Docker image includes regression dependencies and runs the bundled example without plots:
docker build -t qualisr-lab:0.2.0 .
mkdir -p plots
docker run --rm --mount type=bind,source="${PWD}/plots",target=/app/plots qualisr-lab:0.2.0
Create the local plots/ directory first if needed. The mount preserves results after the container exits. For an interactive shell, append bash and add -it to docker run.
Docker applies requirements.txt as constraints, including transitive dependencies.
To build the complete pinned Linux/CUDA environment instead, use
docker build --build-arg QUALISR_EXTRAS=all -t qualisr-lab:0.2.0-all ..
The full environment is large and includes NVIDIA libraries; GPU execution also requires
the container runtime's GPU support.
For the complete pinned environment locally, including notebook and development dependencies:
python -m pip install -r requirements.txt -e .
# Alternatively, from PyPI:
python -m pip install "qualisr-lab[all]==0.2.0"
# Or with Conda from the repository root:
conda env create -f environment.yml
The notebook extra provides IPython and an IPython kernel; the dev extra provides
pytest and Ruff. LightGBM and the separate shap package are optional integrations
outside the pinned environment; install them separately if needed. XGBoost's native
SHAP computation remains available with the regressors extra.
The wheel includes the current pipeline config, experiment JSONs, and the five CSVs used by the bundled example. Experiment configs still require their external datasets and locally configured paths. Release preparation is documented in RELEASE.md.
See dataset/readme.md for dataset download notes and the parser/sample interface for custom datasets.
Run with image datasets
Download QualiSR-Set120, then run commands from the repository root. The unified runner loads the configured datasets once and uses consistent sample IDs across feature extraction, artifact statistics, and regression.
Before running the full pipeline, edit configs/pipeline.json:
- Set each dataset's
rootandfeatures_root. - Select the feature groups and metrics needed for the experiment. Reference embeddings, generic timm embeddings, and embedding differences are disabled by default.
qualisr-run-pipeline --config configs/pipeline.json
The runner does not download datasets or generate artifact masks. It writes feature CSVs under features/, PCA outputs under features/pca/, and regression outputs under plots/ with the default paths. The default regressor inputs are NR metrics without Q-Align, RLFN-based FR metrics, and VGG/ResNet PCA-5 features.
Run individual stages with the same configuration:
qualisr-run-pipeline --config configs/pipeline.json --only-section references
qualisr-run-pipeline --config configs/pipeline.json --only-section features
qualisr-run-pipeline --config configs/pipeline.json --only-section pca statistics
qualisr-run-regressors --config configs/pipeline.json
An explicit dataset configuration requires the LR/SR image files. Omit --config for the image-free bundled example. For custom parsers, dataset roles, and path rules, see the dataset guide. For ablations, transfer studies, and grouped cross-validation, see the experiment suite.
Python API
Run the bundled experiment without plots:
from qualisr import run_regressor_experiment

result = run_regressor_experiment(make_plots=False)
print(result["results"])
Run the regression stage of a configured image dataset:
from qualisr import run_pipeline

run_pipeline(
    config_path="configs/pipeline.json",
    only_section=["regressors"],
    no_plots=True,
)
Full Reproducibility Run
To download the dataset and run feature extraction, PCA, artifact statistics, and regressor analysis end to end:
python -m pip install -r requirements.txt -e .
qualisr-run-pipeline --config configs/pipeline.json
You can also use BASH script:
bash reproduce_pipeline.sh
The script writes feature-group CSVs such as features/fr.csv, features/nr.csv, and features/vgg.csv, PCA outputs to features/pca/, and plots/results to plots/.
Workflow
You may either launch the whole pipeline in a single command with your JSON config as in the previous section or do each step separately. The unified pipeline parses the configured datasets entries into one shared sample list; datasets may use a bundled parser, a parser function from a user Python file, or explicit labels/image directories. Multiple entries are combined in one run. See dataset/readme.md for the complete contract.
The standalone commands below retain their directory-based arguments for focused use outside the unified pipeline.
Step 0 (optional): Prepare reference images
Produce RLFN / SPAN / bicubic images for LR + SR pairs (used to compute FR metrics).
The bundled realtime_sr/ directory is a clone-only convenience asset; pip
installs do not include these scripts/checkpoints, so pass your own paths for
RLFN/SPAN when running outside the repository.
qualisr-make-reference \
  --lr-dir dataset/lr \
  --sr-dirs PASD=dataset/sr/PASD SUPIR=dataset/sr/SUPIR RealESRGAN=dataset/sr/RealESRGAN \
  --out-root dataset/ref \
  --refs bicubic rlfn span \
  --scale 4 \
  --rlfn-script realtime_sr/RLFN/inference-RLFN.py \
  --rlfn-ckpt realtime_sr/RLFN/rlfn-tuned-4x.pth \
  --span-script realtime_sr/SPAN/inference-SPAN.py \
  --span-ckpt realtime_sr/SPAN/span-tuned-4x.pth
Step 1: Compute image features
Compute FR / NR / VGG / ResNet / SigLIP features for SR images and save them into a single CSV file. VGG, ResNet, and timm embeddings can also be extracted from one configured SR-resolution reference type.
SR methods are passed as METHOD=DIR.
Reference image filenames are expected in the format:
<sr_stem>@<sr_method>@<ref_name>.<ext>
qualisr-extract-features \
  --sr-dirs PASD=dataset/sr/PASD SUPIR=dataset/sr/SUPIR RealESRGAN=dataset/sr/RealESRGAN \
  --gt-dir dataset/hr \
  --lr-dir dataset/lr \
  --ref-dirs bicubic=dataset/ref/bicubic rlfn=dataset/ref/rlfn span=dataset/ref/span \
  --features fr,nr,vgg,resnet,siglip \
  --output features/image_features.csv \
  --device cuda
To extract the corresponding embeddings from one reference type, select it with
--embedding-reference and use the ref-vgg, ref-resnet, or ref-timm
feature names. For example:
qualisr-extract-features \
  --sr-dirs PASD=dataset/sr/PASD SUPIR=dataset/sr/SUPIR RealESRGAN=dataset/sr/RealESRGAN \
  --ref-dirs bicubic=dataset/ref/bicubic \
  --embedding-reference bicubic \
  --features ref-vgg,ref-resnet \
  --output features/reference_embeddings.csv \
  --device cuda
In the unified pipeline, configure the reference once as
features.common.embedding_reference. All enabled reference-embedding groups
use that same reference.
Step 2: Apply PCA to high-dimensional features
Apply Principal Component Analysis (PCA) to high-dimensional feature blocks such as vgg_* and resnet_* in CSV files produced in Step 1.
qualisr-apply-pca \
  --input features/image_features.csv \
  --blocks vgg=vgg_ resnet=resnet_ \
  --n-components 5 10 25 50 75 \
  --test-size 0.2 \
  --split-seed 42 \
  --output-dir features/pca
For component-wise differences after PCA, independently fitted PCA coordinates are not comparable. Use paired mode to fit one basis on the stacked SR and reference training rows and transform both inputs:
qualisr-apply-pca \
  --input features/vgg.csv \
  --reference-input features/ref_vgg.csv \
  --blocks vgg=vgg_ \
  --reference-blocks vgg=ref_vgg_ \
  --n-components 5 \
  --output-dir features/pca \
  --output-template vgg_shared_pca{n}.csv \
  --reference-output-template ref_vgg_shared_pca{n}.csv
Step 3 (optional): Compute embedding differences
Compute signed, element-wise SR - reference differences. Rows are matched by
sample_id, and block mappings explicitly identify the corresponding columns:
qualisr-embedding-difference \
  --reference-input features/pca/ref_vgg_shared_pca5.csv \
  --sr-input features/pca/vgg_shared_pca5.csv \
  --blocks vgg_diff=vgg_pca_,vgg_pca_ \
  --output features/vgg_diff_pca5.csv
The same command can operate on raw embeddings, for example with
--blocks vgg_diff=ref_vgg_,vgg_.
Step 4: Compute artifact-mask statistics
Compute summary statistics for heatmaps stored as .npy, .npy.gz, or compatible compressed files.
Input directories can be passed as PREFIX=DIR to ensure stable sample naming.
qualisr-compute-stats \
  --heatmap-dirs PASD=dataset/heatmaps/PASD SUPIR=dataset/heatmaps/SUPIR RealESRGAN=dataset/heatmaps/RealESRGAN \
  --output features/stats.csv \
  --percentiles 5 95 \
  --area-thresholds 0 0.5 0.75
Step 5: Fit regressors and analyze results
Train regressors and produce summary on feature importances and correlations. The correlation plot can also include direct NR/FR metric baselines from feature CSV files.
qualisr-run-regressors --config configs/pipeline.json
Training and validation datasets, their split behavior, and their feature
roots are declared once in the top-level datasets list. See
dataset/readme.md.
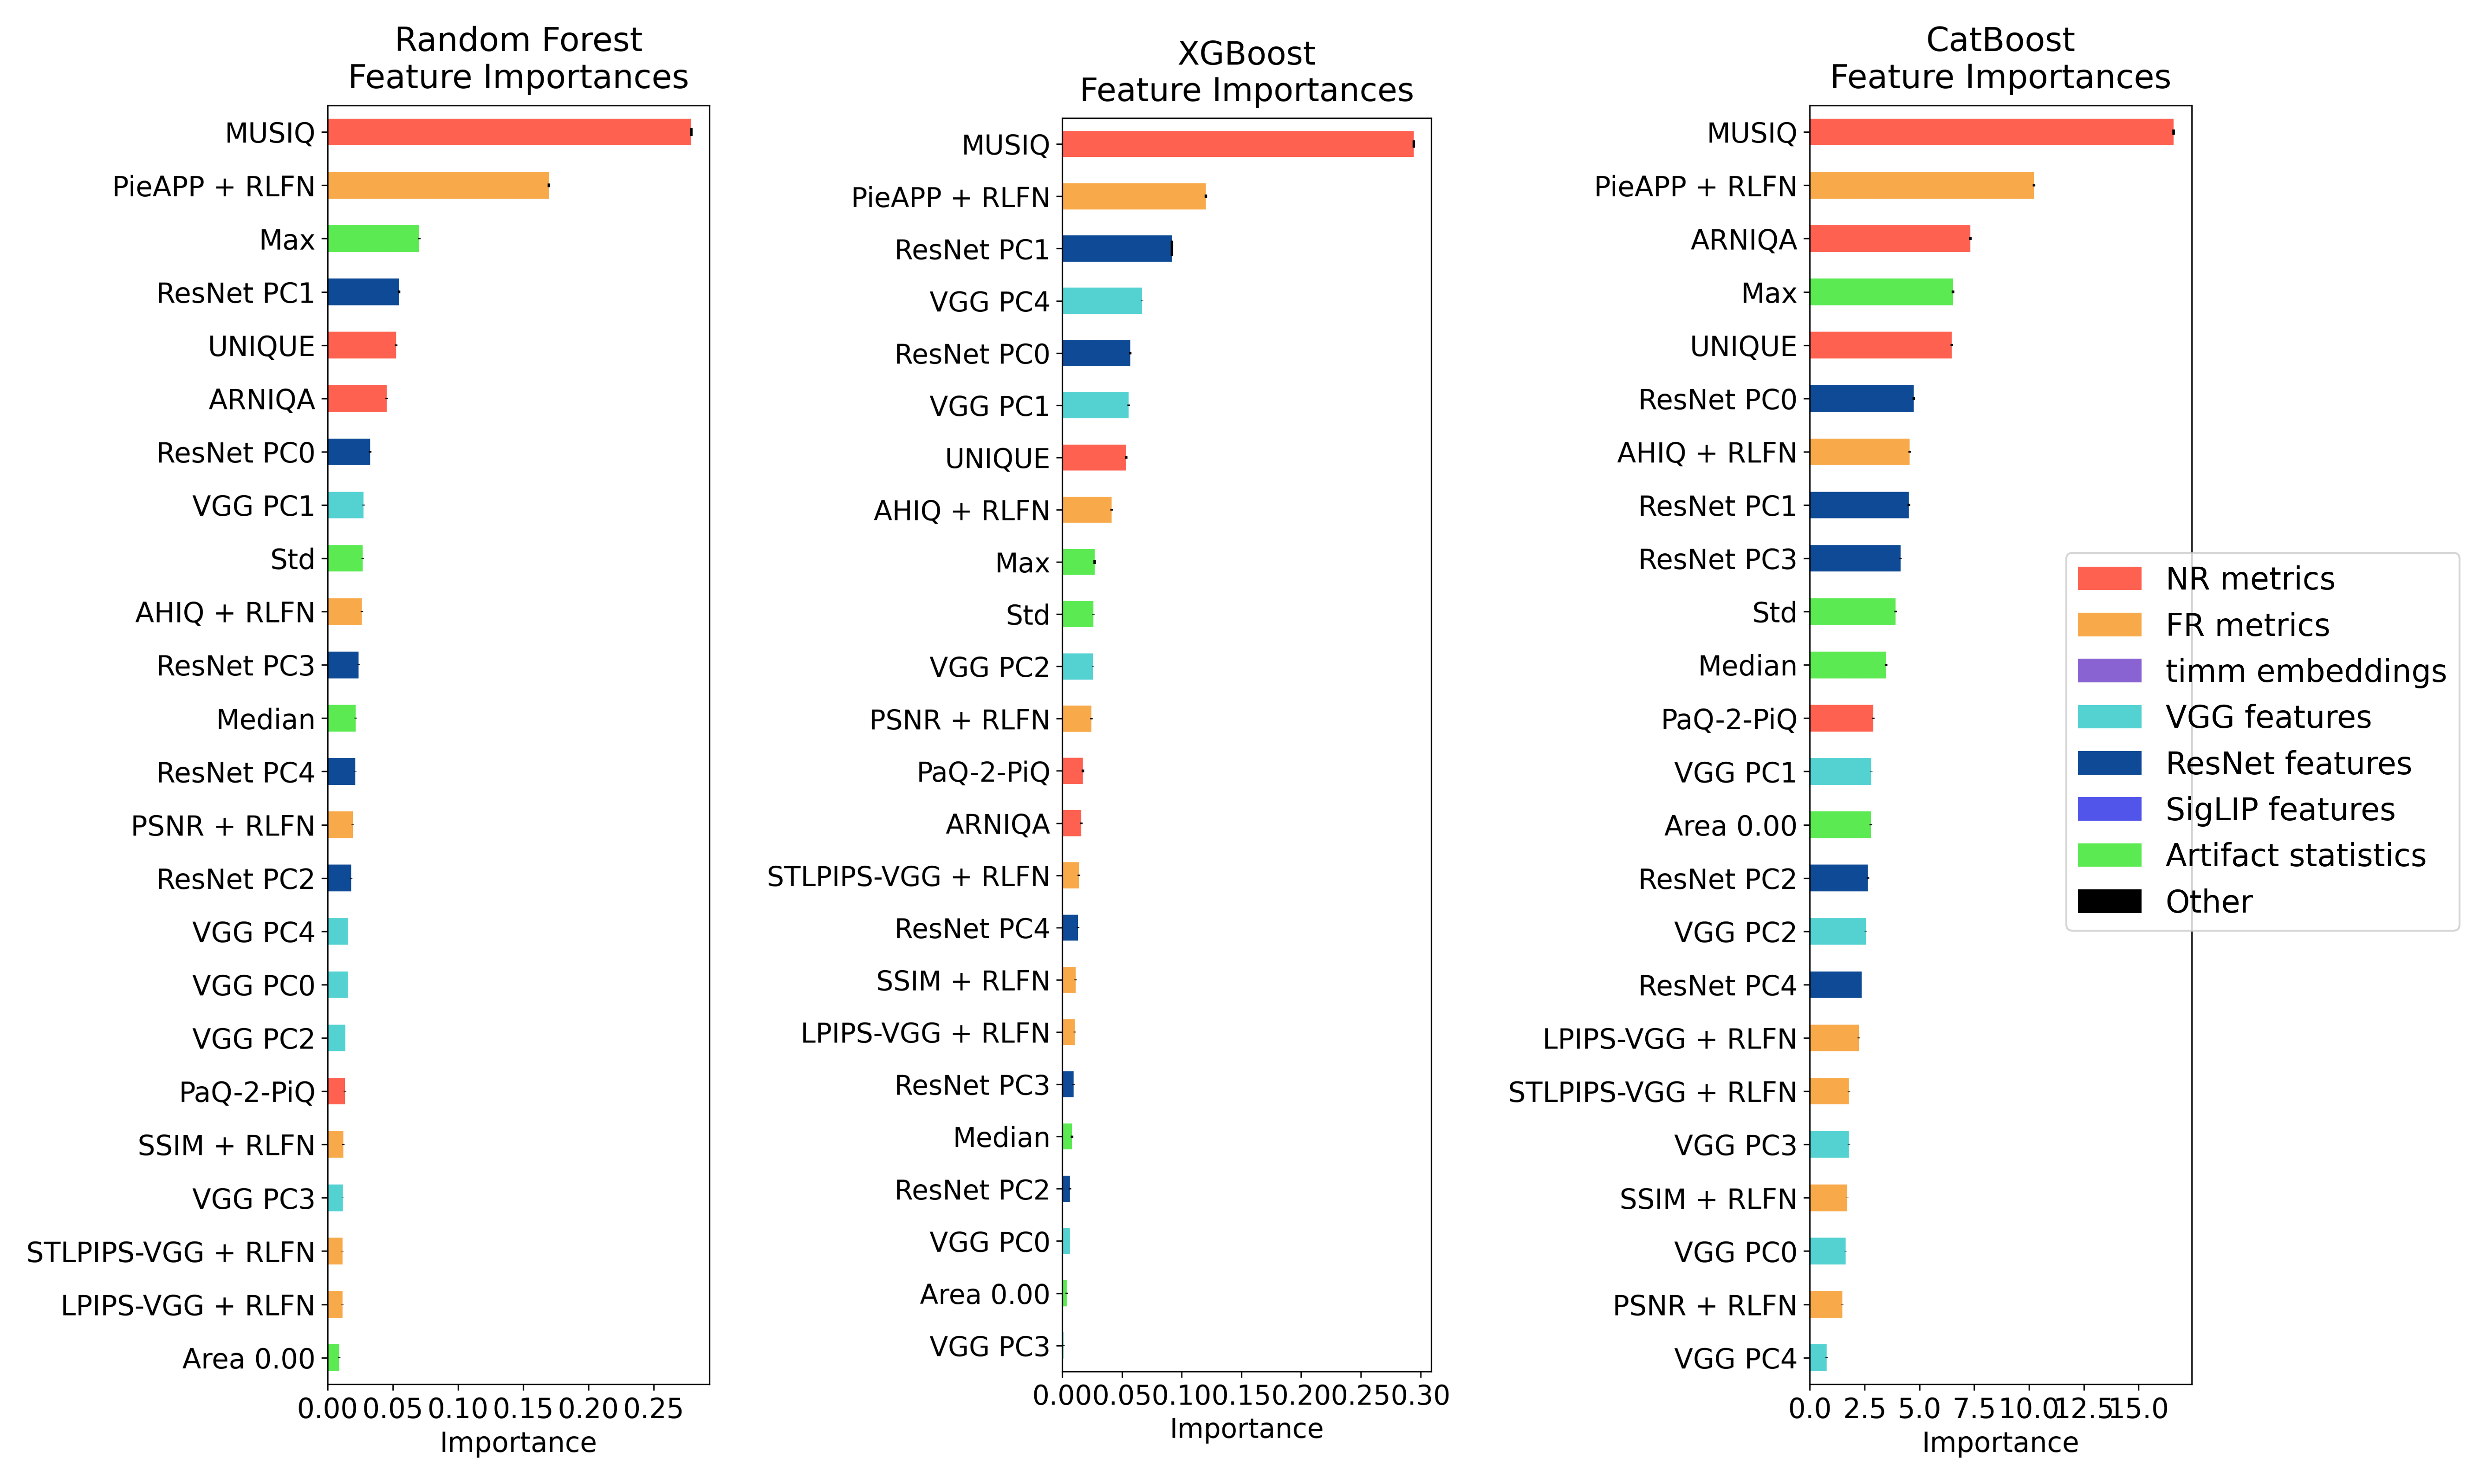
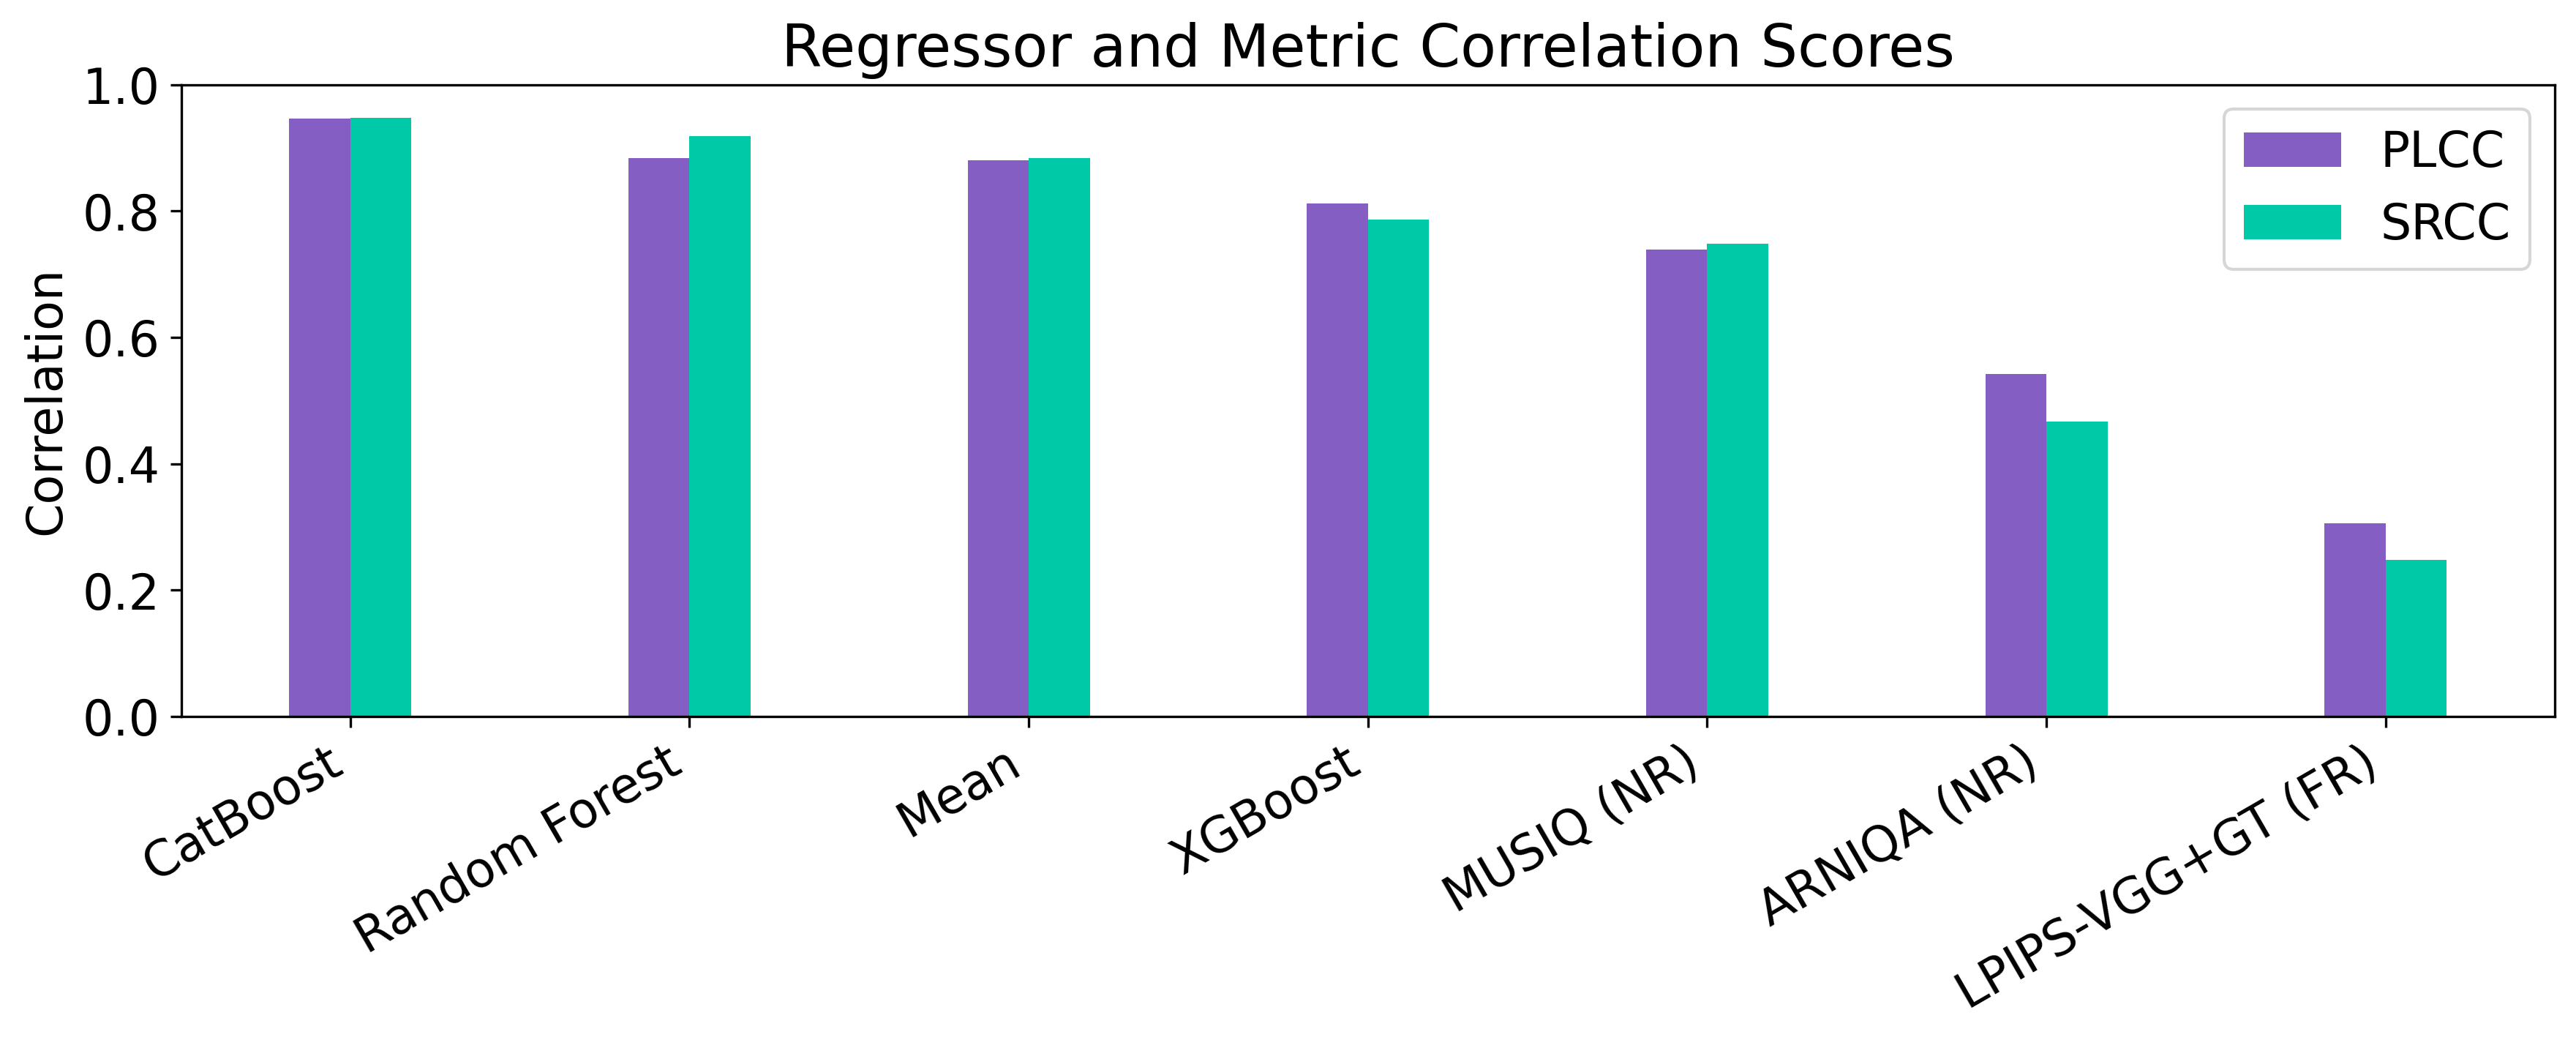
You can also use regressors.ipynb notebook for experimentsn; install .[regressors,notebook] to use it. It trains regressors, evaluates them, and visualizes:
- feature importances,
- PLCC/SRCC correlations,
- feature cross-correlation matrix,
- MOS/prediction scatter plot,
- comparisons across feature groups and model settings.
The first notebook cell describes the workflow for running experiments individually or in batches.
Example outputs:
Profiling
Add --profile to standalone feature extraction or statistics to write <output_stem>_profile.csv. Feature extraction also accepts --profile-flops, which reruns supported PyTorch model calls and implies profiling. FLOP values are estimates and may omit unsupported operations.
For regression, --profile writes runtime and prediction-cost estimates under the run's profiling/ directory. Supply --feature-profile-files (or profiling.feature_profile_files in the regressor config) for combined feature and regressor estimates. Unified feature/statistics profiling is configured in the corresponding JSON sections.
Feature Types
This section summarizes the feature groups used in the pipeline. For references and guidelines to adding custom features, address features/readme.md.
No-Reference (NR) metrics
NR metrics are widely used in SR-IQA because they do not require a perfect high-resolution reference image. Their main limitation is that they ignore information available in the input LR image, which may cause them to miss or even reward artifacts introduced by SR models.
Recommended NR metrics in this project, based on results from VSRQAD:
These metrics are computed through the PyIQA interface, so the list can be changed easily.
Full-Reference (FR) metrics
FR metrics are not always ideal for SR-IQA because they assume access to a perfect reference image. Still, they provide useful information about fidelity.
When true GT images are unavailable, the project uses pseudo-GT references: images obtained by upscaling the LR input with methods that are faithful to the LR image and do not introduce strong hallucinated content.
Reference upscaling methods used here:
Recommended FR metrics in this project, based on results from VSRQAD:
These metrics are also computed through PyIQA.
Pretrained encoder features (+ PCA)
Feature embeddings from pretrained encoders can capture semantic and perceptual information not covered by classical IQA metrics.
This project uses features extracted from:
Because these embeddings are often high-dimensional, Principal Component Analysis (PCA) can be applied before training regressors.
Artifact-mask statistics
Artifacts are common in modern deep-learning-based SR models. The working hypothesis of this project is:
Artifact-related information provides useful signals for assessing generated image quality.
An artifact mask is a single-channel tensor with values in the range [0, 1].
Masks for SR images must be computed beforehand with a suitable method such as Prominence-Aware Artifact Detector.
The project extracts the following summary statistics from artifact masks:
- min
- max
- mean
- median
- std
- percentiles
- thresholded artifact area
License
Project code is released under the BSD-3-Clause license. Third-party code, checkpoints, and datasets have separate terms; see third-party notices and the dataset guide.
1 maintainer

Metadata
1 maintainer
Release files for qualisr-lab 0.2.0
For a detailed explanation of source distributions (sdists) and built distributions (wheels), please see the package formats documentation.
Source distribution (sdist)
| File | Size | Uploaded | |
|---|---|---|---|
| qualisr_lab-0.2.0.tar.gz | 749.5 kB | Details |
Built distribution (wheel)
| File | Interpreter | ABI | Platform | Reset |
|---|---|---|---|---|
| qualisr_lab-0.2.0-py3-none-any.whl | Python 3 | none | any | Details |
Total release size: 1.2 MB
Release files / qualisr_lab-0.2.0.tar.gz
| Download URL | qualisr_lab-0.2.0.tar.gz |
|---|---|
| Size | 749.5 kB |
| Tags | Source |
|
SHA-256 checksum How to use checksums |
0f00b820bf2775df8e9d515fe87b0be628a10251f6f9cf240e841502a6c277a9
|
|
BLAKE2b-256 checksum How to use checksums |
967357777f88e3ed5fdba024654615c0f62faed2908044ef1164cccbd22e6400
|
| Upload date | |
|
Uploaded using Trusted Publishing? What is trusted publishing? |
No |
| Uploaded via |
twine/7.0.0 CPython/3.12.15
|
Release files / qualisr_lab-0.2.0-py3-none-any.whl
| Download URL | qualisr_lab-0.2.0-py3-none-any.whl |
|---|---|
| Size | 478.5 kB |
| Tags | Python 3 |
|
SHA-256 checksum How to use checksums |
38ce28ff9610a5f2a2bc64895f324dabfbfe0dff836939a3dcb07bbe814b4c05
|
|
BLAKE2b-256 checksum How to use checksums |
d9aa61816ec5bc51b15d3a7ca1bc870979cd5d6cabffad65a05cefef215dd6ae
|
| Upload date | |
|
Uploaded using Trusted Publishing? What is trusted publishing? |
No |
| Uploaded via |
twine/7.0.0 CPython/3.12.15
|














