
Quality Profiles
Benchmark optimization solvers by the quality of the solutions they return.










Installation · Quick start · Plot styles · What is computed · API · Paper's experiments · Documentation · Citation · Contributing
Performance and data profiles measure how much effort a solver needs. Quality profiles measure something else: how good the final objective values are, relative to a common starting point and a reference value, over the whole range of precision levels. They need no a priori thresholds, and they handle failures and solvers that converge to different local minimizers, so no test problem has to be excluded.
This package implements the method of
G. Fasano, C. Piermarini, M. Roma. Benchmarking Optimization Algorithms with Quality Profiles and Test Set Profiles. Mathematical Programming Computation (accepted). arXiv:2607.16798
It is a Python port of the authors' reference MATLAB code (fasano-g/Quality-Profiles). On the same grid it gives exactly the same values, and it runs much faster: 20,000 problems and 20 solvers take a few hundredths of a second.
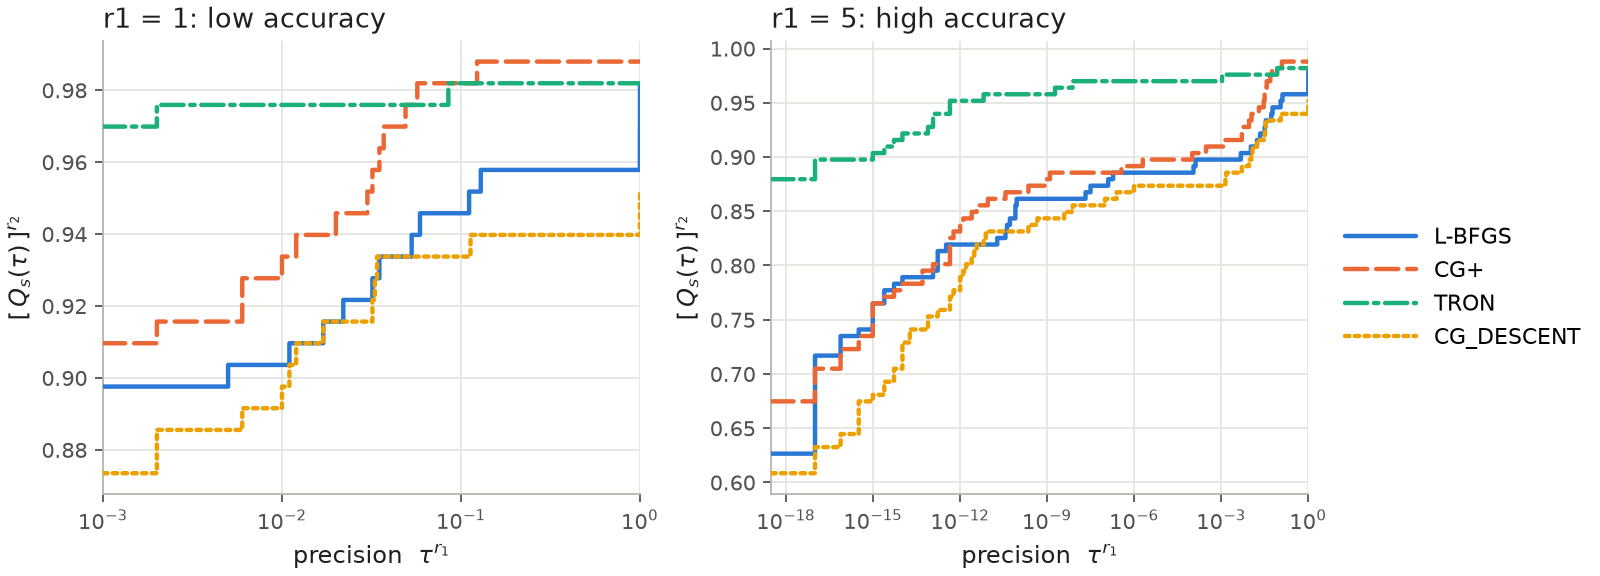
Four solvers on 166 CUTEst problems (Figures 4 and 5 of the paper). With r1 = 5
the plot reaches 18 orders of magnitude and shows that TRON stays ahead at high accuracy.
Installation
Quality Profiles is published on PyPI as quality-profiles and imported in Python as
quality_profiles. From PyPI:
pip install quality-profiles                    # NumPy and Matplotlib only
pip install "quality-profiles[science]"         # + SciencePlots styles, for figures in papers
pip install "quality-profiles[interactive]"     # + Plotly, for interactive exploration
pip install "quality-profiles[all]"             # everything
The core package depends only on NumPy and Matplotlib. The extras are kept separate so that a solver's test suite can use quality profiles without pulling in Plotly.
From source (development), with uv:
git clone https://github.com/chripiermarini/QualityProfiles
cd QualityProfiles
uv sync                    # .venv with the package, Plotly, SciencePlots and the dev tools
Requires Python 3.10 or later.
Quality Profiles follows semantic versioning: within version 1.x the public API does not change in incompatible ways. See the changelog.
Quick start
For every test problem p you need the objective value at the common starting point,
f0[p], and the best value found by each solver, f_solvers[p, s]. Use NaN to mark a
failure.
import numpy as np
import matplotlib.pyplot as plt
from quality_profiles import quality_profiles, plot_quality_profiles

f0 = np.array([10.0, 3.0, 50.0, 7.0])           # f(x0) on 4 problems
f_solvers = np.array([                           # 3 solvers
    [1e-8,  2e-3,  0.5],
    [0.0,   1e-6,  1e-12],
    [12.0,  1e-4,  np.nan],                      # nan = failure
    [1e-3,  1e-3,  1e-9],
])

qp = quality_profiles(f0, f_solvers, solver_names=["A", "B", "C"], r1=4)

plot_quality_profiles(qp)      # semilog plot of [Q_s(tau^r1)]^r2
plt.show()

qp.evaluate([1e-1, 1e-3, 1e-6])  # fraction solved to 1, 3 and 6 orders of magnitude
qp.ranking()                     # solvers sorted by area under the profile
For a figure in a paper, or for interactive exploration:
ax = plot_quality_profiles(qp, style=["science", "ieee"])  # needs the [science] extra
ax.figure.savefig("profiles.pdf")

from quality_profiles import plot_quality_profiles_interactive
fig = plot_quality_profiles_interactive(qp)                # needs the [interactive] extra
fig.show()                                                 # zoom, hover, hide solvers
fig.write_html("profiles.html")
The notebook notebooks/quality_profiles_example.ipynb
walks through the paper's examples on the published results.
Plot styles
The same profiles (Figure 5 of the paper) in the three ways the package can draw them.
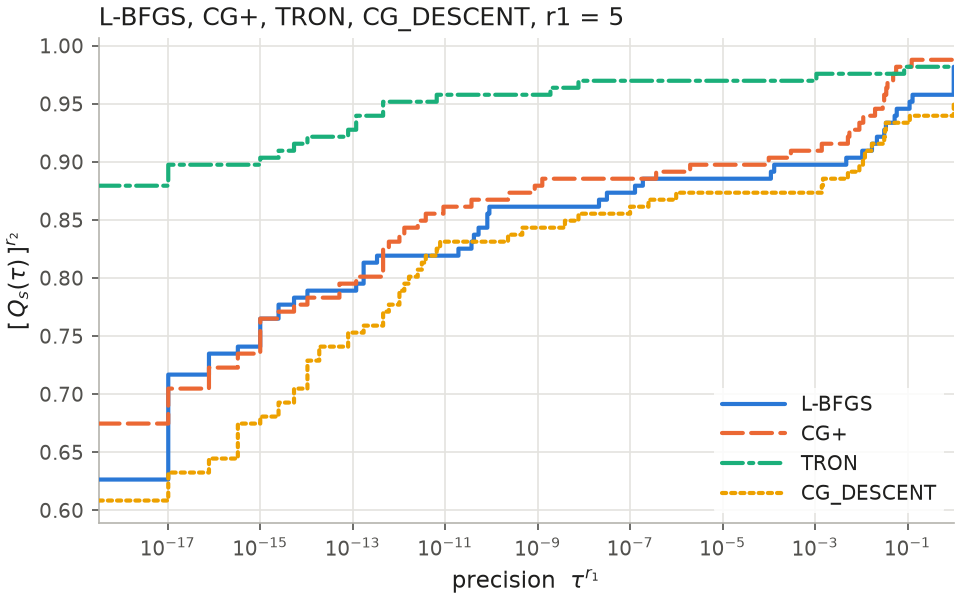 Default plot_quality_profiles(qp)
|
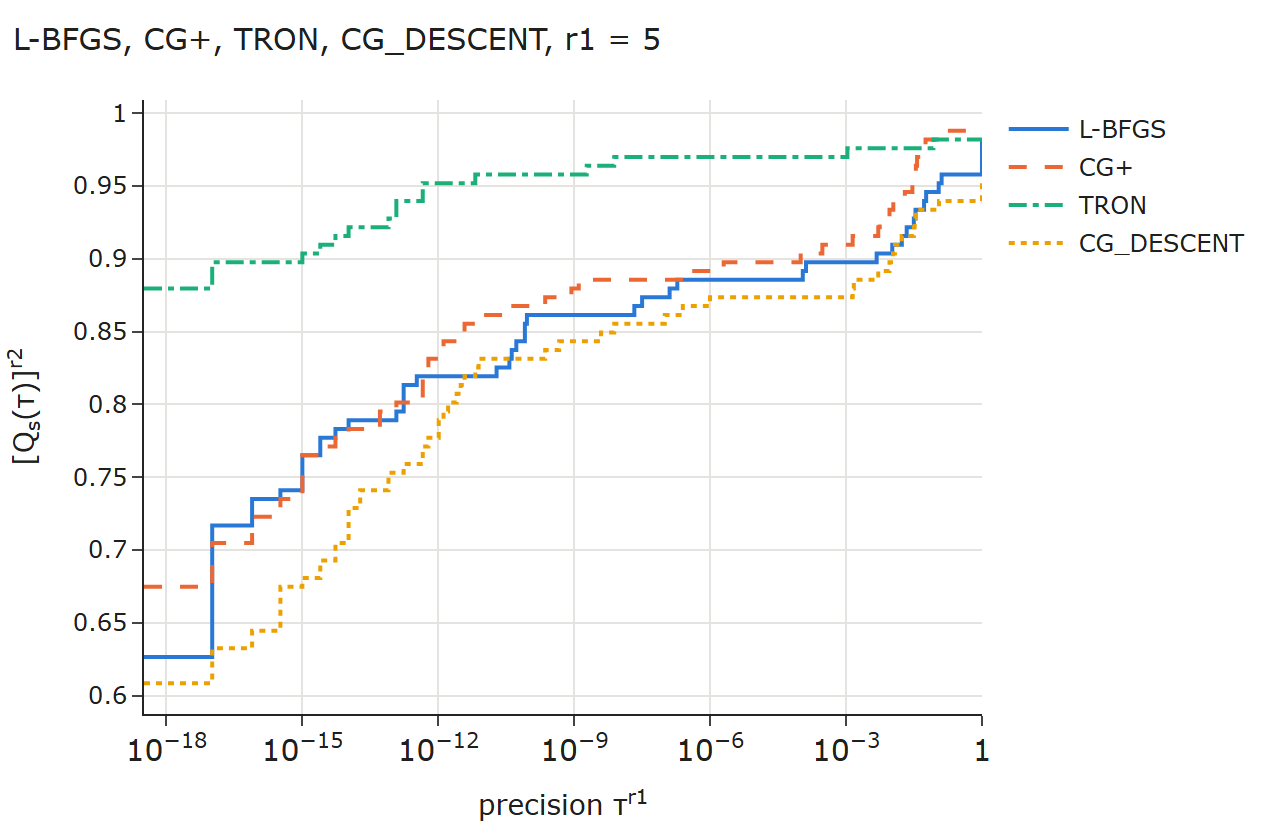 Interactive (Plotly) plot_quality_profiles_interactive(qp)
|
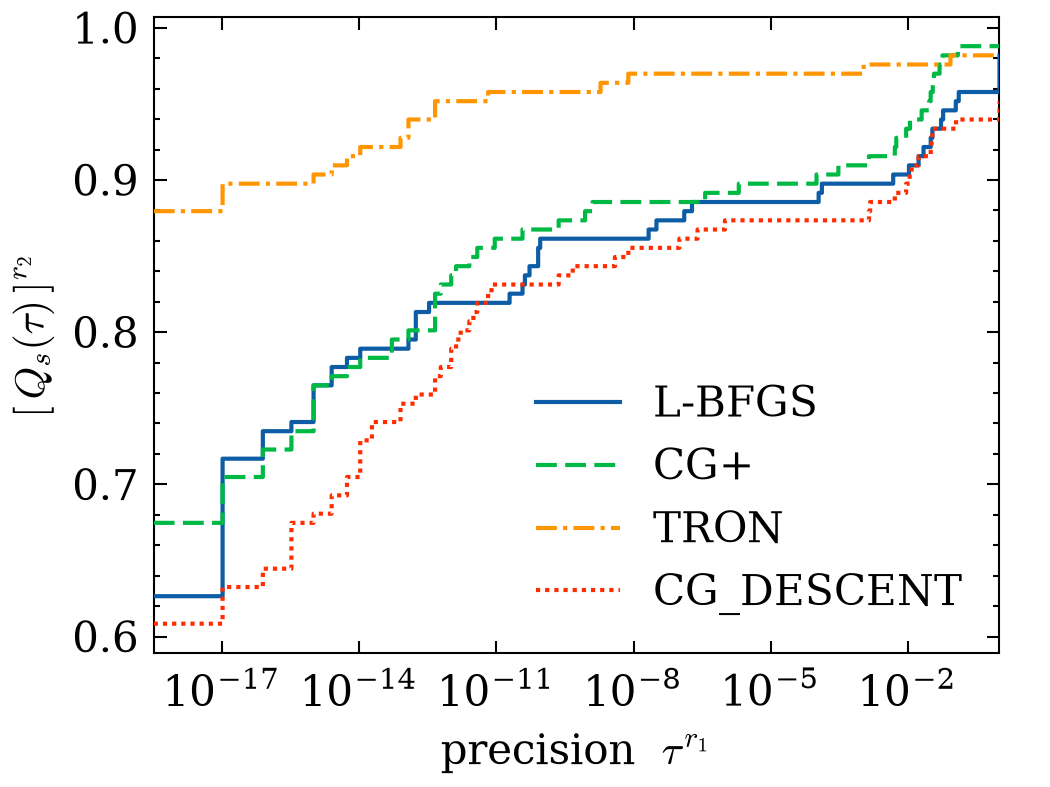 SciencePlots, one journal column plot_quality_profiles(qp, style="science")
|
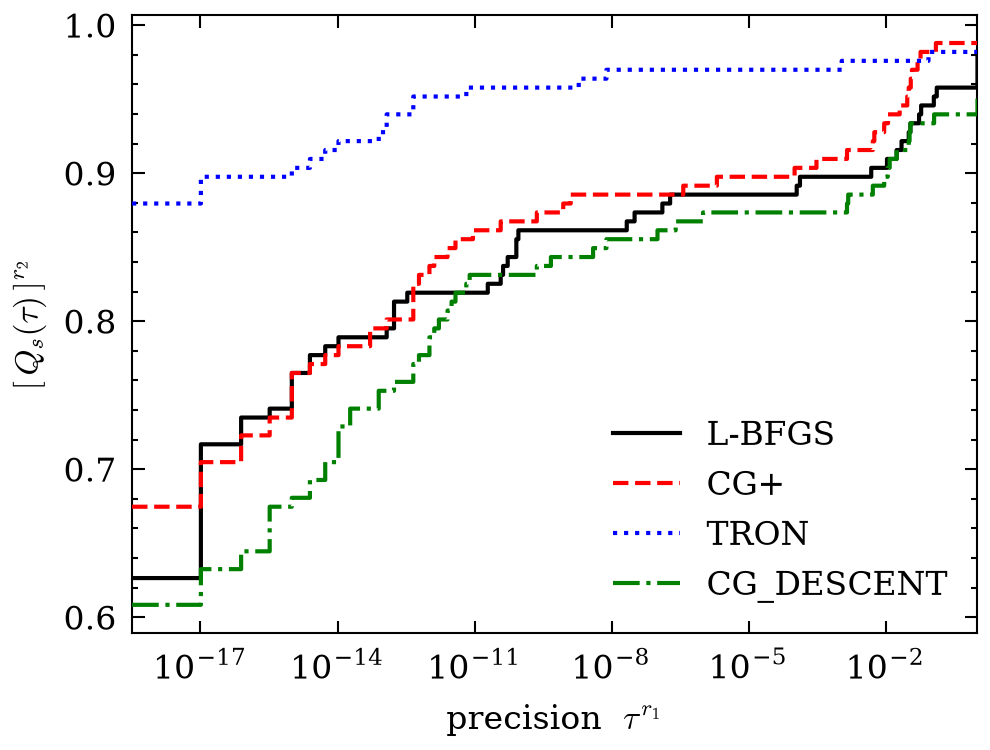 SciencePlots + IEEE, works in black and white style=["science", "ieee"]
|
The matplotlib figures can be saved as PDF, SVG or PNG; for a paper, prefer PDF. The
Plotly figure is saved as an interactive HTML page with fig.write_html(...).
Interactive figures
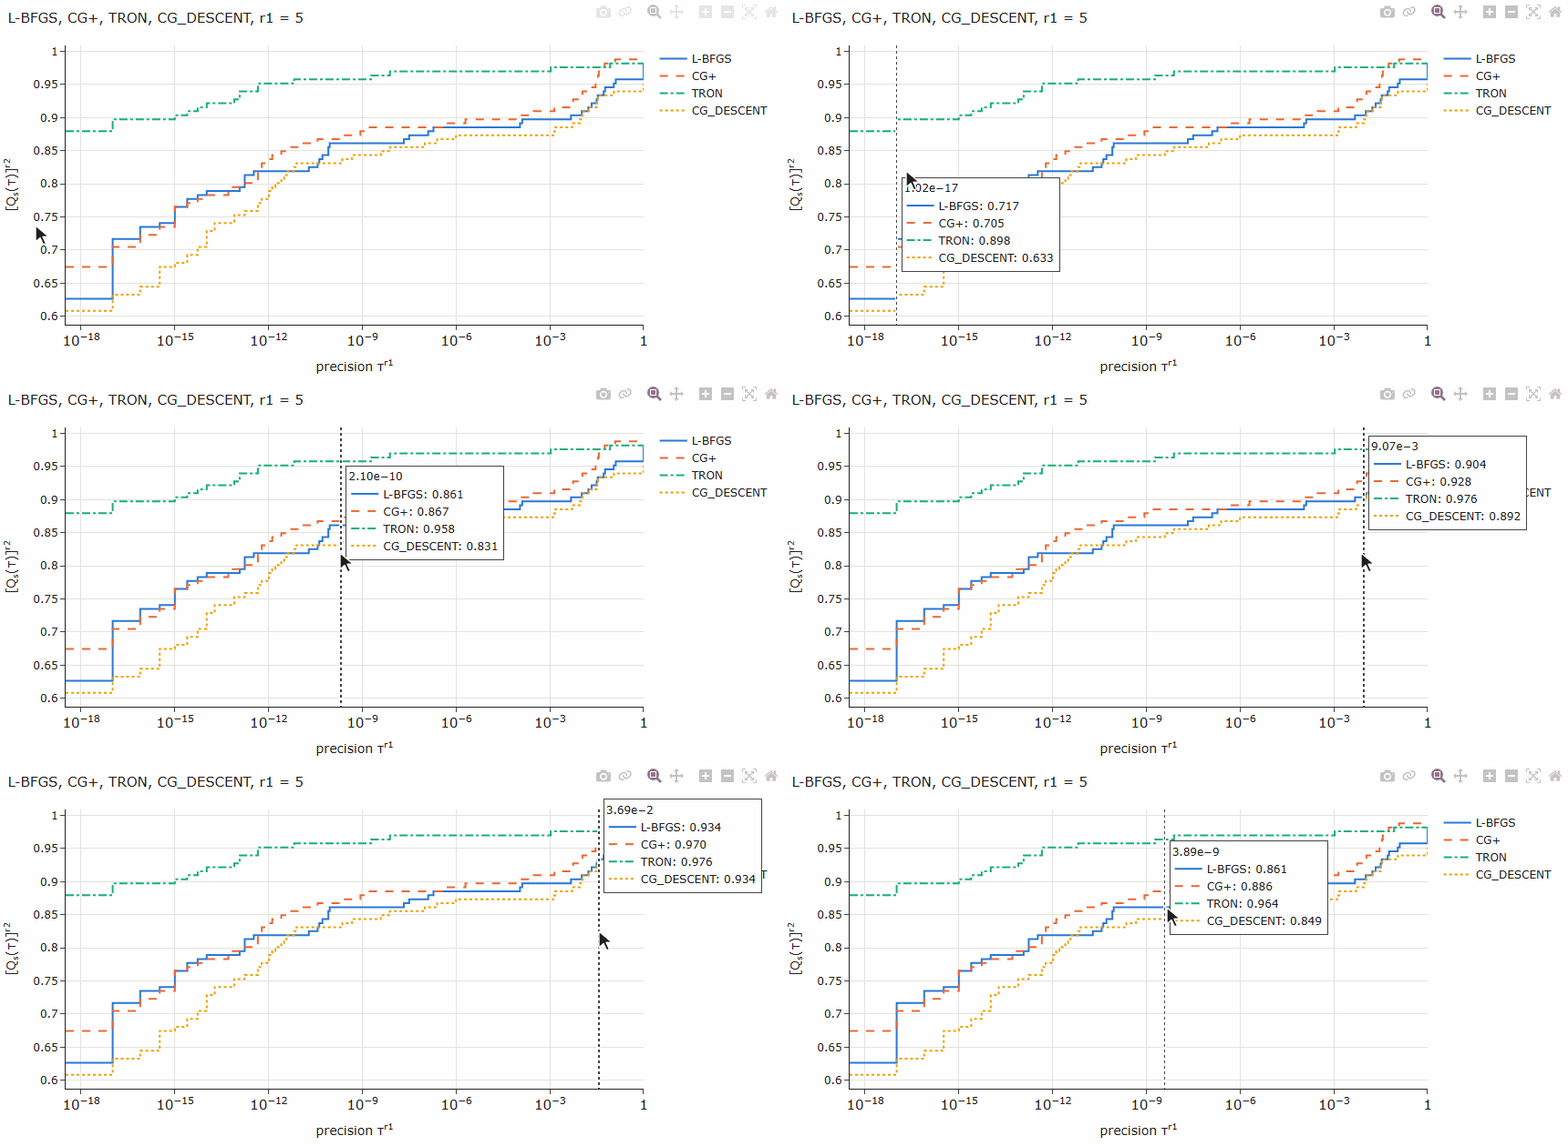
Hovering shows the value of every solver at the precision level under the cursor:
With many solvers, click a name in the legend to hide it, and drag a box to zoom; a double-click goes back to the full view. Here, on the seven derivative-free solvers of Figure 12:
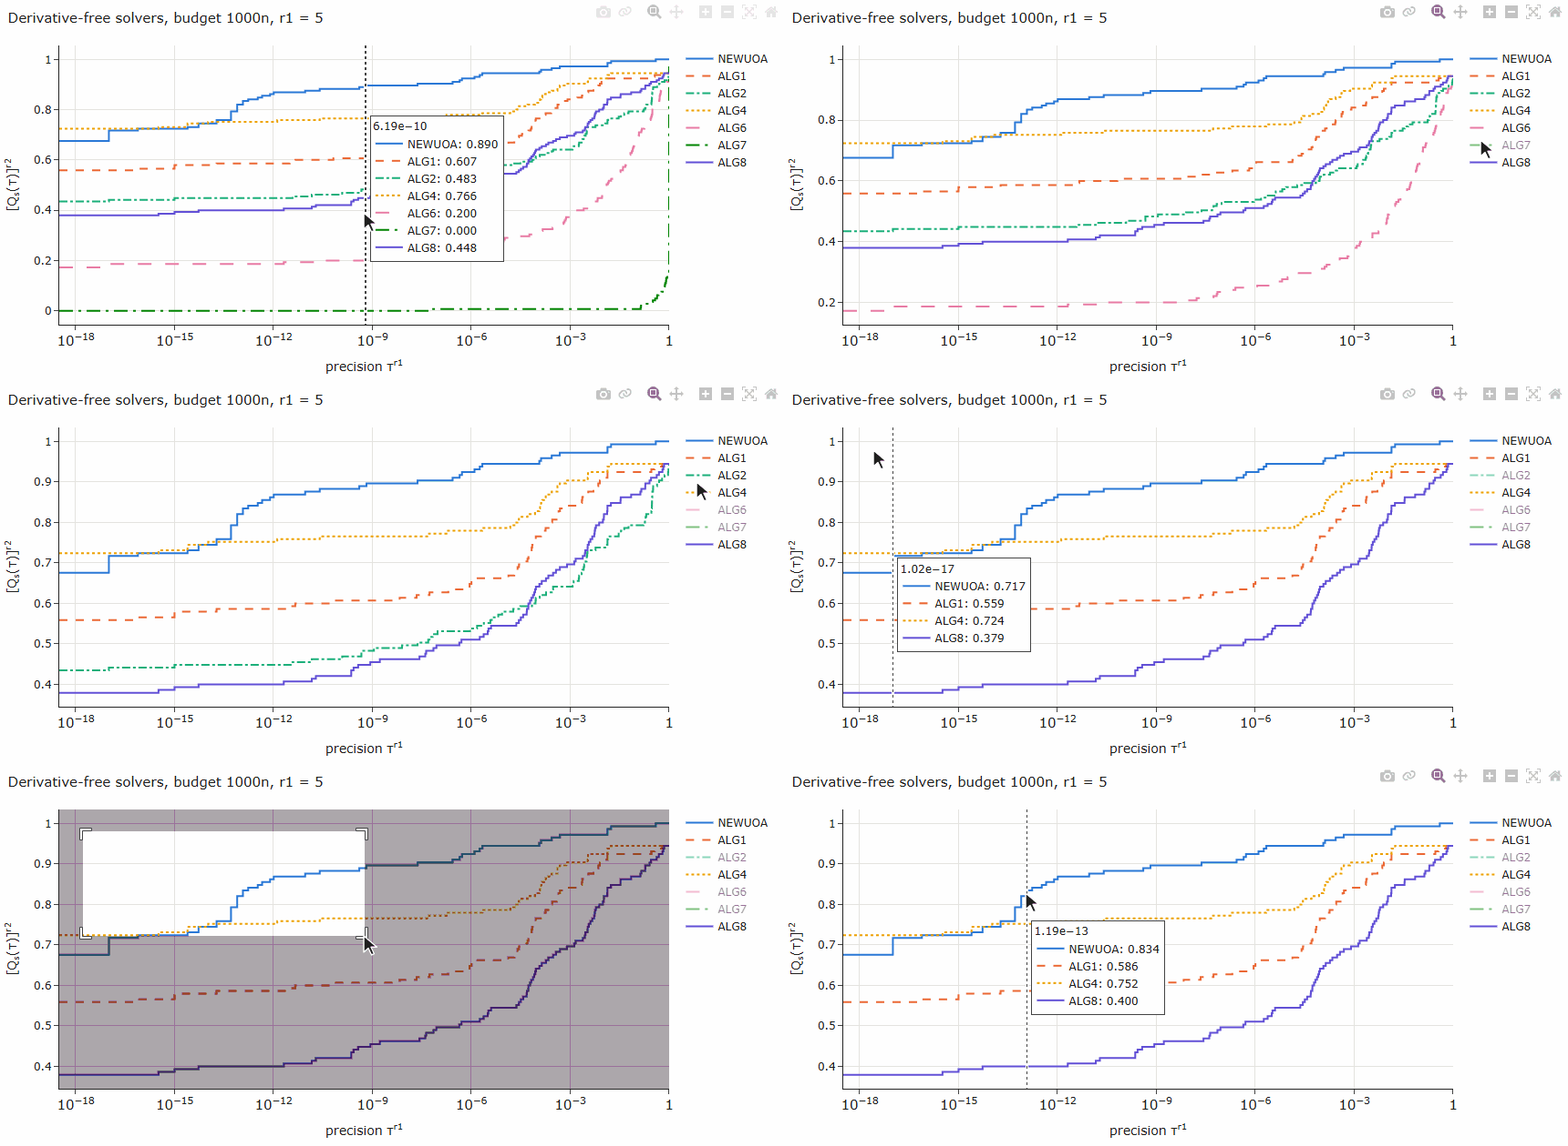
The gallery is drawn by examples/utils/make_readme_gallery.py.
What is computed
Solvers that start from the same point can end in different local minima. Counting iterations or function evaluations does not show which one found the better solution; quality profiles do.
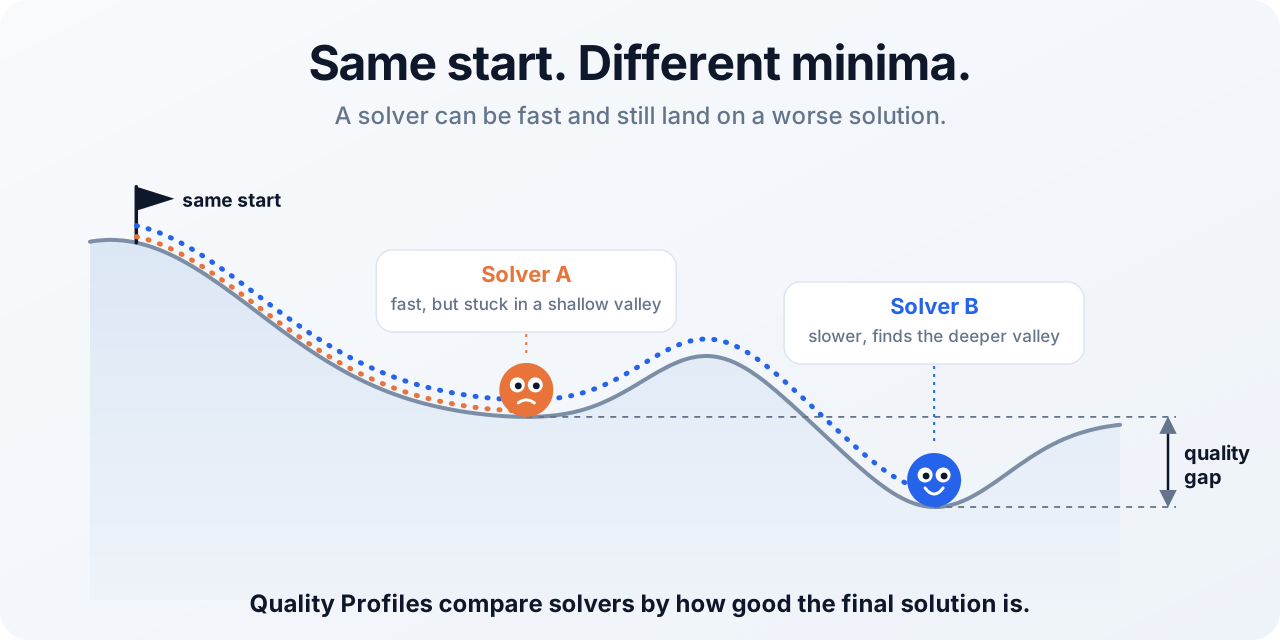
For every solver s and precision level τ ∈ [0, 1], the quality profile
Qs(τ) is the fraction of test problems on which s reduced the gap between
the starting value f(x0) and a reference value fL (by default the
best value found by any solver) by at least a factor τ. The package computes the scaled
profiles [Qs(τr1)]r2: r1 zooms the abscissa, r2 the
ordinate, and neither changes the ranking of the solvers.
All the package needs is one final value per problem and solver, plus the value at the common starting point:
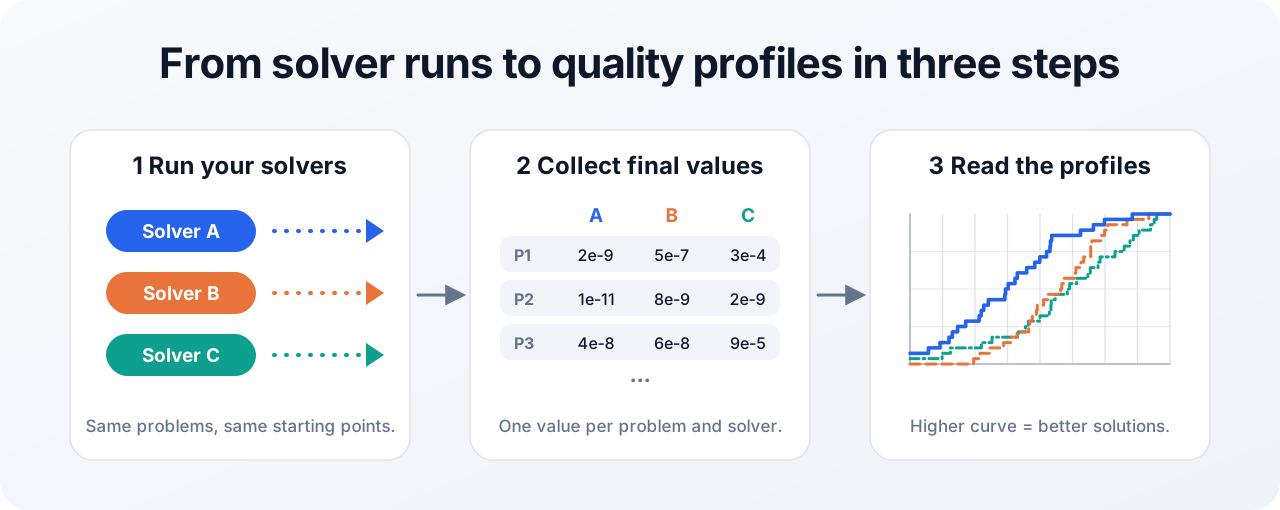
On a semilog plot, the value at precision 10−k is the fraction of problems on which a solver gained at least k orders of magnitude; the higher the curve, the better.
The definitions, weak and strong profiles, the choice of reference value, the scaling, the properties proved in the paper and the handling of failures are described in docs/what-is-computed.md.
API
Every parameter, return value and error is documented in docs/api.md.
The paper's experiments
examples/data contains the results published with the paper, one CSV
file per experiment: the CUTEst problem and its dimension n, the starting value f0,
then one column per solver. examples/utils/paper_data.py loads
them, also restricted to one problem dimension, e.g. load("cutest_smooth", n=10000).
Datasets
| File | Problems | Solvers | Paper figures |
|---|---|---|---|
cutest_smooth.csv |
166 | L-BFGS, CG+, TRON, CG_DESCENT | 4–8 |
negative_curvature.csv |
166 | TN-NONegCurv, TN-NC1, TN-NC2, TN-NC3 | 9–11 |
dfo_budget_1000n.csv |
145 | NEWUOA and six Direct Search methods | 12 |
dfo_budget_750n.csv |
145 | same | 13 |
dfo_budget_500n.csv |
145 | same | 14 |
dfo_budget_250n.csv |
145 | same | 15 |
Where the data come from, one correction made to the MATLAB files, and two known issues
in the original data are described in examples/data/README.md.
uv run python examples/reproduce_paper_figures.py    # redraw the paper's figures
uv run python examples/compare_plot_styles.py        # one figure in every plot style
uv run python examples/try_plot_styles.py --help     # SciencePlots and Plotly on every dataset
Development
uv sync                          # environment with Plotly, SciencePlots and the dev tools
uv run pytest                    # unit tests and doctests
uv run pytest --nbmake notebooks # execute the example notebook
uv run ruff check . && uv run ruff format --check .
uv run mypy                      # strict type checking
uv build                         # build the sdist and the wheel into dist/
The tests check every result against a line-by-line port of the MATLAB algorithm, and check the properties proved in the paper.
Authors
Quality Profiles is developed and maintained by Christian Piermarini (Sapienza University of Rome).
Collaborators: Giovanni Fasano (Ca' Foscari University of Venice) and Massimo Roma (Sapienza University of Rome), co-authors of the paper that introduces the method.
Citation
If you use this package, please cite the paper (see CITATION.cff):
@article{FasanoPiermariniRoma2026QualityProfiles,
  title   = {Benchmarking Optimization Algorithms with Quality Profiles and Test Set Profiles},
  author  = {Fasano, Giovanni and Piermarini, Christian and Roma, Massimo},
  journal = {Mathematical Programming Computation},
  note    = {Accepted. arXiv:2607.16798},
  doi     = {10.48550/arXiv.2607.16798},
  year    = {2026}
}
Questions and contributions
Questions and contributions are very welcome. Feel free to open an issue for any question, bug report or idea, or to send a pull request following the guidelines for contributing.
License
MIT. See LICENSE.
1 maintainer

Metadata
1 maintainer
Release files for quality-profiles 1.0.0
For a detailed explanation of source distributions (sdists) and built distributions (wheels), please see the package formats documentation.
Source distribution (sdist)
| File | Size | Uploaded | Provenance | Actions |
|---|---|---|---|---|
| quality_profiles-1.0.0.tar.gz | 1.6 MB | With provenance | Details for quality_profiles-1.0.0.tar.gz |
Built distribution (wheel)
| File | Interpreter | ABI | Platform | Actions Reset |
|---|---|---|---|---|
| quality_profiles-1.0.0-py3-none-any.whl | Python 3 | none | any | Details for quality_profiles-1.0.0-py3-none-any.whl |
Total release size: 1.6 MB
Release files / quality_profiles-1.0.0.tar.gz
| Download URL | quality_profiles-1.0.0.tar.gz |
|---|---|
| Size | 1.6 MB |
| Tags | Source |
|
SHA-256 checksum How to use checksums |
56edd4e080441f5a5c22cf5781fb26cc38dce0ff9c57ebfca32d68abd0252d98
|
|
BLAKE2b-256 checksum How to use checksums |
1f5dd24406fd16ee34f750703829cdfa8027de6b3a70b8851799aa2ab22012eb
|
| Upload date | |
|
Uploaded using Trusted Publishing? What is trusted publishing? |
Yes |
| Uploaded via |
twine/7.0.0 CPython/3.13.16
|
Provenance
Provenance describes where a file came from. On PyPI, provenance is shared via attestations, which provide a verifiable record of the build or publishing details. View details, limitations and caveats.


PyPI Publish Attestation
PyPI verified that this artifact, at this checksum, originated from the publisher listed below.
Signed by GitHub Actions, verified by PyPI on Nov 19, 2026.
Transparency logRelease files / quality_profiles-1.0.0-py3-none-any.whl
| Download URL | quality_profiles-1.0.0-py3-none-any.whl |
|---|---|
| Size | 24.5 kB |
| Tags | Python 3 |
|
SHA-256 checksum How to use checksums |
8ba49c58d60aa3bb12ec8e9be0105b9c90ebe744c75cf2dc7b932fc025ccf215
|
|
BLAKE2b-256 checksum How to use checksums |
12bd7b389400a40fc84c8d24bc6659acabf6d01272514772906daf6fe7f2ab4e
|
| Upload date | |
|
Uploaded using Trusted Publishing? What is trusted publishing? |
Yes |
| Uploaded via |
twine/7.0.0 CPython/3.13.16
|
Provenance
Provenance describes where a file came from. On PyPI, provenance is shared via attestations, which provide a verifiable record of the build or publishing details. View details, limitations and caveats.
PyPI Publish Attestation
PyPI verified that this artifact, at this checksum, originated from the publisher listed below.
Signed by GitHub Actions, verified by PyPI on Nov 19, 2026.
Transparency logSecurity for quality-profiles 1.0.0
Provenance
Provenance describes where a file came from. On PyPI, provenance is shared via attestations, which provide a verifiable record of the build or publishing details. View details, limitations and caveats.
Full provenance
Both files in this release have been uploaded with provenance metadata.
Attestation for quality_profiles-1.0.0.tar.gz
PyPI Publish Attestation
PyPI verified that this artifact, at this checksum, originated from the publisher listed below.
Signed by GitHub Actions, verified by PyPI on Nov 19, 2026.
Transparency logA note on package security
PyPI is a repository for distributing packages, not a service for auditing them. While third-party security researchers and our staff do their best to detect and remove malicious packages, PyPI cannot guarantee the quality, security or suitability of any given package.
To learn more about protecting yourself from malicious actors, visit our package security documentation.













