
Triangular heatmap for visualizing quantile-based distributions and signed effects across a 2D velocity–acceleration space with multi-dimensional angle encoding.

Project description
quantile-cube
A Python package for visualizing the distribution of 3D movement data — velocity, acceleration, and angle — collapsed into a 2D heatmap.
Movement observations are binned into quantiles along three dimensions: velocity (x-axis), acceleration (y-axis), and angle of movement (the four triangles within each cell).
Color intensity reflects the value associated with each bin, which may represent:
- relative density (proportion of observations),
- signed effect size (positive or negative values),
- or normalized magnitude depending on the input data.
This enables comparison of movement structure across velocity, acceleration, and angle dimensions under multiple statistical interpretations.
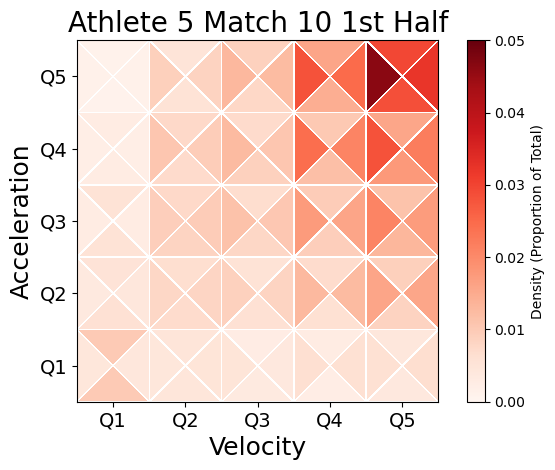
Table of Contents
Installation
Install from PyPI (no repo cloning needed):
pip install quantile-cube
Requirements: Python 3.9+, NumPy ≥ 1.21, Matplotlib ≥ 3.5, Pandas ≥ 1.3
If you'd like to explore the source, run examples, or contribute:
git clone https://github.com/kelanethomas/quantile-cube.git
cd quantile-cube
pip install -e .
Quick Start
Option 1 — Raw arrays
from quantile_cube import plot_cube
import numpy as np

q1 = np.random.rand(25)
q2 = np.random.rand(25)
q3 = np.random.rand(25)
q4 = np.random.rand(25)

plot_cube(
    values=[q1, q2, q3, q4],
    M=5,
    N=5,
    title="My Quantile Cube",
    colorbar_label="Value",
    cmap="Blues",
)
Option 2 — DataFrame (recommended)
If your data is in a DataFrame with columns named like Q1_vel_Q1_acc_Q1_angle:
from quantile_cube import plot_cube

plot_cube(
    cube_data=df,
    M=5,
    N=5,
    title="Game 5 Quantile Cube",
)
Note: If your data contains both positive and negative values, a diverging colormap such as "RdBu_r" is recommended for correct visual interpretation.
Parameters
| Parameter | Type | Default | Description |
|---|---|---|---|
values |
list of 4 arrays | None |
One array per quantile, each of length M×N |
cube_data |
DataFrame | None |
Single-row DataFrame with columns Q{vel}_vel_Q{acc}_acc_Q{angle}_angle |
M |
int | 5 |
Number of columns |
N |
int | 5 |
Number of rows |
minimum |
float | data min rounded down to nearest 0.01 | Colormap lower bound |
maximum |
float | data max rounded up to nearest 0.01 | Colormap upper bound |
cmap |
str or Colormap | "Reds" (sequential data) / "RdBu_r" (diverging data with negative + positive values) |
Matplotlib colormap |
title |
str | "Quantile Cube" |
Plot title and default save filename |
colorbar_label |
str | "" |
Colorbar label |
colorbar_ticks |
list[float] | Matplotlib default | Colorbar tick labels |
xlabel |
str | "Velocity" |
X-axis label |
ylabel |
str | "Acceleration" |
Y-axis label |
quantile_labels |
list of 4 str | ["Angle Q1","Angle Q2","Angle Q3","Angle Q4"] |
Triangle labels |
show_quantile_labels |
bool | False |
Show label-only summary view |
show_values |
bool | False |
Print numeric value at center of each triangle |
value_fmt |
str | ".4f" |
Format string for numeric labels when show_values=True |
grey_nonsignificant |
bool | False |
Render NaN values in grey |
save |
bool | False |
Save figure to file |
save_path |
str | "<title>.png" |
Custom save path |
show |
bool | True |
Call plt.show() |
figsize |
tuple | (7, 7) |
Figure size in inches |
Advanced Usage
Custom axis labels
plot_cube(
    values=[q1, q2, q3, q4],
    xlabel="Speed Bins",
    ylabel="Acceleration Bins",
)
Custom quantile labels
plot_cube(
    values=[q1, q2, q3, q4],
    quantile_labels=["Low", "Mid-Low", "Mid-High", "High"],
    show_quantile_labels=True,
)
Custom colorbar ticks
plot_cube(
    values=[q1, q2, q3, q4],
    colorbar_ticks=[-0.2, -0.1, 0, 0.1, 0.2],
    colorbar_label="Effect Size"
)
Handling non-significant values
import numpy as np

q1_with_nans = np.where(pvalues > 0.05, np.nan, q1)

plot_cube(
    values=[q1_with_nans, q2, q3, q4],
    grey_nonsignificant=True,
)
Saving figures
plot_cube(
    values=[q1, q2, q3, q4],
    title="my_plot",
    save=True,
    save_path="outputs/my_plot.png",
    show=False,
)
How It Works
Each cell in the grid corresponds to a (velocity, acceleration) quantile bin. Within each cell, four triangles represent four angle quantiles, encoding directional movement.
Color intensity reflects the value associated with each bin, typically representing relative density or normalized magnitude of observations within that velocity–acceleration–angle combination. This allows comparison of movement structure across all three dimensions simultaneously.
When data includes both positive and negative values, a diverging colormap centered at 0 is used to distinguish directionality (e.g., above/below baseline behavior). Missing or non-significant values (NaNs) can optionally be rendered in grey to indicate suppressed or unreliable estimates.
Tip: In density-based mode, values across all triangles sum to 1.0, meaning the colormap reflects relative time spent. In signed or effect-size mode, values represent magnitude and direction rather than proportions.
Contributing
Contributions, bug reports, and feature requests are welcome!
- Fork the repo: github.com/kelanethomas/quantile-cube
- Create a branch:
git checkout -b feature/your-feature - Commit your changes and open a pull request
Please open an issue first if you're planning a larger change.
Citation
This package accompanies the following paper:
Thomas, K. & Hannig, J. (2025). Movement Dynamics in Elite Female Soccer Athletes: The Quantile Cube Approach. arXiv preprint arXiv:2503.11815. https://arxiv.org/abs/2503.11815
Accepted at the Journal of Quantitative Analysis in Sports — full publication coming soon.
@misc{thomas2025quantilecube_paper,
  author = {Thomas, Kendall and Hannig, Jan},
  title  = {Movement Dynamics in Elite Female Soccer Athletes: The Quantile Cube Approach},
  year   = {2025},
  eprint = {2503.11815},
  archivePrefix = {arXiv},
  url    = {https://arxiv.org/abs/2503.11815},
}
To also cite the software package:
@software{thomas2026quantilecube_pkg,
  author  = {Thomas, Kendall},
  title   = {quantile-cube: 3D Movement Distribution Visualization},
  year    = {2026},
  url     = {https://github.com/kelanethomas/quantile-cube},
  version = {0.1.3},
}
License
MIT


Download files
Download the file for your platform. If you're not sure which to choose, learn more about installing packages.
Source Distribution
Built Distribution
Filter files by name, interpreter, ABI, and platform.
If you're not sure about the file name format, learn more about wheel file names.
Copy a direct link to the current filters
File details
Details for the file quantile_cube-0.1.3.tar.gz.
File metadata
- Download URL: quantile_cube-0.1.3.tar.gz
- Upload date:
- Size: 48.7 kB
- Tags: Source
- Uploaded using Trusted Publishing? No
- Uploaded via: twine/6.2.0 CPython/3.12.5
File hashes
| Algorithm | Hash digest | |
|---|---|---|
| SHA256 |
0e14b01e1218d9096acb34add40d4cf51cbb3fb8c6b29a415824d400f24d30f2
|
|
| MD5 |
fc6f8855de35495fdb969f96f9bffa11
|
|
| BLAKE2b-256 |
cd0832380c13eb73b23e9709319450c203d2f061a2742afb5da416847726795c
|
File details
Details for the file quantile_cube-0.1.3-py3-none-any.whl.
File metadata
- Download URL: quantile_cube-0.1.3-py3-none-any.whl
- Upload date:
- Size: 10.5 kB
- Tags: Python 3
- Uploaded using Trusted Publishing? No
- Uploaded via: twine/6.2.0 CPython/3.12.5
File hashes
| Algorithm | Hash digest | |
|---|---|---|
| SHA256 |
75cde802f7819ee182bbf48c0907cf7d66abeb516a092084fb55c24f0d8dfd32
|
|
| MD5 |
0aa97f11ae191c4c67123c78511dcbc0
|
|
| BLAKE2b-256 |
da13ba7fa07bdbbdea47d3e1fc7247a41acf6341ca74468637be2121bf65478c
|






