
QuantileMix
Quantile g-computation transforms exposures into ordinal quantile scores and estimates the joint effect of increasing all exposures simultaneously by one quantile. The package supports selected models for continuous, binary, count, and survival outcomes, with more limited support for censored, multicategory, and zero-inflated outcomes. Each API entry documents the effect scale, required inputs, and methodological limitations.
Quantile cutpoints estimated during model fitting are reused for prediction. Sign-specific weights summarize fitted exposure coefficients rather than causal importance. Successful model fitting does not establish the validity of model assumptions or identify a causal effect without additional causal identification assumptions.
The method follows Keil et al. (2020). Selected calculations were checked against Alexander Keil's R qgcomp. This is an unofficial Python package; the original authors have not endorsed it.
Install
Install from PyPI:
pip install quantilemix
Or install the latest source from GitHub with Git installed:
python -m pip install "git+https://github.com/nilson01/quantilemix.git@main"
Or run this in a local checkout containing pyproject.toml:
python -m pip install .
Use quantilemix for installation and imports.
NumPy and SciPy install as dependencies. For an isolated Python environment,
see the Python Packaging User Guide.
First example
These two exposures already have scores 0–3. q=None tells fit to use those
scores directly. Omit it when the columns contain raw measurements; the
default groups each exposure into four quantiles.
import numpy as np
from quantilemix import fit

x1, x2 = np.meshgrid(np.arange(4), np.arange(4))
X = np.column_stack([x1.ravel(), x2.ravel()])
y = 1 + 2*X[:, 0] - 0.5*X[:, 1] + 0.2*(X[:, 0] - 1.5)*(X[:, 1] - 1.5)

result = fit(y, X, q=None)
print(result.summary())
print(result.psi, result.se, result.ci)
predicted_means = result.predict(X)
Joint-effect row from result.summary() (excerpt):
Term  Estimate  SE         CI lower  CI upper  t        p-value
psi   1.5       0.0877058  1.3281    1.6719    17.1026  2.70924e-10
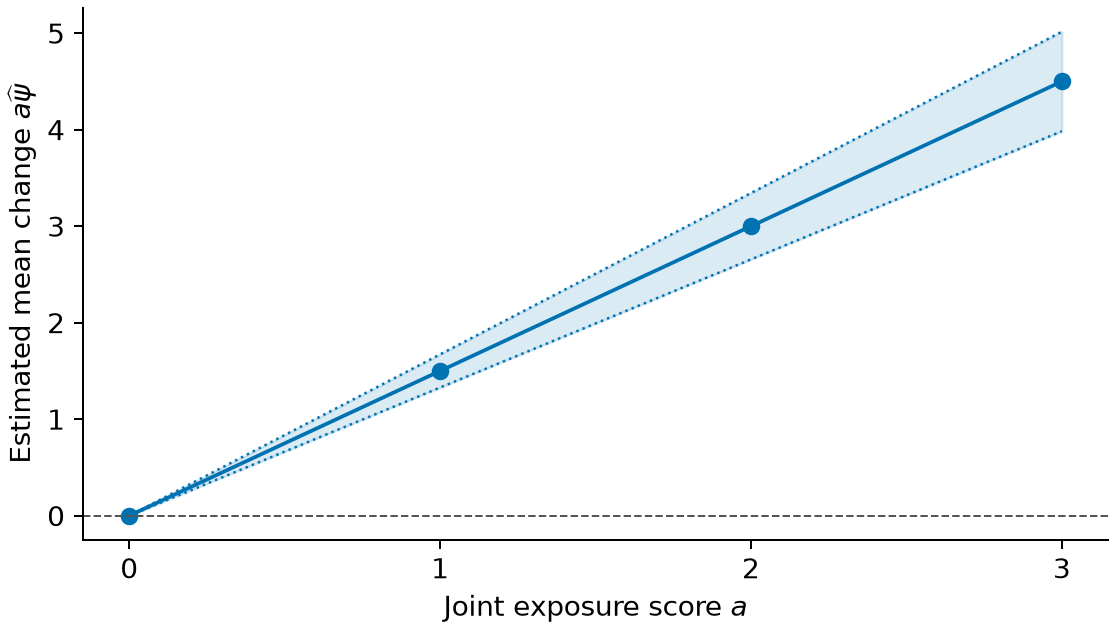
The plot shows a * result.psi against the common exposure score a,
relative to all scores set to zero. Shading is a pointwise 95% normal
confidence interval for the mean contrast, not an individual prediction interval.
Plot code.
Here psi is the fitted change in the mean outcome when both exposure
scores rise by one category. The two exposure coefficients are 2 and −0.5,
so their sum is 1.5. se is its standard error, and ci contains the
confidence limits. These are changes in scores, not in the original
measurement units. A causal interpretation needs assumptions about the
study that the package cannot check.
Choose a method
| Analysis | Main functions | Effect or output |
|---|---|---|
| Continuous outcome | fit, fit_formula |
Conditional joint mean difference; accepts positive case weights |
| Binary outcome | fit_binomial, fit_binomial_risk_ratio, fit_binomial_odds_ratio |
Conditional log odds or separate population-average ratios; check each function's scale |
| Count outcome | fit_poisson, fit_poisson_bootstrap |
Conditional mean or rate ratio, or a population-average count ratio; observation times are supported where documented |
| Resampling and clustered data | fit_bootstrap, fit_gaussian_ee, fit_binomial_ee, fit_poisson_ee |
Method-specific uncertainty for independent rows or identified clusters |
| Other outcomes | fit_cox, fit_tobit, fit_multinomial, zero-inflated and hurdle fitters |
Restricted survival, censored, multicategory and two-part count models |
| Results and figures | result.summary(), plot_weights, plot_response |
Saved estimates, diagnostics and selected displays |
The reference manual gives signatures, examples and limits for every supported function. The coverage map distinguishes implemented methods from open features.
For named data, fit_formula accepts additive terms such as
y ~ x1 + x2 + C(group). C(group) encodes a text adjustment category.
Use missing="drop" only when you want incomplete training rows removed;
the default rejects them. Array inputs require complete numeric values.
Fitted exposure boundaries and category levels are reused for prediction.
Case weights give training rows different influence in supported fits. They are different from the positive and negative sign weights in a result: sign weights describe fitted exposure coefficients, not causal importance. Neither kind of weight automatically accounts for a complex survey design.
Evidence and limits
The validation record links fixed comparisons and repeated-dataset studies. The checks apply to their stated inputs and models:
| Method | Evidence | Limit to keep in mind |
|---|---|---|
| Additive Gaussian | Nine installed-R cases and a 24,000-dataset known-score study | The study did not cover estimated cutpoints or every model assumption. |
| Gaussian row bootstrap | Fixed R comparisons and a 24,000-dataset study | Three study cells had pointwise coverage intervals below 95%. |
| Binary and count models | Method-specific reports | Some settings still lack repeated-dataset checks; sparse-count Poisson results suggest possible undercoverage. |
| Other families | Coverage map | Several marginal methods still need installed-R or repeated-dataset checks. |
The confidence intervals describe uncertainty under each fitted model and study design. Software agreement with R does not establish general interval coverage or a causal effect.
Further information
- Short tutorials and common questions
- Markdown manual and reference PDF
- Method and numerical conventions
- Contributing and development checks
- Attribution and GPL-2.0-or-later license
Citation
Chapagain, N. QuantileMix: quantile g-computation in Python [Computer software]. https://github.com/nilson01/quantilemix
@software{chapagain_quantilemix,
  author = {Chapagain, Nilson},
  title = {QuantileMix: quantile g-computation in Python},
  url = {https://github.com/nilson01/quantilemix}
}
Record the version or commit used and cite the statistical method used in the analysis. Machine-readable metadata is in CITATION.cff.
1 maintainer

Metadata
1 maintainer
Release files for quantilemix 0.1.1
For a detailed explanation of source distributions (sdists) and built distributions (wheels), please see the package formats documentation.
Source distribution (sdist)
| File | Size | Uploaded | Provenance | |
|---|---|---|---|---|
| quantilemix-0.1.1.tar.gz | 2.1 MB | With provenance | Details |
Built distribution (wheel)
| File | Interpreter | ABI | Platform | Reset |
|---|---|---|---|---|
| quantilemix-0.1.1-py3-none-any.whl | Python 3 | none | any | Details |
Total release size: 2.2 MB
Release files / quantilemix-0.1.1.tar.gz
| Download URL | quantilemix-0.1.1.tar.gz |
|---|---|
| Size | 2.1 MB |
| Tags | Source |
|
SHA-256 checksum How to use checksums |
7b9fb7abc6f4bb95dbafcbdbb4301afe82c29f2aa0dac7ced8dc7c65f21f9910
|
|
BLAKE2b-256 checksum How to use checksums |
0c51e53f77e60d6acd1a355d7699830dd6280ec9e35d4da3d5760659eb580043
|
| Upload date | |
|
Uploaded using Trusted Publishing? What is trusted publishing? |
Yes |
| Uploaded via |
twine/7.0.0 CPython/3.13.16
|
Provenance
Provenance describes where a file came from. On PyPI, provenance is shared via attestations, which provide a verifiable record of the build or publishing details. View details, limitations and caveats.


PyPI Publish Attestation
PyPI verified that this artifact, at this checksum, originated from the publisher listed below.
Signed by GitHub Actions, verified by PyPI on Oct 25, 2026.
Transparency logRelease files / quantilemix-0.1.1-py3-none-any.whl
| Download URL | quantilemix-0.1.1-py3-none-any.whl |
|---|---|
| Size | 153.1 kB |
| Tags | Python 3 |
|
SHA-256 checksum How to use checksums |
3ddddeb60b1c15baa042b770aa3e9ed2ba9cdd57c05ce1b584c51474b763385d
|
|
BLAKE2b-256 checksum How to use checksums |
e7387bbd86ccc261369d21c16157e385cd051ffb2ffd60961707521b548147e4
|
| Upload date | |
|
Uploaded using Trusted Publishing? What is trusted publishing? |
Yes |
| Uploaded via |
twine/7.0.0 CPython/3.13.16
|
Provenance
Provenance describes where a file came from. On PyPI, provenance is shared via attestations, which provide a verifiable record of the build or publishing details. View details, limitations and caveats.
PyPI Publish Attestation
PyPI verified that this artifact, at this checksum, originated from the publisher listed below.
Signed by GitHub Actions, verified by PyPI on Oct 25, 2026.
Transparency logSecurity for quantilemix 0.1.1
Provenance
Provenance describes where a file came from. On PyPI, provenance is shared via attestations, which provide a verifiable record of the build or publishing details. View details, limitations and caveats.
Full provenance
All 2 files in this release have been uploaded with provenance metadata.
Attestation for quantilemix-0.1.1.tar.gz
PyPI Publish Attestation
PyPI verified that this artifact, at this checksum, originated from the publisher listed below.
Signed by GitHub Actions, verified by PyPI on Oct 25, 2026.
Transparency logA note on package security
PyPI is a repository for distributing packages, not a service for auditing them. While third-party security researchers and our staff do their best to detect and remove malicious packages, PyPI cannot guarantee the quality, security or suitability of any given package.
To learn more about protecting yourself from malicious actors, visit our package security documentation.













