A fat-tail-native quantitative finance toolkit: EVT, risk metrics, and honest modelling for markets that bite.
Verified details
These details have been verified by PyPIProject links
GitHub Statistics
Maintainers

Project description
QuantLite


A fat-tail-native quantitative finance toolkit for Python.
Most quantitative finance libraries bolt fat tails on as an afterthought, if they bother at all. They fit Gaussians, compute VaR with normal assumptions, and hope the tails never bite. The tails always bite.
QuantLite starts from the other end. Every distribution is fat-tailed by default. Every risk metric accounts for extremes. Every backtest ships with an honesty check. The result is a toolkit that models markets as they actually behave, not as textbooks wish they would.
import quantlite as ql

data = ql.fetch(["AAPL", "BTC-USD", "GLD", "TLT"], period="5y")
regimes = ql.detect_regimes(data, n_regimes=3)
weights = ql.construct_portfolio(data, regime_aware=True, regimes=regimes)
result = ql.backtest(data, weights)
ql.tearsheet(result, regimes=regimes, save="portfolio.html")
Five lines. Fetch data, detect market regimes, build a regime-aware portfolio, backtest it, and generate a full tearsheet. That is the Dream API.
Why QuantLite
- Fat tails are the default, not an afterthought. Student-t, Lévy stable, GPD, and GEV distributions are first-class citizens. Gaussian is explicitly opt-in, never implicit.
- Operationalises Taleb, Peters, and Lopez de Prado. Ergodicity economics, antifragility scoring, the Fourth Quadrant map, Deflated Sharpe Ratios, and CSCV overfitting detection are built in, not bolted on.
- Every backtest comes with an honesty check. Bootstrap confidence intervals, multiple-testing corrections, and walk-forward validation ensure you know whether your Sharpe ratio is genuine or a statistical artefact.
- Every chart follows Stephen Few's principles. Maximum data-ink ratio, muted palette, direct labels, no chartjunk. Publication-ready by default.
The QuantLite Score
An open, versioned, verifiable rating for trading track records. Raw Sharpe ratios are trivially gamed: test fifty variants and publish the winner, start the chart at the bottom of a drawdown, sell tail risk and post a 92% win rate. The QuantLite Score rates a track record on the statistics that are hard to game — deflated Sharpe, bootstrap robustness, tail risk, consistency — and flags the classic manipulation patterns.
from quantlite.score import compute_score, verify_artifact

result = compute_score(returns, n_trials=20)
print(result.score, result.grade)          # e.g. 72.4 B

payload = result.artifact.to_json()        # publish or store this
assert verify_artifact(payload, returns)   # anyone can reproduce it bit for bit
Every score ships as a portable artifact with a SHA-256 content hash. Same returns, same parameters, same library version: same score, bit for bit. The methodology (QLS-1.0) is open and frozen per version — see the specification.
Visual Showcase
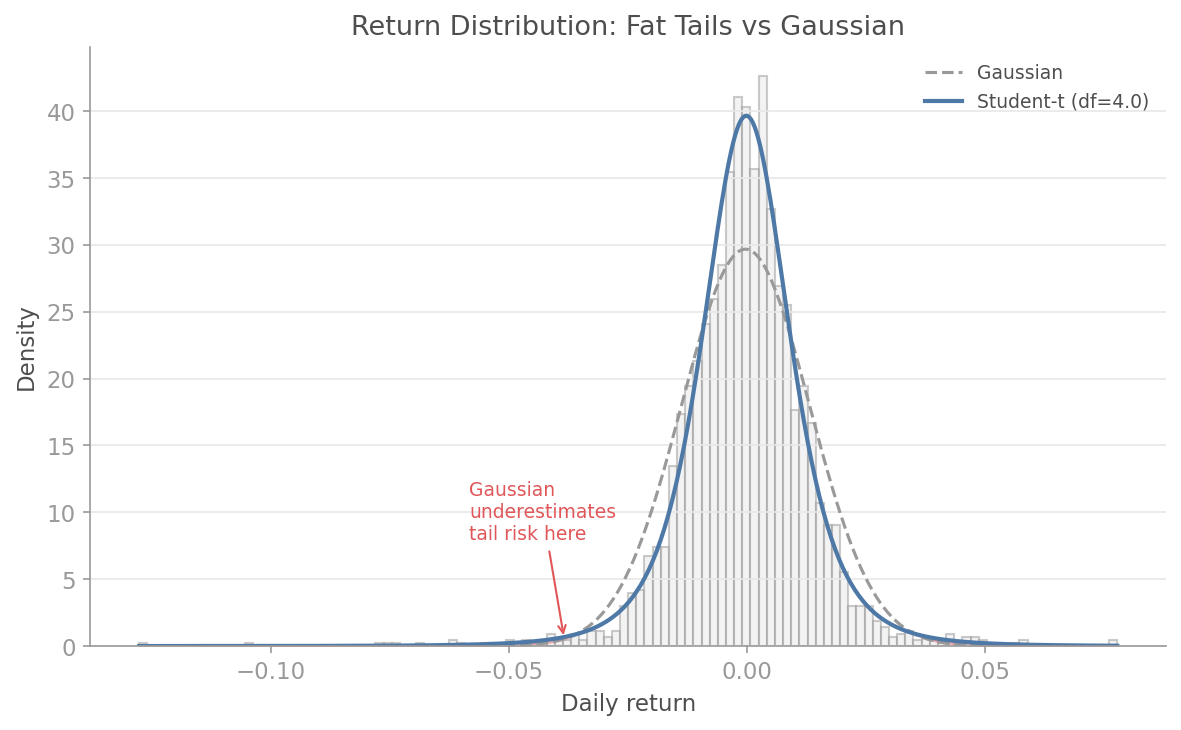
Fat Tails vs Gaussian
Where the Gaussian underestimates tail risk, EVT and Student-t fitting reveal the true shape of returns. The difference is where fortunes are lost.
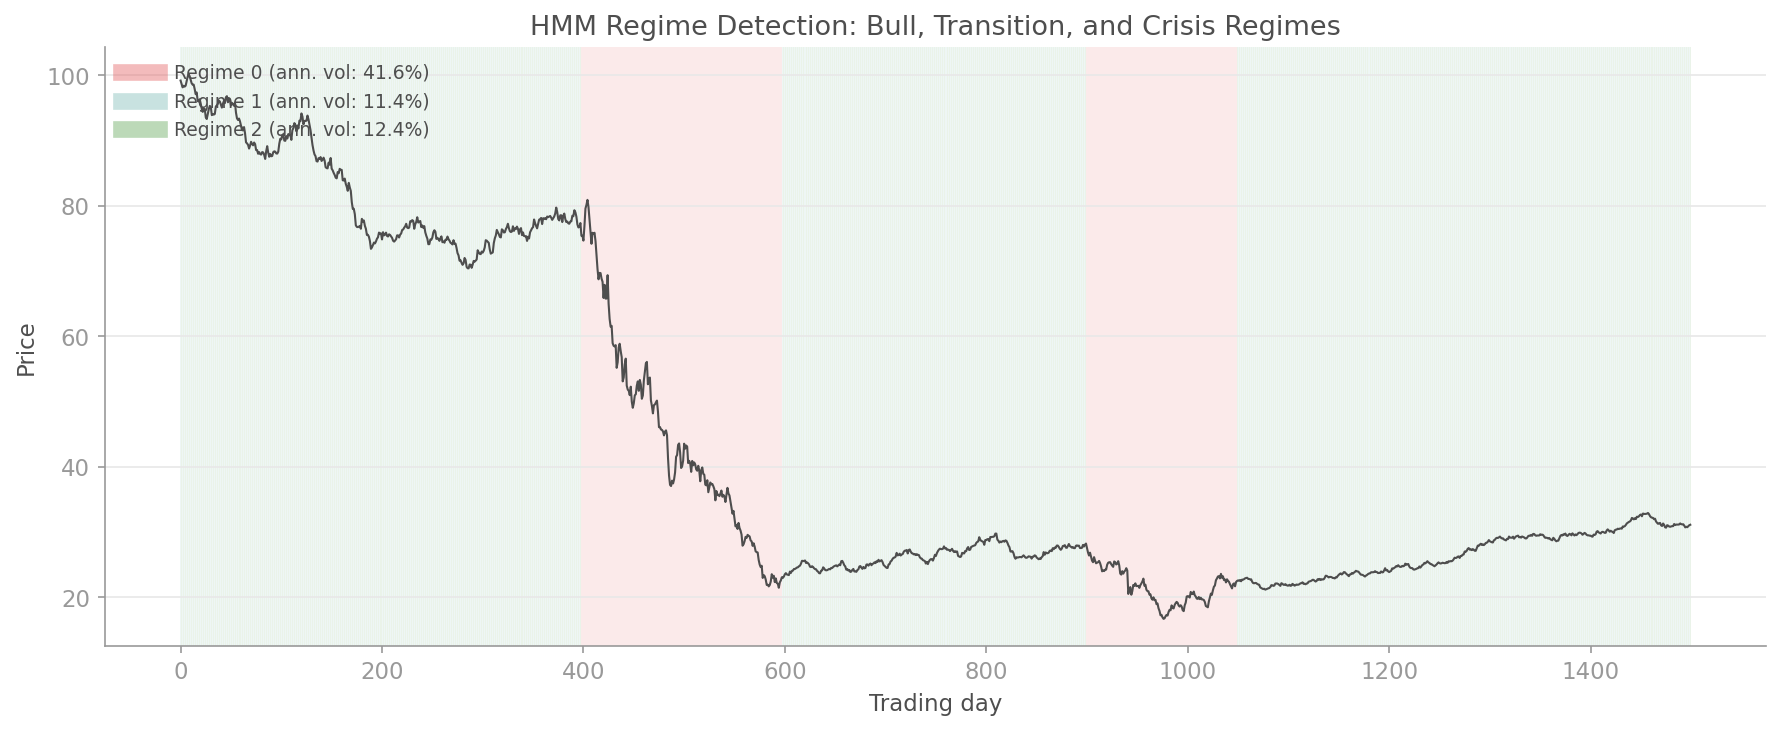
Regime Timeline
Hidden Markov Models automatically identify bull, bear, and crisis regimes. Your portfolio should know which world it is living in.
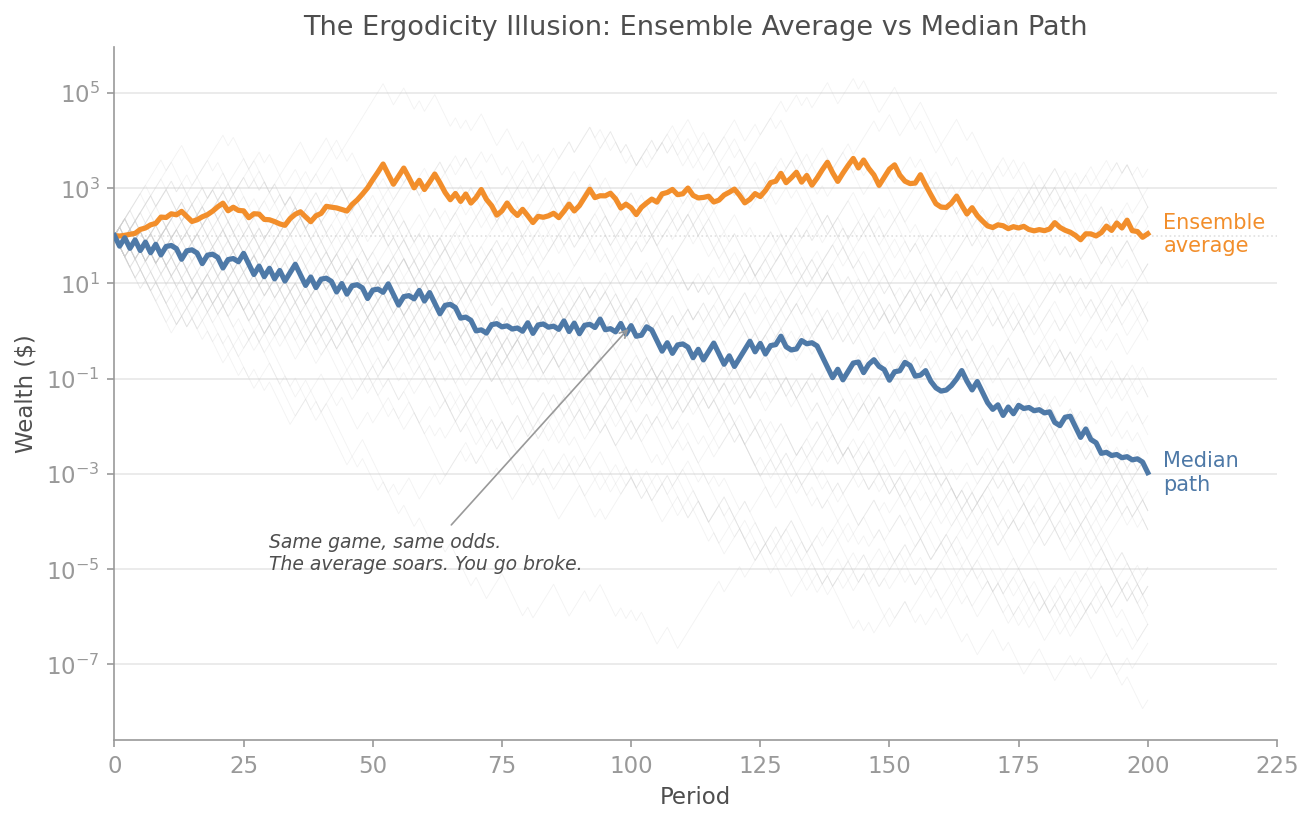
Ergodicity Gap
The ensemble average says you are making money. The time average says you are going broke. The gap between them is the most important number in finance that nobody computes.
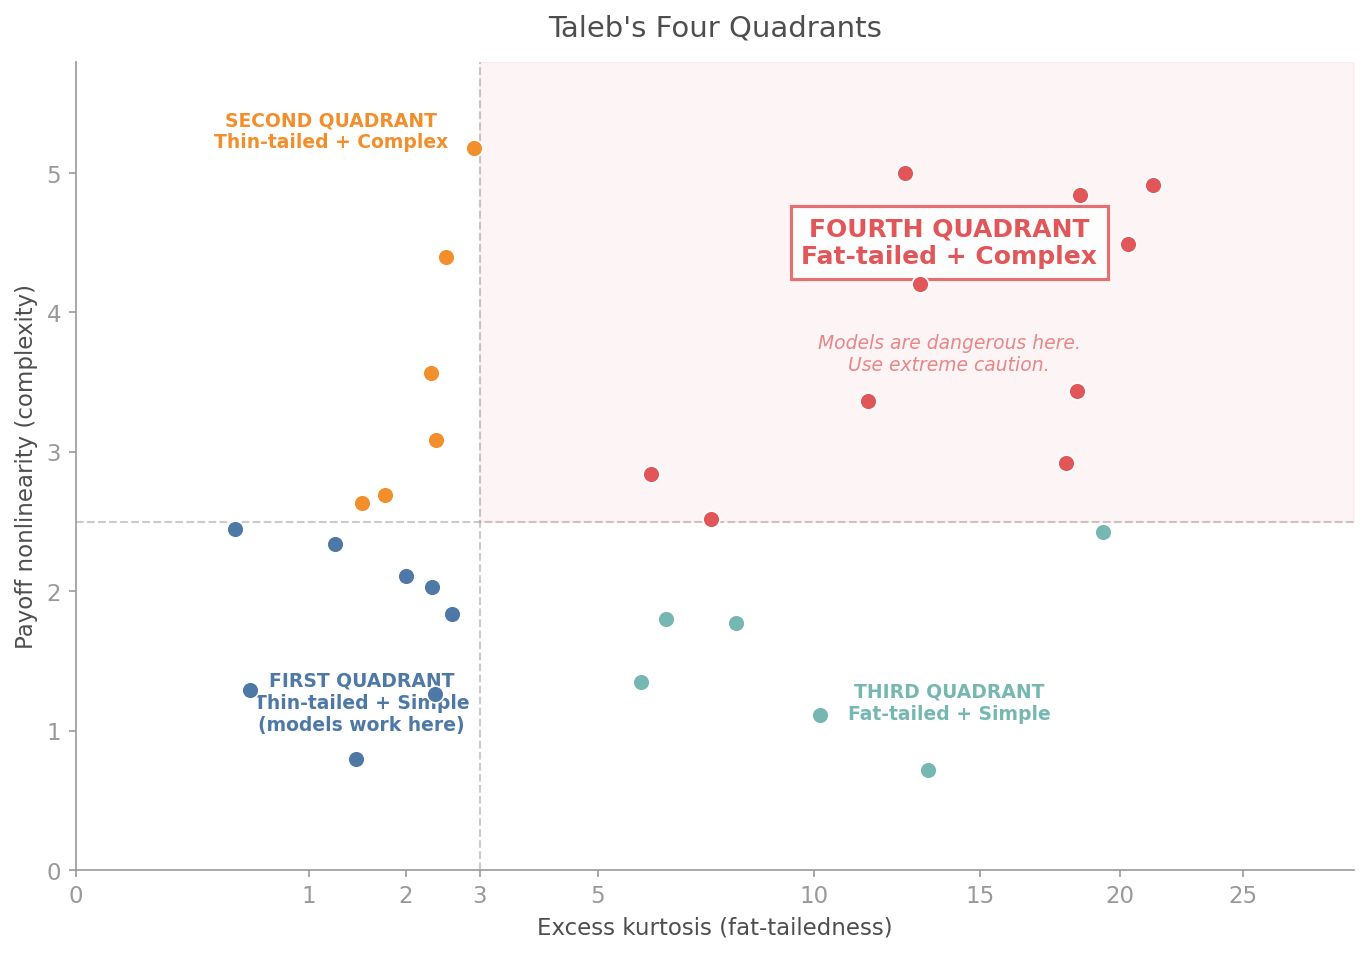
Fourth Quadrant Map
Taleb's Fourth Quadrant: where payoffs are extreme and distributions are unknown. Know which quadrant your portfolio lives in before the market tells you.
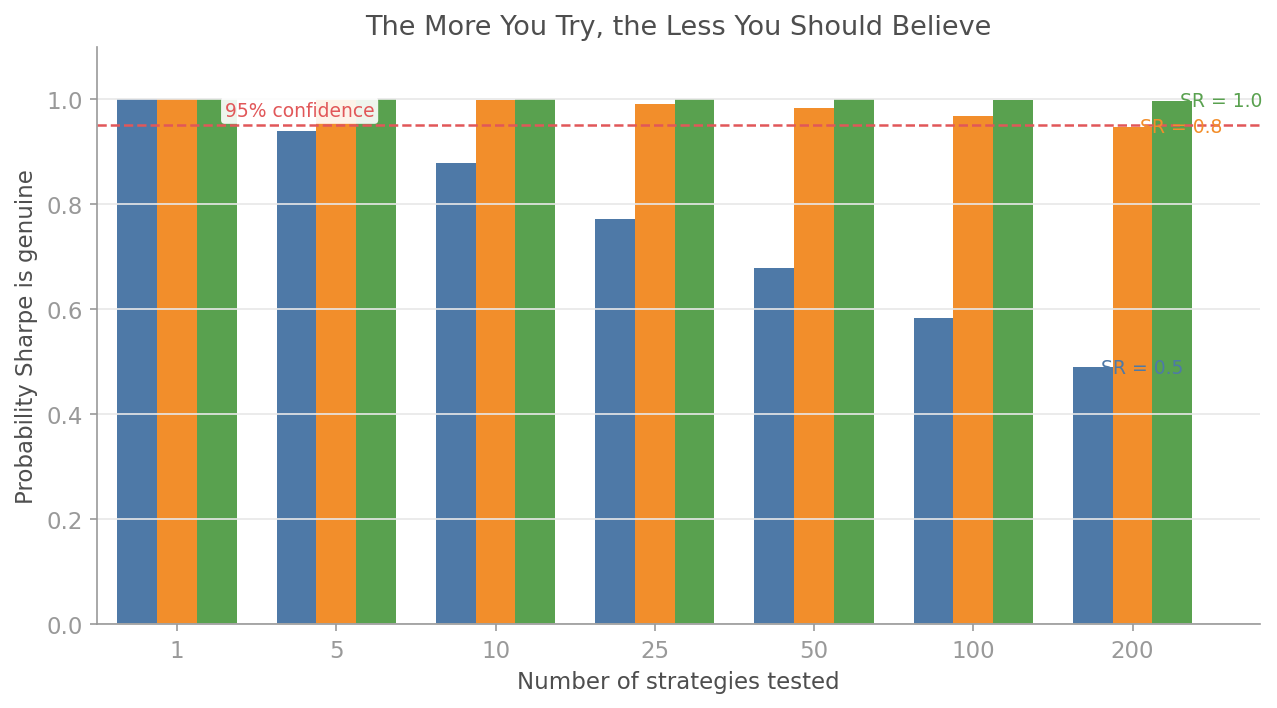
Deflated Sharpe Ratio
You tested 50 strategies and picked the best. The Deflated Sharpe Ratio tells you the probability that your winner is genuine, not a multiple-testing artefact.
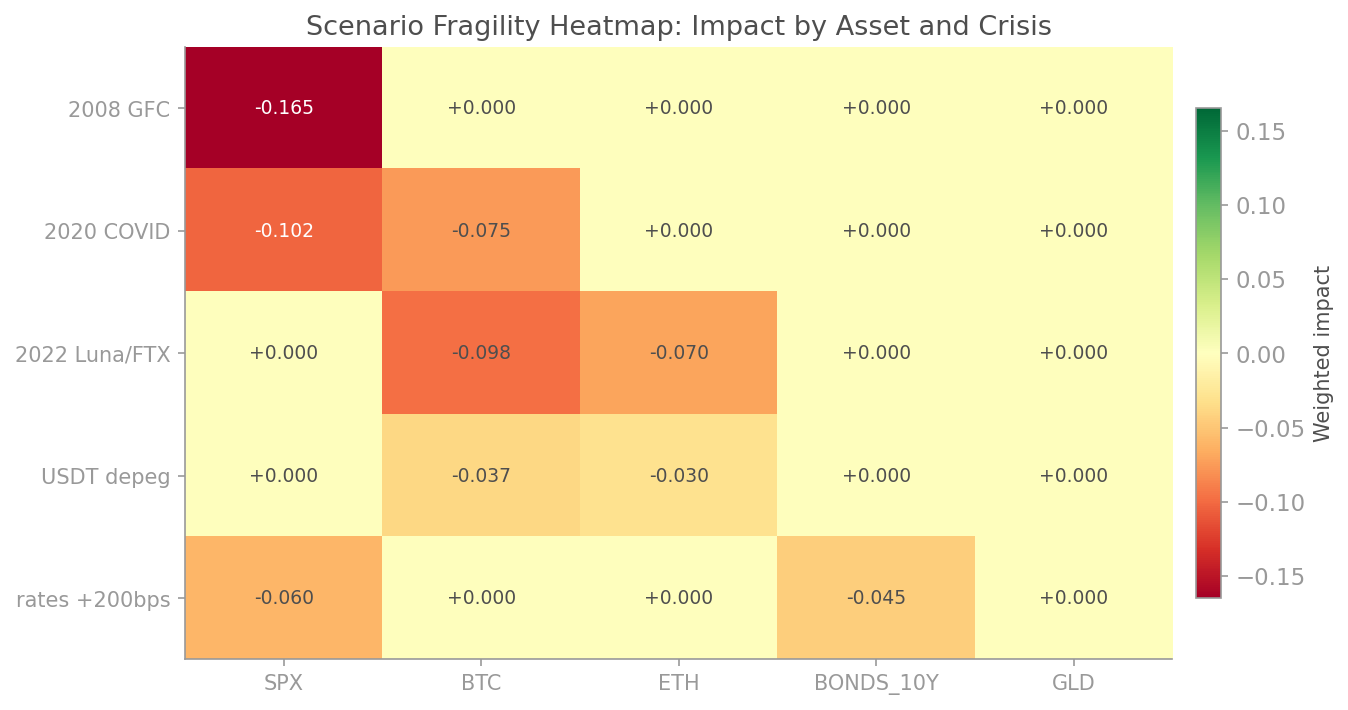
Scenario Stress Heatmap
How does your portfolio fare under the GFC, COVID, the taper tantrum, and a dozen other crises? One glance.
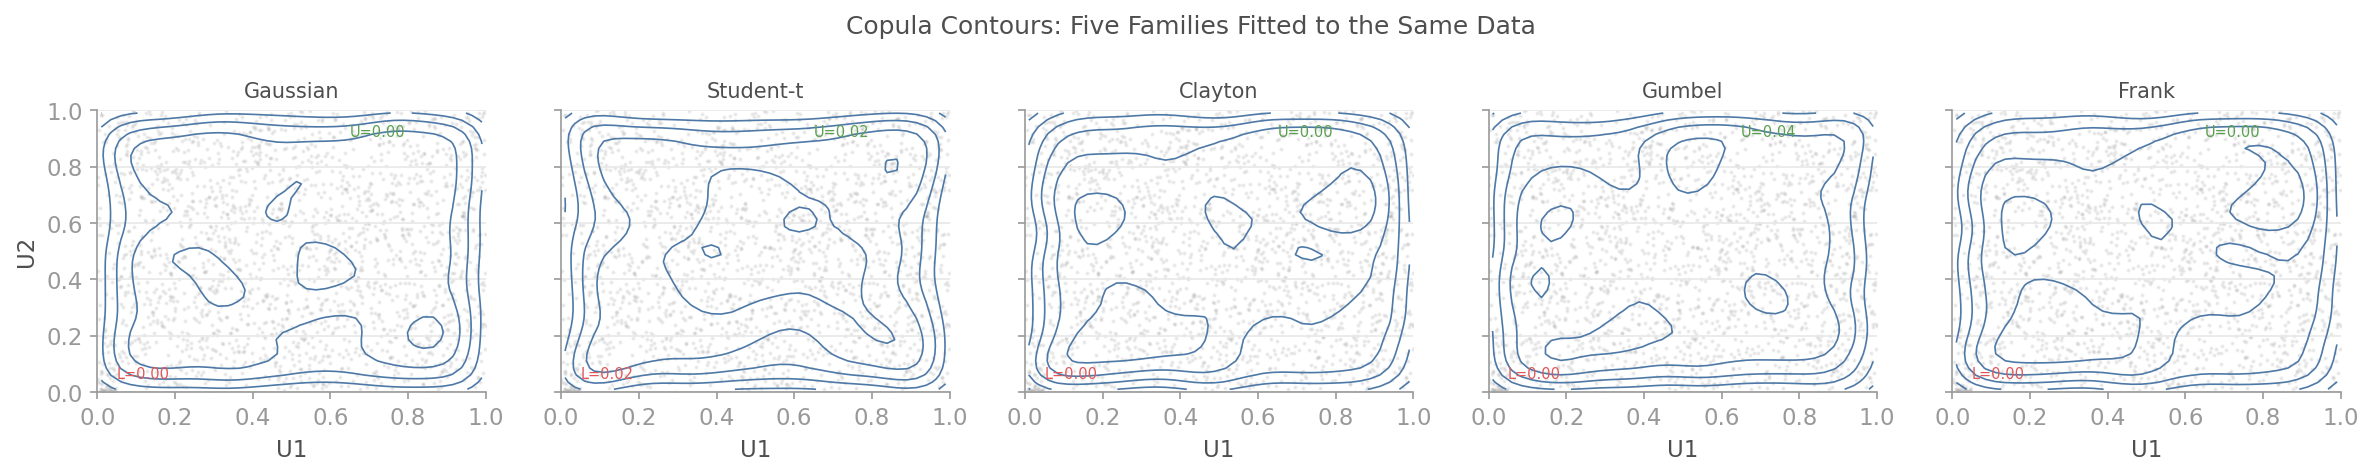
Copula Contours
Five copula families fitted to the same data. Gaussian copula says tail dependence is zero. Student-t and Clayton disagree. They are right.
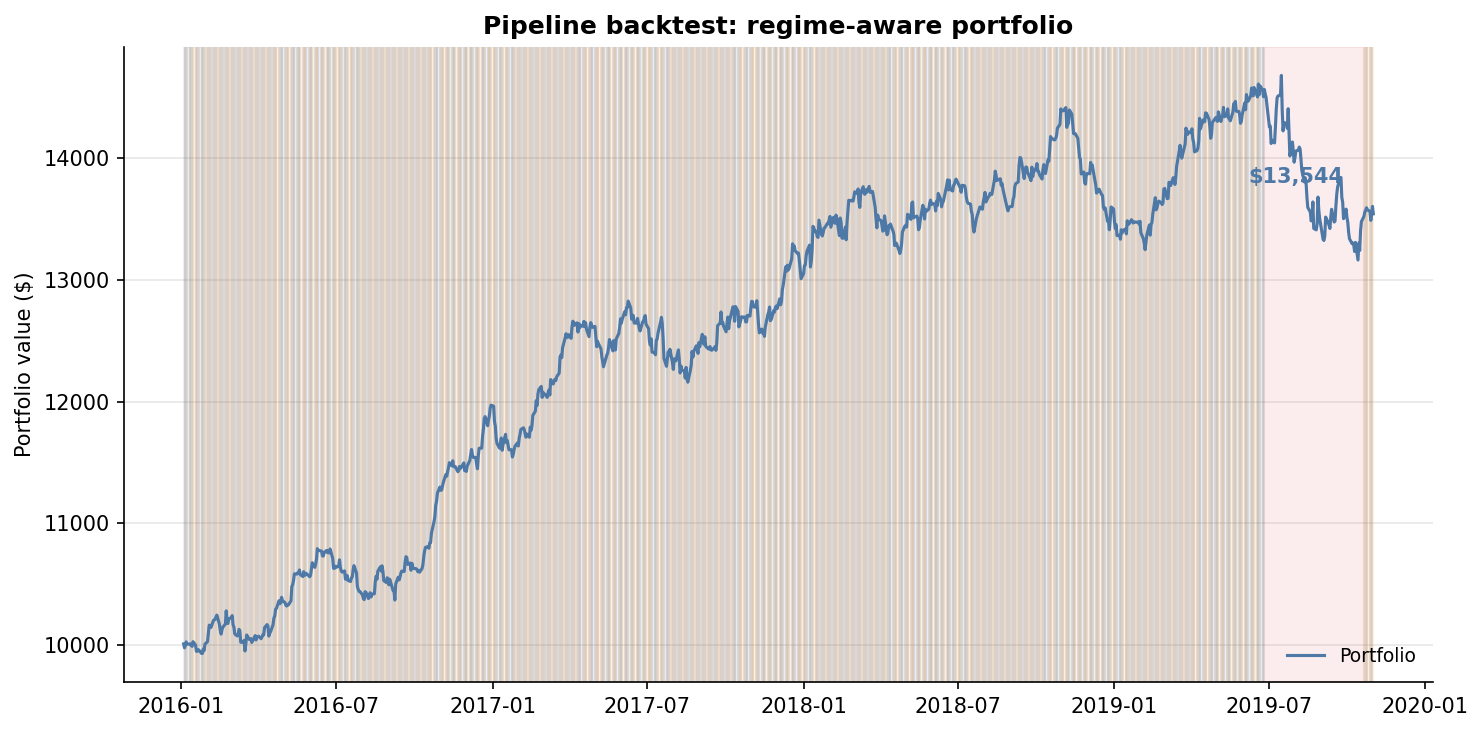
Pipeline Equity Curve
The Dream API in action: regime-aware portfolio construction with automatic defensive tilting during crisis periods.
Installation
pip install quantlite
Install only the data sources you need:
pip install quantlite[yahoo]    # Yahoo Finance
pip install quantlite[crypto]   # Cryptocurrency exchanges (CCXT)
pip install quantlite[fred]     # FRED macroeconomic data
pip install quantlite[plotly]   # Interactive Plotly charts
pip install quantlite[all]      # Everything
Optional: hmmlearn for HMM regime detection.
Quickstart
The Dream API
import quantlite as ql

# Fetch → detect regimes → build portfolio → backtest → report
data = ql.fetch(["AAPL", "BTC-USD", "GLD", "TLT"], period="5y")
regimes = ql.detect_regimes(data, n_regimes=3)
weights = ql.construct_portfolio(data, regime_aware=True, regimes=regimes)
result = ql.backtest(data, weights)
ql.tearsheet(result, regimes=regimes, save="portfolio.html")
Fat-Tail Risk Analysis
from quantlite.distributions.fat_tails import student_t_process
from quantlite.risk.metrics import value_at_risk, cvar, return_moments
from quantlite.risk.evt import tail_risk_summary

# Generate fat-tailed returns (nu=4 gives realistic equity tail behaviour)
returns = student_t_process(nu=4.0, mu=0.0003, sigma=0.012, n_steps=2520, rng_seed=42)

# Cornish-Fisher VaR accounts for skewness and kurtosis
var_99 = value_at_risk(returns, alpha=0.01, method="cornish-fisher")
cvar_99 = cvar(returns, alpha=0.01)
moments = return_moments(returns)

print(f"VaR (99%):       {var_99:.4f}")
print(f"CVaR (99%):      {cvar_99:.4f}")
print(f"Excess kurtosis: {moments.kurtosis:.2f}")

# Full EVT tail analysis
summary = tail_risk_summary(returns)
print(f"Hill tail index: {summary.hill_estimate.tail_index:.2f}")
print(f"GPD shape (xi):  {summary.gpd_fit.shape:.4f}")
print(f"1-in-100 loss:   {summary.return_level_100:.4f}")
Backtest Forensics
from quantlite.forensics import deflated_sharpe_ratio
from quantlite.resample import bootstrap_sharpe_distribution

# You tried 50 strategies and the best had Sharpe 1.8.
# Is it real?
dsr = deflated_sharpe_ratio(observed_sharpe=1.8, n_trials=50, n_obs=252)
print(f"Probability Sharpe is genuine: {dsr:.2%}")

# Bootstrap confidence interval on the Sharpe ratio
result = bootstrap_sharpe_distribution(returns, n_samples=2000, seed=42)
print(f"Sharpe: {result['point_estimate']:.2f}")
print(f"95% CI: [{result['ci_lower']:.2f}, {result['ci_upper']:.2f}]")
Module Reference
Core Risk
| Module | Description |
|---|---|
quantlite.risk.metrics |
VaR (historical, parametric, Cornish-Fisher), CVaR, Sortino, Calmar, Omega, tail ratio, drawdowns |
quantlite.risk.evt |
GPD, GEV, Hill estimator, Peaks Over Threshold, return levels |
quantlite.distributions.fat_tails |
Student-t, Lévy stable, regime-switching GBM, Kou jump-diffusion |
quantlite.metrics |
Annualised return, volatility, Sharpe, max drawdown |
Dependency and Portfolio
| Module | Description |
|---|---|
quantlite.dependency.copulas |
Gaussian, Student-t, Clayton, Gumbel, Frank copulas with tail dependence |
quantlite.dependency.correlation |
Rolling, EWMA, stress, rank correlation |
quantlite.dependency.clustering |
Hierarchical Risk Parity |
quantlite.portfolio.optimisation |
Mean-variance, CVaR, risk parity, HRP, Black-Litterman, Kelly |
quantlite.portfolio.rebalancing |
Calendar, threshold, and tactical rebalancing |
Backtesting
| Module | Description |
|---|---|
quantlite.backtesting.engine |
Multi-asset backtesting with circuit breakers and slippage |
quantlite.backtesting.signals |
Momentum, mean reversion, trend following, volatility targeting |
quantlite.backtesting.analysis |
Performance summaries, monthly tables, regime attribution |
Data
| Module | Description |
|---|---|
quantlite.data |
Unified connectors: Yahoo Finance, CCXT, FRED, local files, plugin registry |
quantlite.data_generation |
GBM, correlated GBM, Ornstein-Uhlenbeck, Merton jump-diffusion |
Taleb Stack
| Module | Description |
|---|---|
quantlite.ergodicity |
Time-average vs ensemble-average growth, Kelly fraction, leverage effect |
quantlite.antifragile |
Antifragility score, convexity, Fourth Quadrant, barbell allocation, Lindy |
quantlite.scenarios |
Composable scenario engine, pre-built crisis library, shock propagation |
Honest Backtesting
| Module | Description |
|---|---|
quantlite.forensics |
Deflated Sharpe Ratio, Probabilistic Sharpe, haircut adjustments, minimum track record |
quantlite.overfit |
CSCV/PBO, TrialTracker, multiple testing correction, walk-forward validation |
quantlite.resample |
Block and stationary bootstrap, confidence intervals for Sharpe and drawdown |
Systemic Risk
| Module | Description |
|---|---|
quantlite.contagion |
CoVaR, Delta CoVaR, Marginal Expected Shortfall, Granger causality |
quantlite.network |
Correlation networks, eigenvector centrality, cascade simulation, community detection |
quantlite.diversification |
Effective Number of Bets, entropy diversification, tail diversification |
Crypto
| Module | Description |
|---|---|
quantlite.crypto.stablecoin |
Depeg probability, peg deviation tracking, reserve risk scoring |
quantlite.crypto.exchange |
Exchange concentration (HHI), wallet risk, proof of reserves, slippage |
quantlite.crypto.onchain |
Wallet exposure, TVL tracking, DeFi dependency graphs, smart contract risk |
Simulation
| Module | Description |
|---|---|
quantlite.simulation.evt_simulation |
EVT tail simulation, parametric tail simulation, scenario fan |
quantlite.simulation.copula_mc |
Gaussian copula MC, t-copula MC, stress correlation MC |
quantlite.simulation.regime_mc |
Regime-switching simulation, reverse stress test |
quantlite.monte_carlo |
Monte Carlo simulation harness |
Factor Models
| Module | Description |
|---|---|
quantlite.factors.classical |
Fama-French three/five-factor, Carhart four-factor, factor attribution |
quantlite.factors.custom |
Custom factor construction, significance testing, decay analysis |
quantlite.factors.tail_risk |
CVaR decomposition, regime factor exposure, crowding score |
Regime Integration and Pipeline
| Module | Description |
|---|---|
quantlite.regimes.hmm |
Hidden Markov Model regime detection |
quantlite.regimes.changepoint |
CUSUM and Bayesian changepoint detection |
quantlite.regimes.conditional |
Regime-conditional risk metrics and VaR |
quantlite.regime_integration |
Defensive tilting, filtered backtesting, regime tearsheets |
quantlite.pipeline |
Dream API: fetch, detect_regimes, construct_portfolio, backtest, tearsheet |
Other
| Module | Description |
|---|---|
quantlite.instruments |
Black-Scholes, bonds, barrier and Asian options |
quantlite.viz |
Stephen Few-themed charts: risk dashboards, copula contours, regime timelines |
quantlite.report |
HTML/PDF tearsheet generation |
Design Philosophy
- Fat tails are the default. Gaussian assumptions are explicitly opt-in, never implicit.
- Explicit return types. Every function documents its return type precisely:
float,dictwith named keys, or a frozen dataclass with clear attributes. - Composable modules. Risk metrics feed into portfolio optimisation which feeds into backtesting. Each layer works independently.
- Honest modelling. If a method has known limitations (e.g., Gaussian copula has zero tail dependence), the docstring says so.
- Reproducible. Every stochastic function accepts
rng_seedfor deterministic output.
Documentation
Full documentation lives in the docs/ directory:
| Document | Topic |
|---|---|
| risk.md | Risk metrics and EVT |
| copulas.md | Copula dependency structures |
| regimes.md | Regime detection |
| portfolio.md | Portfolio optimisation and rebalancing |
| data.md | Data connectors |
| visualisation.md | Stephen Few-themed charts |
| interactive_viz.md | Plotly interactive charts |
| ergodicity.md | Ergodicity economics |
| antifragility.md | Antifragility measurement |
| scenarios.md | Scenario stress testing |
| forensics.md | Deflated Sharpe and strategy forensics |
| overfitting.md | Overfitting detection |
| resampling.md | Bootstrap resampling |
| contagion.md | Systemic risk and contagion |
| network.md | Financial network analysis |
| diversification.md | Diversification diagnostics |
| factors_classical.md | Classical factor models |
| factors_custom.md | Custom factor tools |
| factors_tail_risk.md | Tail risk factor analysis |
| simulation_evt.md | EVT simulation |
| simulation_copula.md | Copula Monte Carlo |
| simulation_regime.md | Regime-switching simulation |
| regime_integration.md | Regime-aware pipelines |
| pipeline.md | Dream API reference |
| reports.md | Tearsheet generation |
| stablecoin_risk.md | Stablecoin risk |
| exchange_risk.md | Exchange risk |
| onchain_risk.md | On-chain risk |
| architecture.md | Library architecture |
Contributing
Contributions are welcome. Please ensure:
- All new functions have type hints and docstrings
- Tests pass:
pytest - Code is formatted:
ruff checkandruff format - British spellings in all documentation
License
MIT License. See LICENSE for details.
Links
Project details
Verified details
These details have been verified by PyPIProject links
GitHub Statistics
Maintainers
Release history Release notifications | RSS feed


Download files
Download the file for your platform. If you're not sure which to choose, learn more about installing packages.
Source Distribution
Built Distribution
Filter files by name, interpreter, ABI, and platform.
If you're not sure about the file name format, learn more about wheel file names.
Copy a direct link to the current filters
File details
Details for the file quantlite-1.7.1.tar.gz.
File metadata
- Download URL: quantlite-1.7.1.tar.gz
- Upload date:
- Size: 280.1 kB
- Tags: Source
- Uploaded using Trusted Publishing? Yes
- Uploaded via: twine/6.1.0 CPython/3.13.12
File hashes
| Algorithm | Hash digest | |
|---|---|---|
| SHA256 |
87279ba874229035e43d568eba7f39e10420ee5a1a8b813a646dc803b3502437
|
|
| MD5 |
62b87cc630dfcbdb17cee6349317421a
|
|
| BLAKE2b-256 |
fca89ea1799f63453308e862254edbdab3dbd0e4478b92d5547dd18f8e61b417
|
Provenance
The following attestation bundles were made for quantlite-1.7.1.tar.gz:
Publisher:
publish.yml on prasants/QuantLite
-
Statement:
-
Statement type:
https://in-toto.io/Statement/v1 -
Predicate type:
https://docs.pypi.org/attestations/publish/v1 -
Subject name:
quantlite-1.7.1.tar.gz -
Subject digest:
87279ba874229035e43d568eba7f39e10420ee5a1a8b813a646dc803b3502437 - Sigstore transparency entry: 1810281764
- Sigstore integration time:
-
Permalink:
prasants/QuantLite@9d87a6d1627fb053b7a22a2b12cf96d406c7c4c4 -
Branch / Tag:
refs/tags/v1.7.1 - Owner: https://github.com/prasants
-
Access:
public
-
Token Issuer:
https://token.actions.githubusercontent.com -
Runner Environment:
github-hosted -
Publication workflow:
publish.yml@9d87a6d1627fb053b7a22a2b12cf96d406c7c4c4 -
Trigger Event:
push
-
Statement type:
File details
Details for the file quantlite-1.7.1-py3-none-any.whl.
File metadata
- Download URL: quantlite-1.7.1-py3-none-any.whl
- Upload date:
- Size: 274.2 kB
- Tags: Python 3
- Uploaded using Trusted Publishing? Yes
- Uploaded via: twine/6.1.0 CPython/3.13.12
File hashes
| Algorithm | Hash digest | |
|---|---|---|
| SHA256 |
c1e029b64eeee9f610a0432c8506fd162f15275f8a6ad86415b78c647ec49d5e
|
|
| MD5 |
1cb6229601fe7bf9201d855a2a8d0adf
|
|
| BLAKE2b-256 |
4914c04659745ef2958adffdc855a79cf20d4c392c8d1e2000c8dc0e41c2378e
|
Provenance
The following attestation bundles were made for quantlite-1.7.1-py3-none-any.whl:
Publisher:
publish.yml on prasants/QuantLite
-
Statement:
-
Statement type:
https://in-toto.io/Statement/v1 -
Predicate type:
https://docs.pypi.org/attestations/publish/v1 -
Subject name:
quantlite-1.7.1-py3-none-any.whl -
Subject digest:
c1e029b64eeee9f610a0432c8506fd162f15275f8a6ad86415b78c647ec49d5e - Sigstore transparency entry: 1810281787
- Sigstore integration time:
-
Permalink:
prasants/QuantLite@9d87a6d1627fb053b7a22a2b12cf96d406c7c4c4 -
Branch / Tag:
refs/tags/v1.7.1 - Owner: https://github.com/prasants
-
Access:
public
-
Token Issuer:
https://token.actions.githubusercontent.com -
Runner Environment:
github-hosted -
Publication workflow:
publish.yml@9d87a6d1627fb053b7a22a2b12cf96d406c7c4c4 -
Trigger Event:
push
-
Statement type:


