Portfolio analytics for quants

Project description


Fork of Original QuantStats by Ran Aroussi, Maintained by Lumiwealth BotSpot
This is a forked version of the original QuantStats library by Ran Aroussi. The original library can be found at https://github.com/ranaroussi/quantstats
This forked version is maintained by Lumiwealth BotSpot. For more information, visit https://github.com/Lumiwealth/quantstats_lumi or https://botspot.trade.
This forked version was created because it seems that the original library is no longer being maintained. The original library has a number of issues and pull requests that have been open for a long time and have not been addressed. This forked version aims to address some of these issues and pull requests.
This forked version is created and maintained by the Lumiwealth team. We are a team of data scientists and software engineers who are passionate about quantitative finance and algorithmic trading. We use QuantStats in our daily work with the Lumibot library and we want to make sure that QuantStats is a reliable and well-maintained library.
If you're interested in learning how to make your own trading algorithms, check out our Lumibot library at https://github.com/Lumiwealth/lumibot and check out our courses at https://lumiwealth.com
QuantStats Lumi: Portfolio analytics for quants
QuantStats Lumi is a Python library that performs portfolio profiling, allowing quants and portfolio managers to understand their performance better by providing them with in-depth analytics and risk metrics.
QuantStats is comprised of 3 main modules:
quantstats.stats- for calculating various performance metrics, like Sharpe ratio, Win rate, Volatility, etc.quantstats.plots- for visualizing performance, drawdowns, rolling statistics, monthly returns, etc.quantstats.reports- for generating metrics reports, batch plotting, and creating tear sheets that can be saved as an HTML file.
Here's an example of a simple tear sheet analyzing a strategy:
Quick Start
Install QuantStats Lumi using pip:
$ pip install quantstats-lumi
%matplotlib inline
import quantstats_lumi as qs

# extend pandas functionality with metrics, etc.
qs.extend_pandas()

# fetch the daily returns for a stock
stock = qs.utils.download_returns('META')

# show sharpe ratio
qs.stats.sharpe(stock)

# or using extend_pandas() :)
stock.sharpe()
Output:
0.8135304438803402
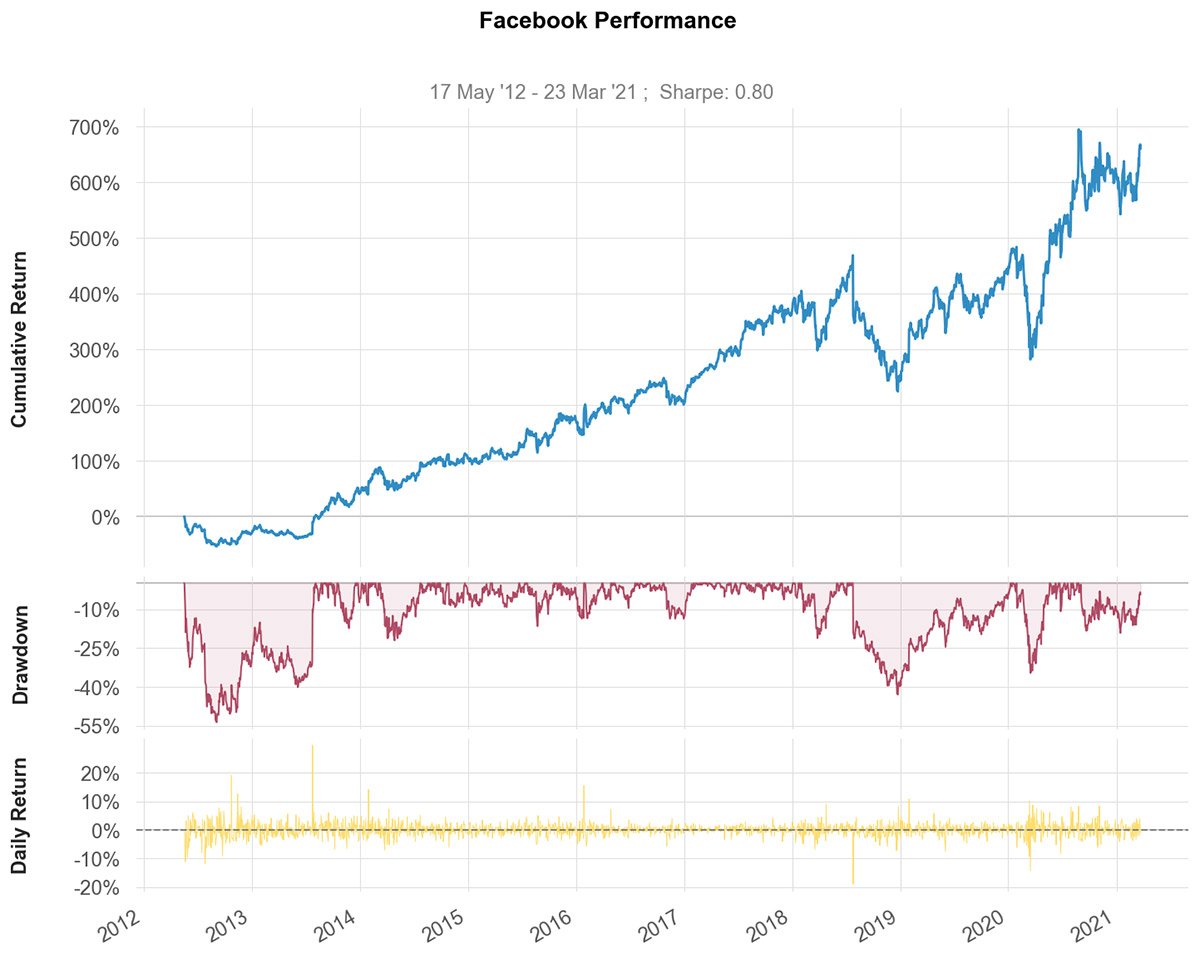
Visualize stock performance
qs.plots.snapshot(stock, title='Facebook Performance', show=True)

# can also be called via:
# stock.plot_snapshot(title='Facebook Performance', show=True)
Output:
Creating a report
You can create 7 different report tearsheets:
qs.reports.metrics(mode='basic|full', ...)- shows basic/full metricsqs.reports.plots(mode='basic|full', ...)- shows basic/full plotsqs.reports.basic(...)- shows basic metrics and plotsqs.reports.full(...)- shows full metrics and plotsqs.reports.html(...)- generates a complete report as html
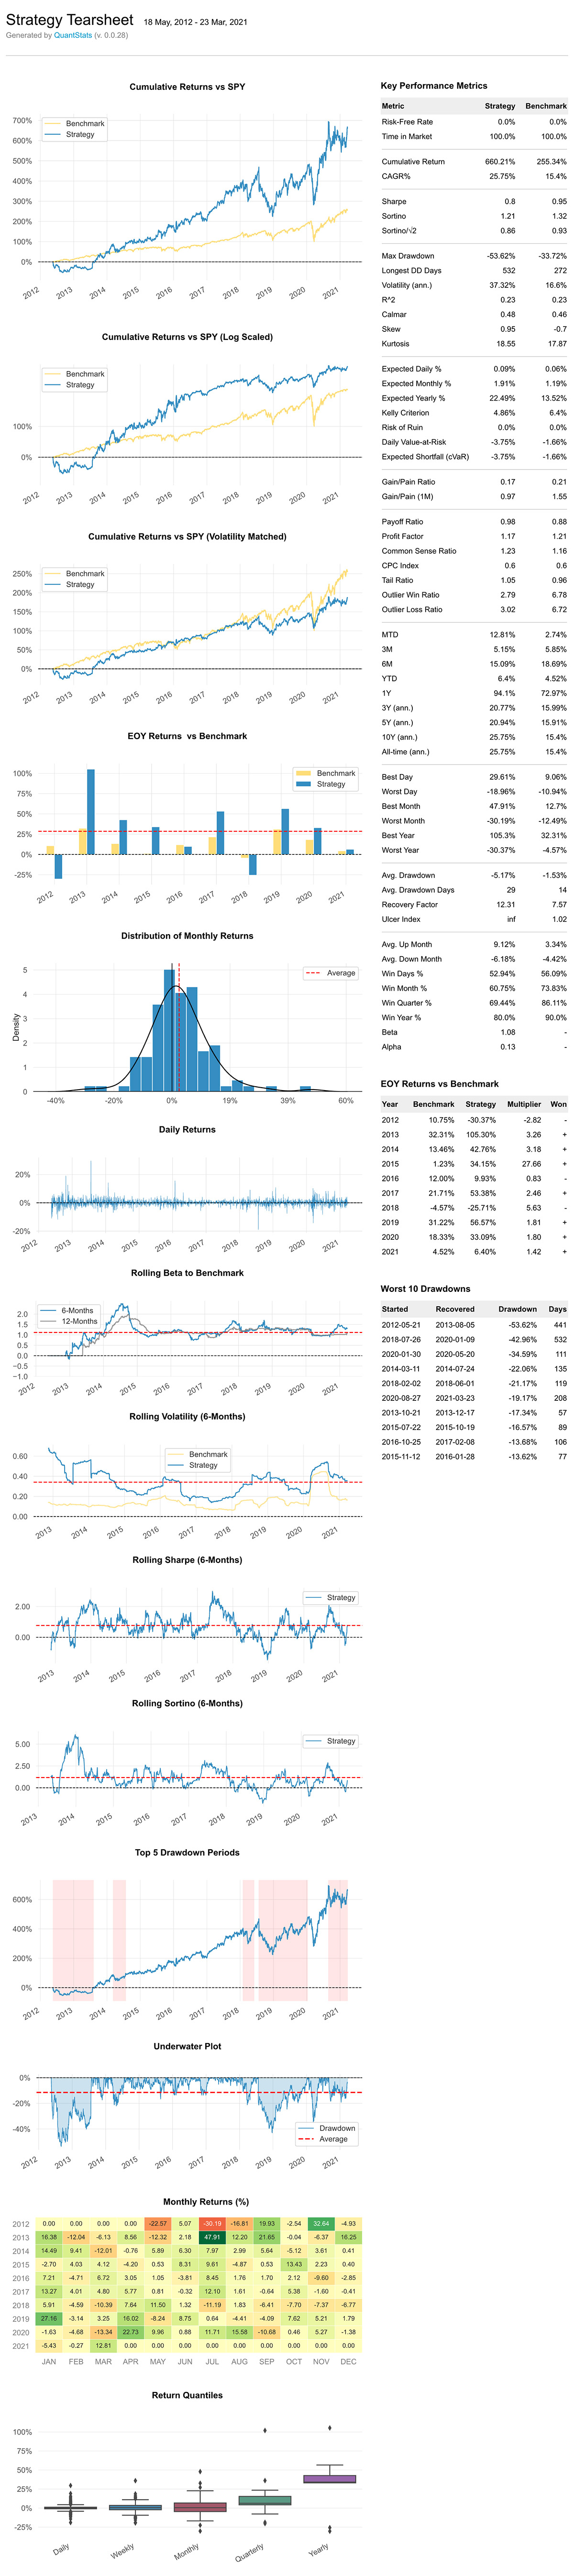
Let' create an html tearsheet
# (benchmark can be a pandas Series or ticker)
qs.reports.html(stock, "SPY")
Output will generate something like this:
To view a complete list of available methods, run
[f for f in dir(qs.stats) if f[0] != '_']
['avg_loss',
 'avg_return',
 'avg_win',
 'best',
 'cagr',
 'calmar',
 'common_sense_ratio',
 'comp',
 'compare',
 'compsum',
 'conditional_value_at_risk',
 'consecutive_losses',
 'consecutive_wins',
 'cpc_index',
 'cvar',
 'drawdown_details',
 'expected_return',
 'expected_shortfall',
 'exposure',
 'gain_to_pain_ratio',
 'geometric_mean',
 'ghpr',
 'greeks',
 'implied_volatility',
 'information_ratio',
 'kelly_criterion',
 'kurtosis',
 'max_drawdown',
 'monthly_returns',
 'outlier_loss_ratio',
 'outlier_win_ratio',
 'outliers',
 'payoff_ratio',
 'profit_factor',
 'profit_ratio',
 'r2',
 'r_squared',
 'rar',
 'recovery_factor',
 'remove_outliers',
 'risk_of_ruin',
 'risk_return_ratio',
 'rolling_greeks',
 'ror',
 'sharpe',
 'skew',
 'sortino',
 'adjusted_sortino',
 'tail_ratio',
 'to_drawdown_series',
 'ulcer_index',
 'ulcer_performance_index',
 'upi',
 'utils',
 'value_at_risk',
 'var',
 'volatility',
 'win_loss_ratio',
 'win_rate',
 'worst']
[f for f in dir(qs.plots) if f[0] != '_']
['daily_returns',
 'distribution',
 'drawdown',
 'drawdowns_periods',
 'earnings',
 'histogram',
 'log_returns',
 'monthly_heatmap',
 'returns',
 'rolling_beta',
 'rolling_sharpe',
 'rolling_sortino',
 'rolling_volatility',
 'snapshot',
 'yearly_returns']
*** Full documenttion coming soon ***
In the meantime, you can get insights as to optional parameters for each method, by using Python's help method:
help(qs.stats.conditional_value_at_risk)
Help on function conditional_value_at_risk in module quantstats.stats:

conditional_value_at_risk(returns, sigma=1, confidence=0.99)
    calculats the conditional daily value-at-risk (aka expected shortfall)
    quantifies the amount of tail risk an investment
Installation
Install using pip:
$ pip install quantstats-lumi --upgrade --no-cache-dir
Install using conda:
$ conda install -c lumiwealth quantstats-lumi # Or your specific channel / remove if not applicable
Requirements
- Python >= 3.5+
- pandas (tested to work with >=0.24.0)
- numpy >= 1.15.0
- scipy >= 1.2.0
- matplotlib >= 3.0.0
- seaborn >= 0.9.0
- tabulate >= 0.8.0
- yfinance >= 0.1.38
- plotly >= 3.4.1 (optional, for using
plots.to_plotly())
Questions?
This is a new library... If you find a bug, please open an issue in this repository.
If you'd like to contribute, a great place to look is the issues marked with help-wanted.
For more information about Lumiwealth BotSpot, visit https://botspot.trade.
Known Issues
For some reason, I couldn't find a way to tell seaborn not to return the
monthly returns heatmap when instructed to save - so even if you save the plot (by passing savefig={...}) it will still show the plot.
Legal Stuff
QuantStats Lumi is distributed under the Apache Software License. See the LICENSE.txt file in the release for details.
Testing
To run the test suite, make sure you have pytest installed, then run:
pytest
This will automatically discover and run all tests in the repository.
P.S.
Please drop us a note with any feedback you have.
Lumiwealth BotSpot https://github.com/Lumiwealth/quantstats_lumi https://botspot.trade
Release history Release notifications | RSS feed


Download files
Download the file for your platform. If you're not sure which to choose, learn more about installing packages.
Source Distribution
Built Distribution
Filter files by name, interpreter, ABI, and platform.
If you're not sure about the file name format, learn more about wheel file names.
Copy a direct link to the current filters
File details
Details for the file quantstats_lumi-1.1.0.tar.gz.
File metadata
- Download URL: quantstats_lumi-1.1.0.tar.gz
- Upload date:
- Size: 58.5 kB
- Tags: Source
- Uploaded using Trusted Publishing? No
- Uploaded via: twine/6.2.0 CPython/3.12.12
File hashes
| Algorithm | Hash digest | |
|---|---|---|
| SHA256 |
d5b9b6e0dc653af89dd18f435090e2dac1007c2f4c74d4f13166ef522f15f696
|
|
| MD5 |
673f338f931bee50aad7e4bcb1a5d2d1
|
|
| BLAKE2b-256 |
a914a663fb424eff2d3971024d46011667410dc0573f96a0c3f4450b8eb046a8
|
File details
Details for the file quantstats_lumi-1.1.0-py2.py3-none-any.whl.
File metadata
- Download URL: quantstats_lumi-1.1.0-py2.py3-none-any.whl
- Upload date:
- Size: 55.2 kB
- Tags: Python 2, Python 3
- Uploaded using Trusted Publishing? No
- Uploaded via: twine/6.2.0 CPython/3.12.12
File hashes
| Algorithm | Hash digest | |
|---|---|---|
| SHA256 |
df8bbaf0f3d612fda340904b164e2adc9f97d89b5fbff914de6d38554c5f35b3
|
|
| MD5 |
7ee7efd7d726dd5f14d311355afad97b
|
|
| BLAKE2b-256 |
1579119eeb94e3b826b084e545b66f63929c32951bd422b0e1fc3af622638493
|


