
Drop-in replacement for QuantStats — advanced risk engines, institutional HTML tearsheets, and actionable portfolio analytics for quants
Verified details
These details have been verified by PyPIProject links
GitHub Statistics
Maintainers

Project description



QuantStats Pro: Advanced portfolio analytics for quants
QuantStats Pro is an actively maintained drop-in replacement for QuantStats — same import quantstats as qs, hardened metrics, and a product roadmap that goes well beyond the original scope.
Where original quantstats stops at classic performance stats and a single HTML tearsheet, Pro is built to become a definitive quantitative analytics stack: advanced risk engines, new metrics, institutional-grade reports, and outputs designed to drive actionable decisions, not just describe the past.
Built for systematic traders, portfolio managers, and quant researchers who need production-grade tearsheets from a returns series.
pip install quantstats-pro
import quantstats as qs
Note: QuantStats Pro cannot coexist with the original
quantstatspackage in the same environment — both provide thequantstatsimport namespace. Uninstallquantstatsbefore installingquantstats-pro(pip uninstall quantstats).
Changelog » · Upstream » · Contributing »
Why QuantStats Pro?
Same API surface, stronger foundation — bugfixes, reliability, and a growing analytics layer that upstream does not aim to provide.
Headline additions (v0.3.0+):
| Capability | What you get |
|---|---|
html_simple |
Lean equity-curve tearsheet — fast read on performance vs benchmark |
html_montecarlo |
Multi-model forward risk report (GBM, GARCH, Heston, bootstraps, Bayesian, …) with bust/goal probabilities and cross-model consensus |
html_alpha_decay |
Rolling alpha-decay monitor — z-score traffic lights, CUSUM, time-underwater, per-metric distribution charts |
quantstats.montecarlo |
Programmatic multi-model simulation engine behind the Montecarlo tearsheet |
quantstats.alphadecay |
Short-horizon rolling diagnostics engine behind the Alpha Decay tearsheet |
Classic html |
Full tearsheet — metrics + all charts, visually redesigned (v0.2.0+) |
Package modules
| Module | Purpose |
|---|---|
quantstats.stats |
50+ performance metrics (Sharpe, Sortino, drawdown, VaR, …) |
quantstats.plots |
Performance visualizations (returns, drawdown, heatmaps, rolling stats, …) |
quantstats.reports |
HTML tearsheets and metrics tables |
quantstats.montecarlo |
Multi-model forward simulation engine and analytics |
quantstats.alphadecay |
Short-horizon rolling risk analysis and decay detection |
quantstats.utils |
Data prep, download_returns, pandas helpers |
Legacy shuffle-based Montecarlo remains at qs.stats.montecarlo() for backward compatibility. The new engine lives under quantstats.montecarlo and powers qs.reports.html_montecarlo().
HTML Tearsheets
The main product surface in QuantStats Pro is its reporting layer: four HTML tearsheet types that turn a returns series into shareable, browser-ready analytics. All open in the browser by default, or save to disk with output="path.html".
| Function | Use case |
|---|---|
qs.reports.html(...) |
Full classic tearsheet (metrics + all charts) |
qs.reports.html_simple(...) |
Pro-only — lean equity-curve tearsheet for quick strategy review |
qs.reports.html_montecarlo(...) |
Pro-only — multi-model forward risk analysis (1y horizon by default) |
qs.reports.html_alpha_decay(...) |
Pro-only — short-window alpha-decay health monitor (7/15/30d) |
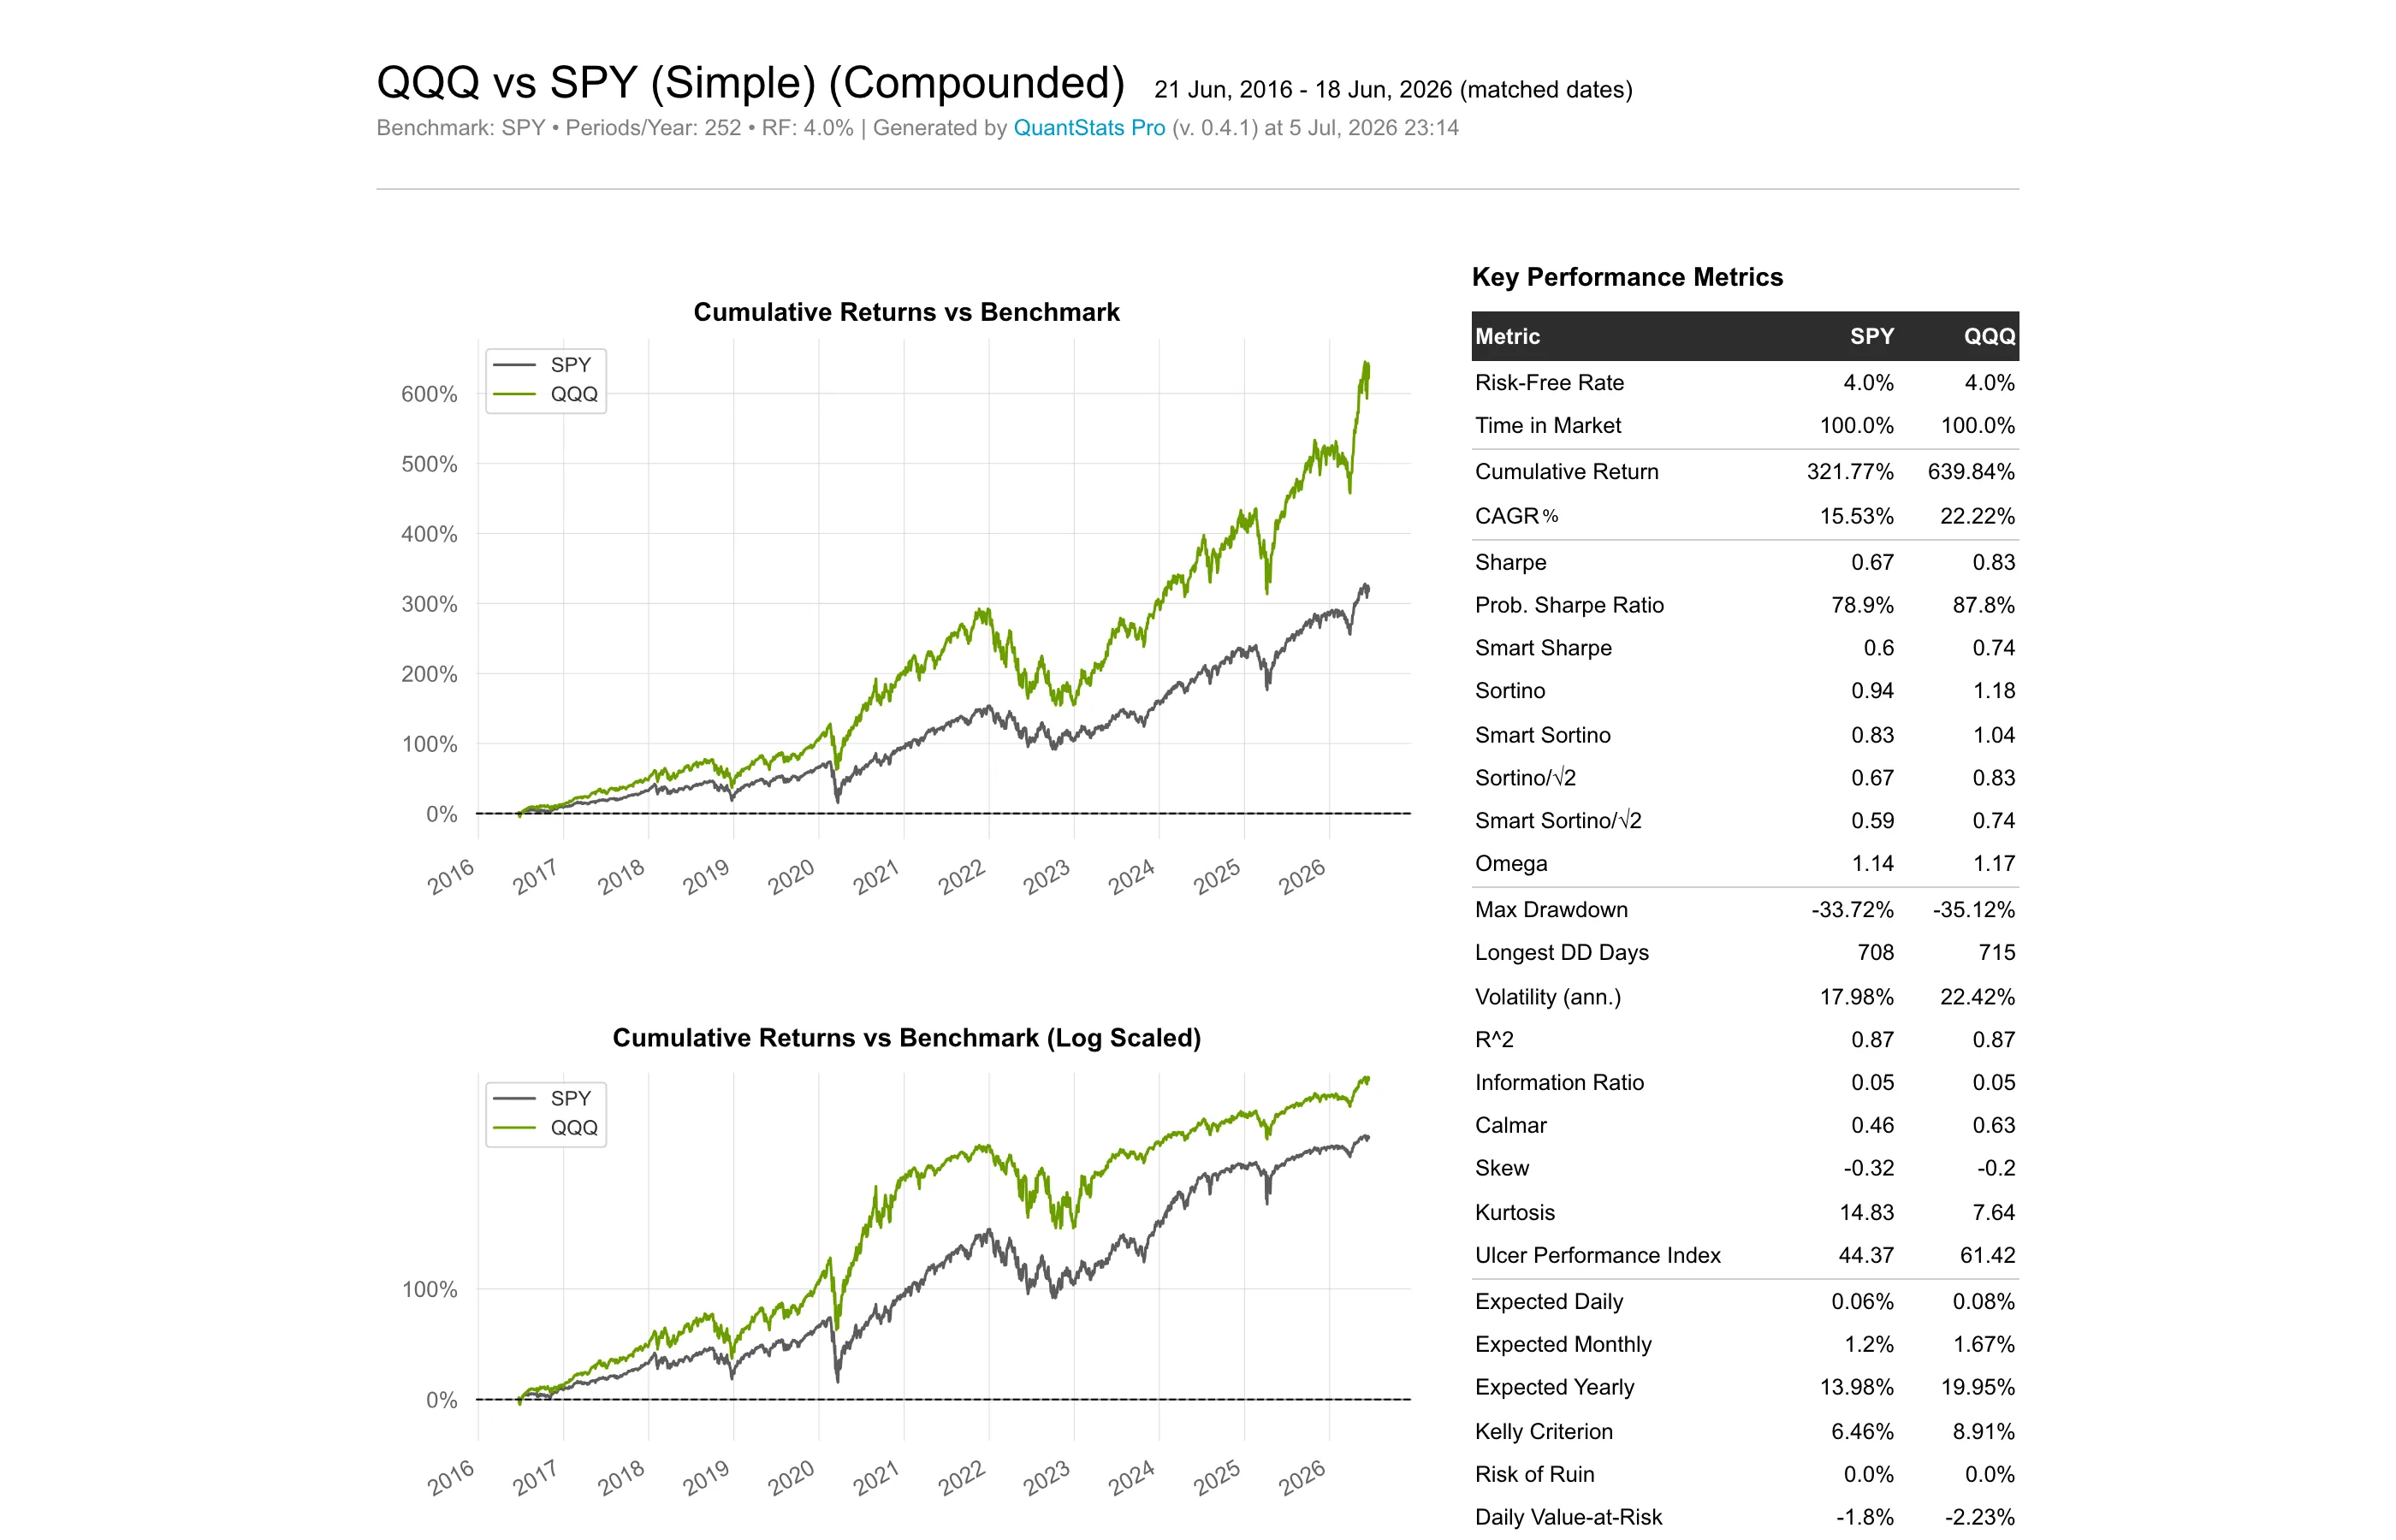
Simple tearsheet — html_simple
Focused equity-curve view with core metrics and charts. Ideal when you need a clean performance read without the full classic layout.
qs.reports.html_simple(returns, benchmark="SPY", output="qqq_simple.html")
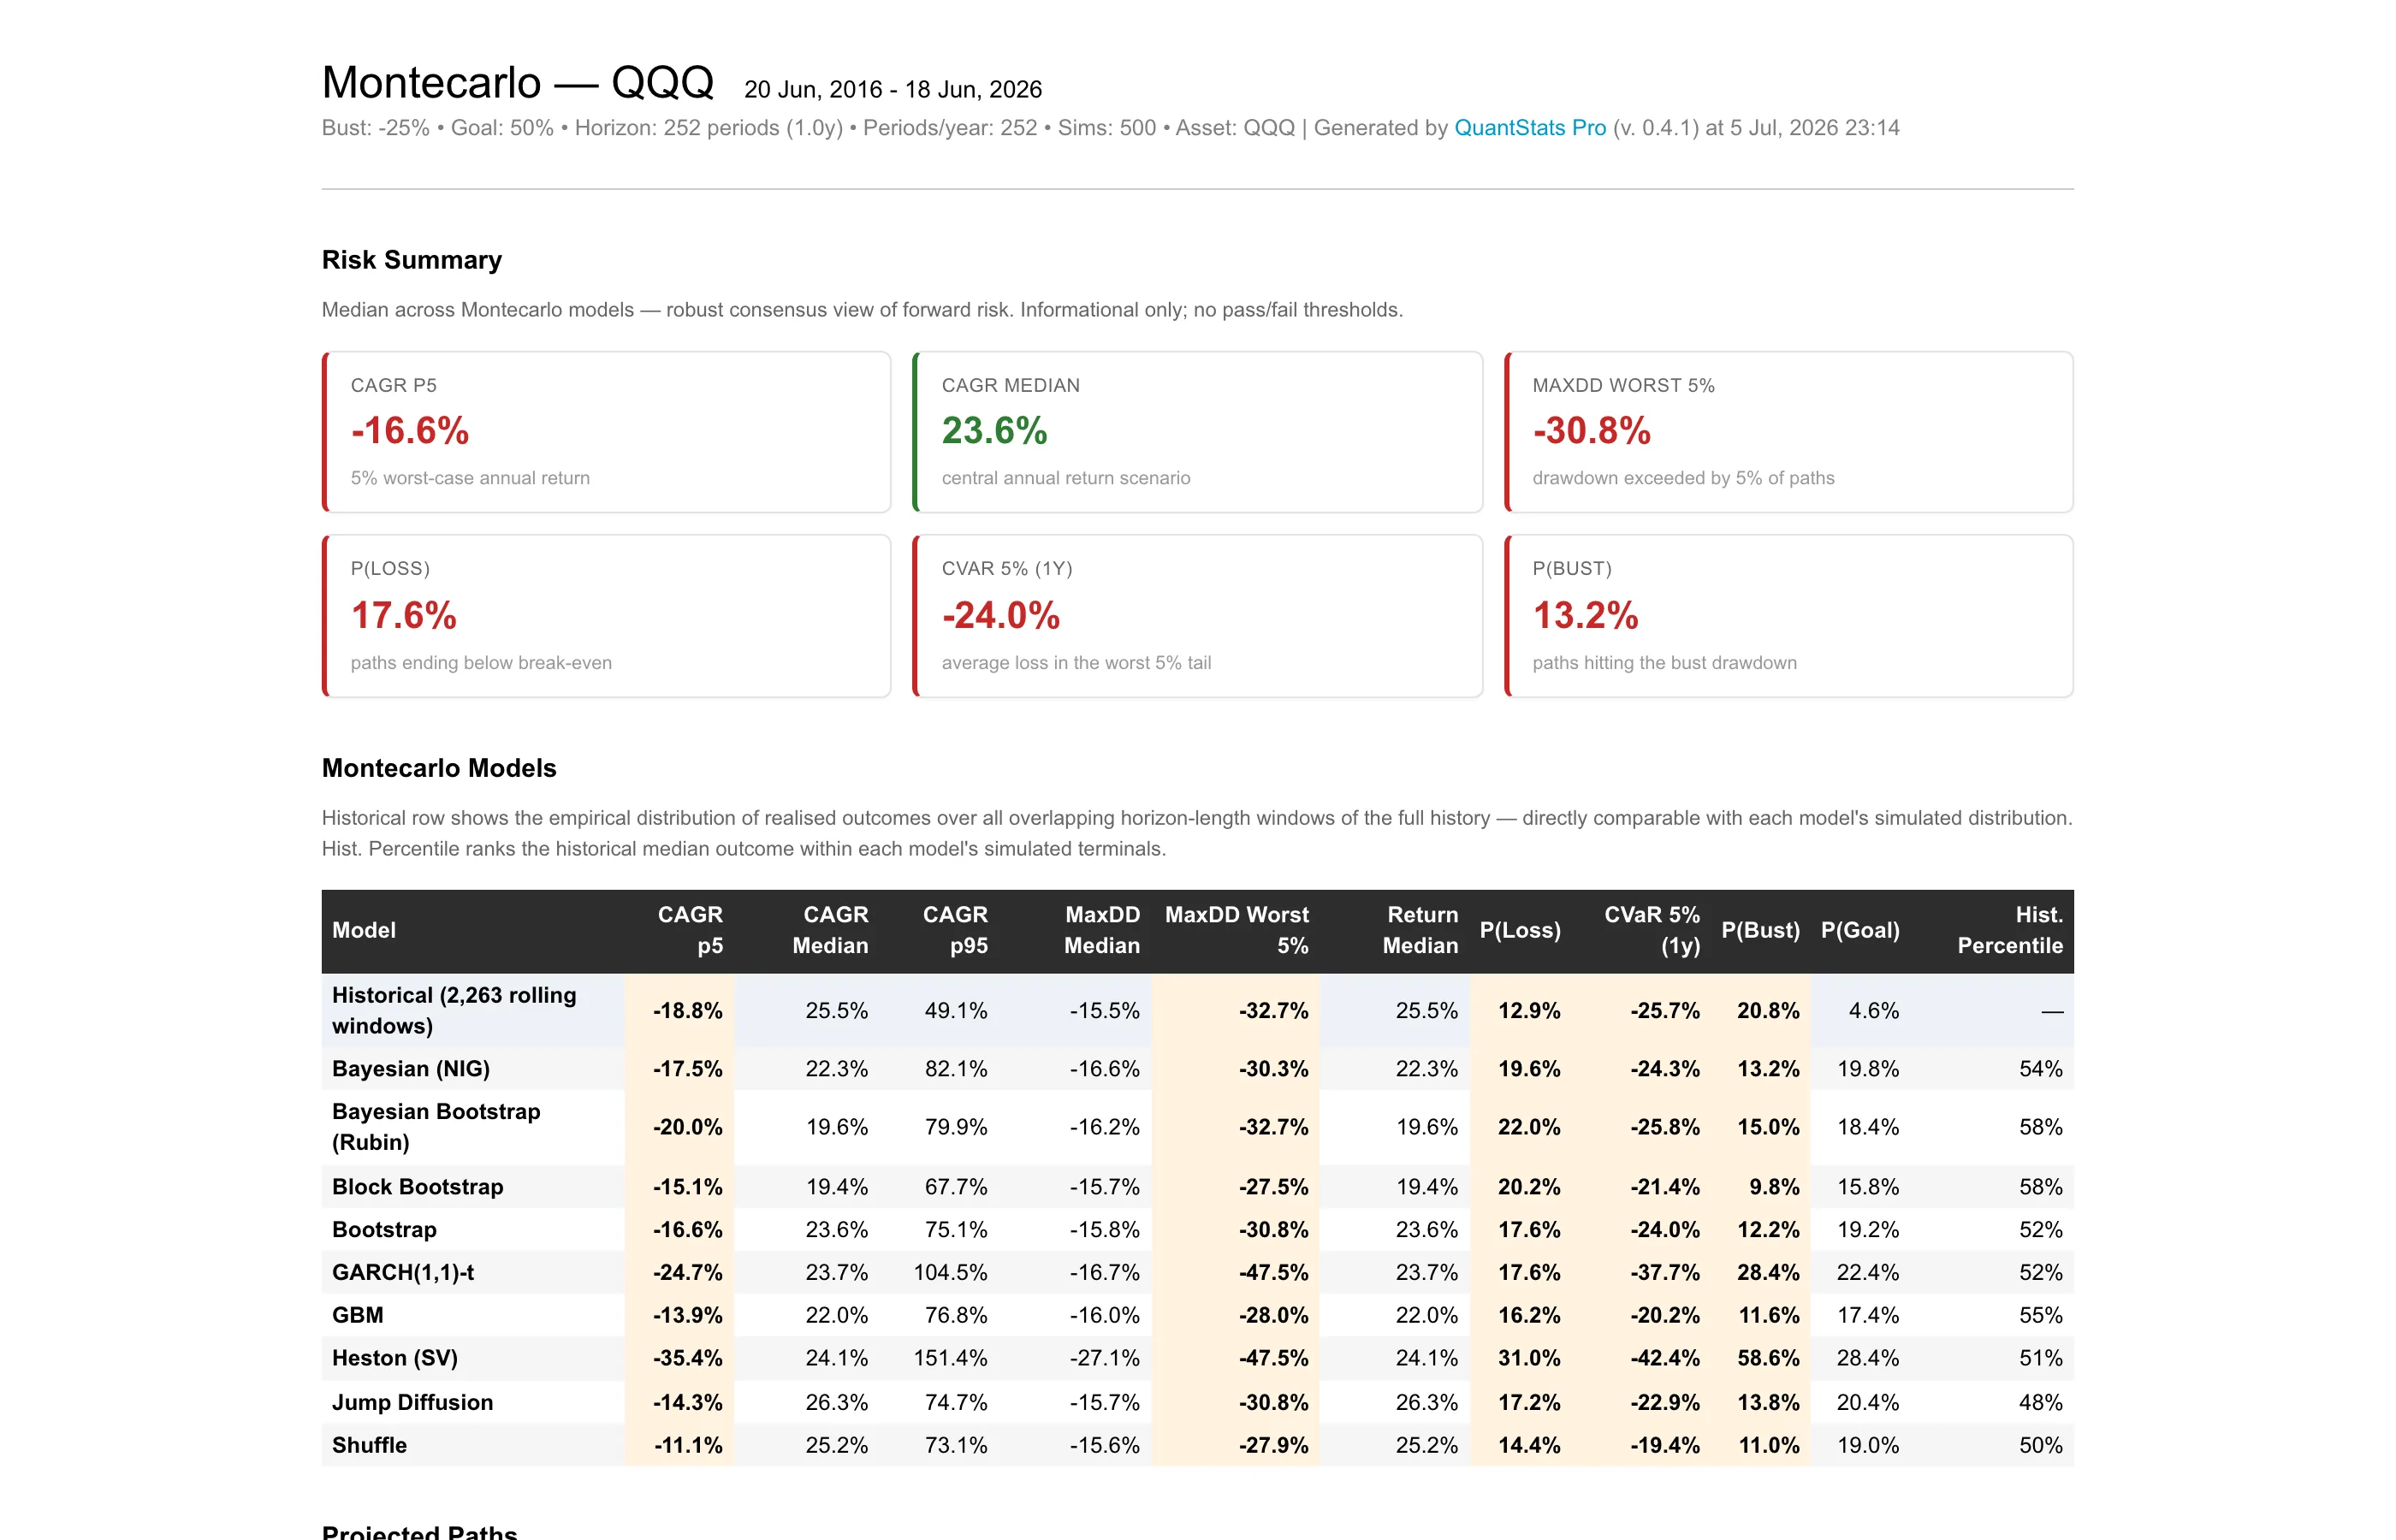
Montecarlo tearsheet — html_montecarlo
Runs multiple stochastic models in parallel, surfaces bust/goal probabilities, cross-model consensus, and a stress envelope — forward-looking risk in one report.
qs.reports.html_montecarlo(
    returns,
    bust=-0.25,   # P(Bust): drawdown threshold
    goal=0.50,    # P(Goal): terminal return target
    sims=500,
    seed=42,
    output="qqq_montecarlo.html",
)
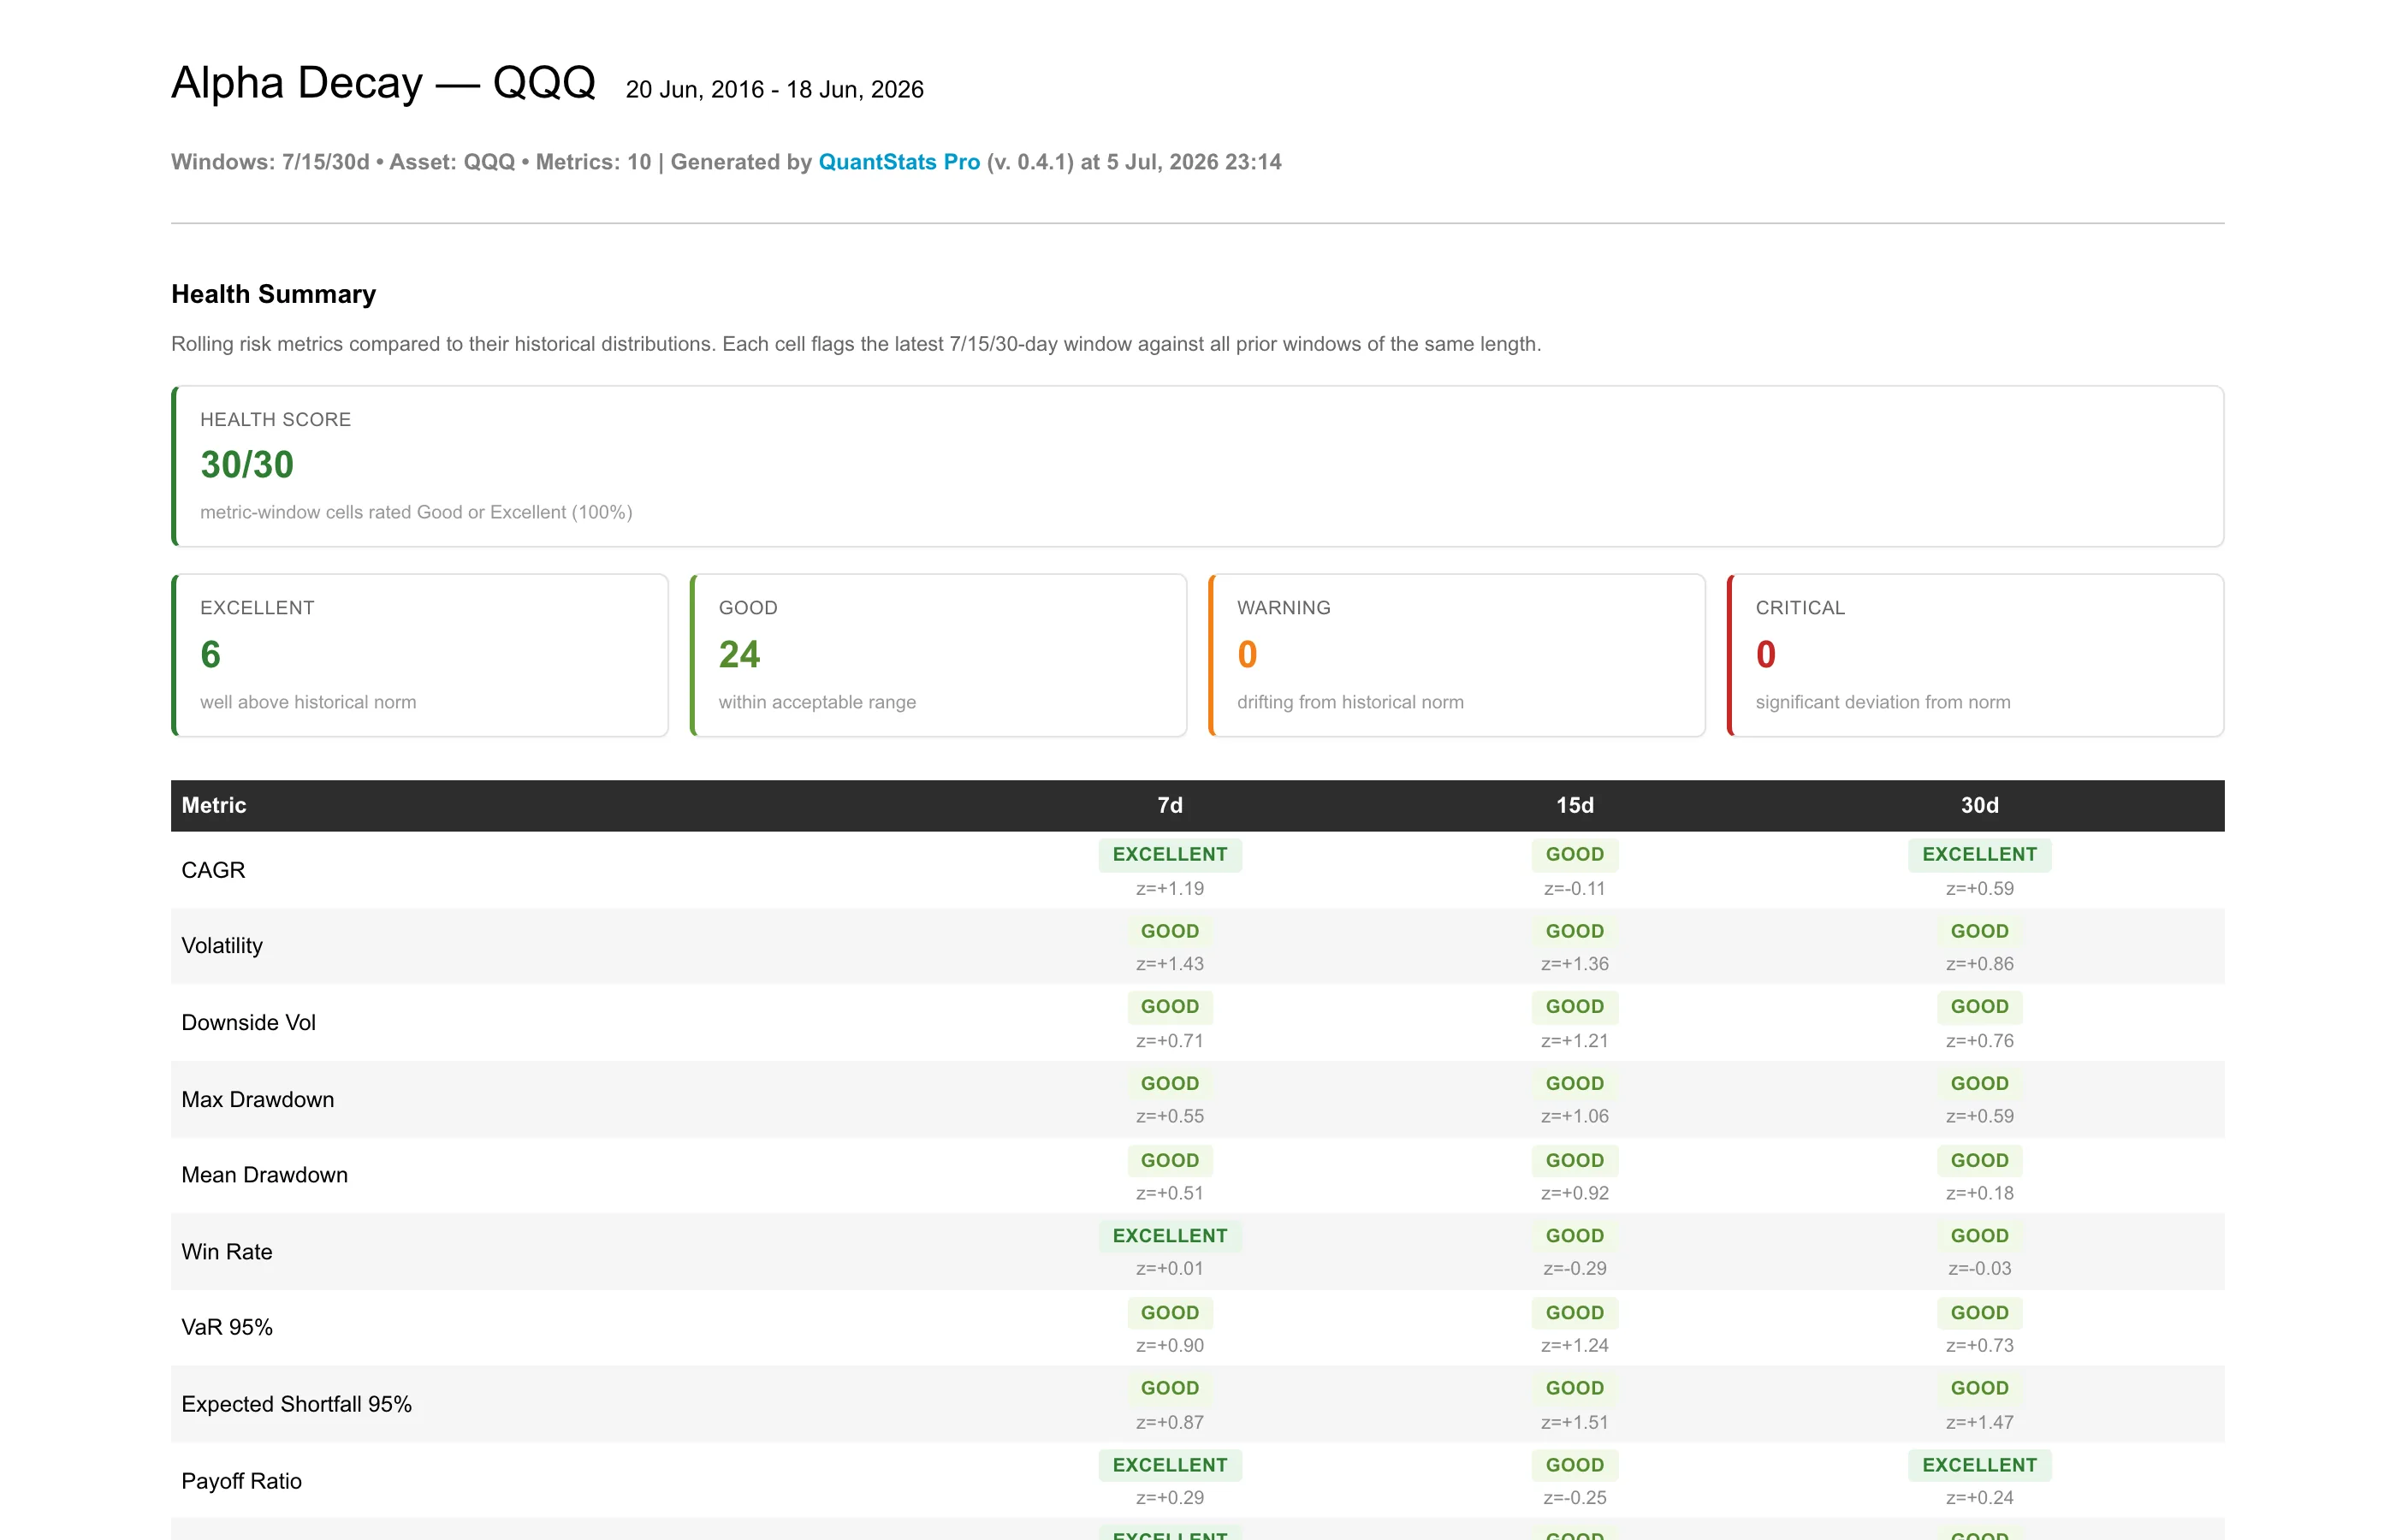
Alpha Decay tearsheet — html_alpha_decay
Rolling-window monitor for short-horizon drift: 10 metrics × 7/15/30-day windows, z-score traffic lights, CUSUM decay detection, and time-underwater analysis.
qs.reports.html_alpha_decay(
    returns,
    windows=(7, 15, 30),
    output="qqq_alpha_decay.html",
)
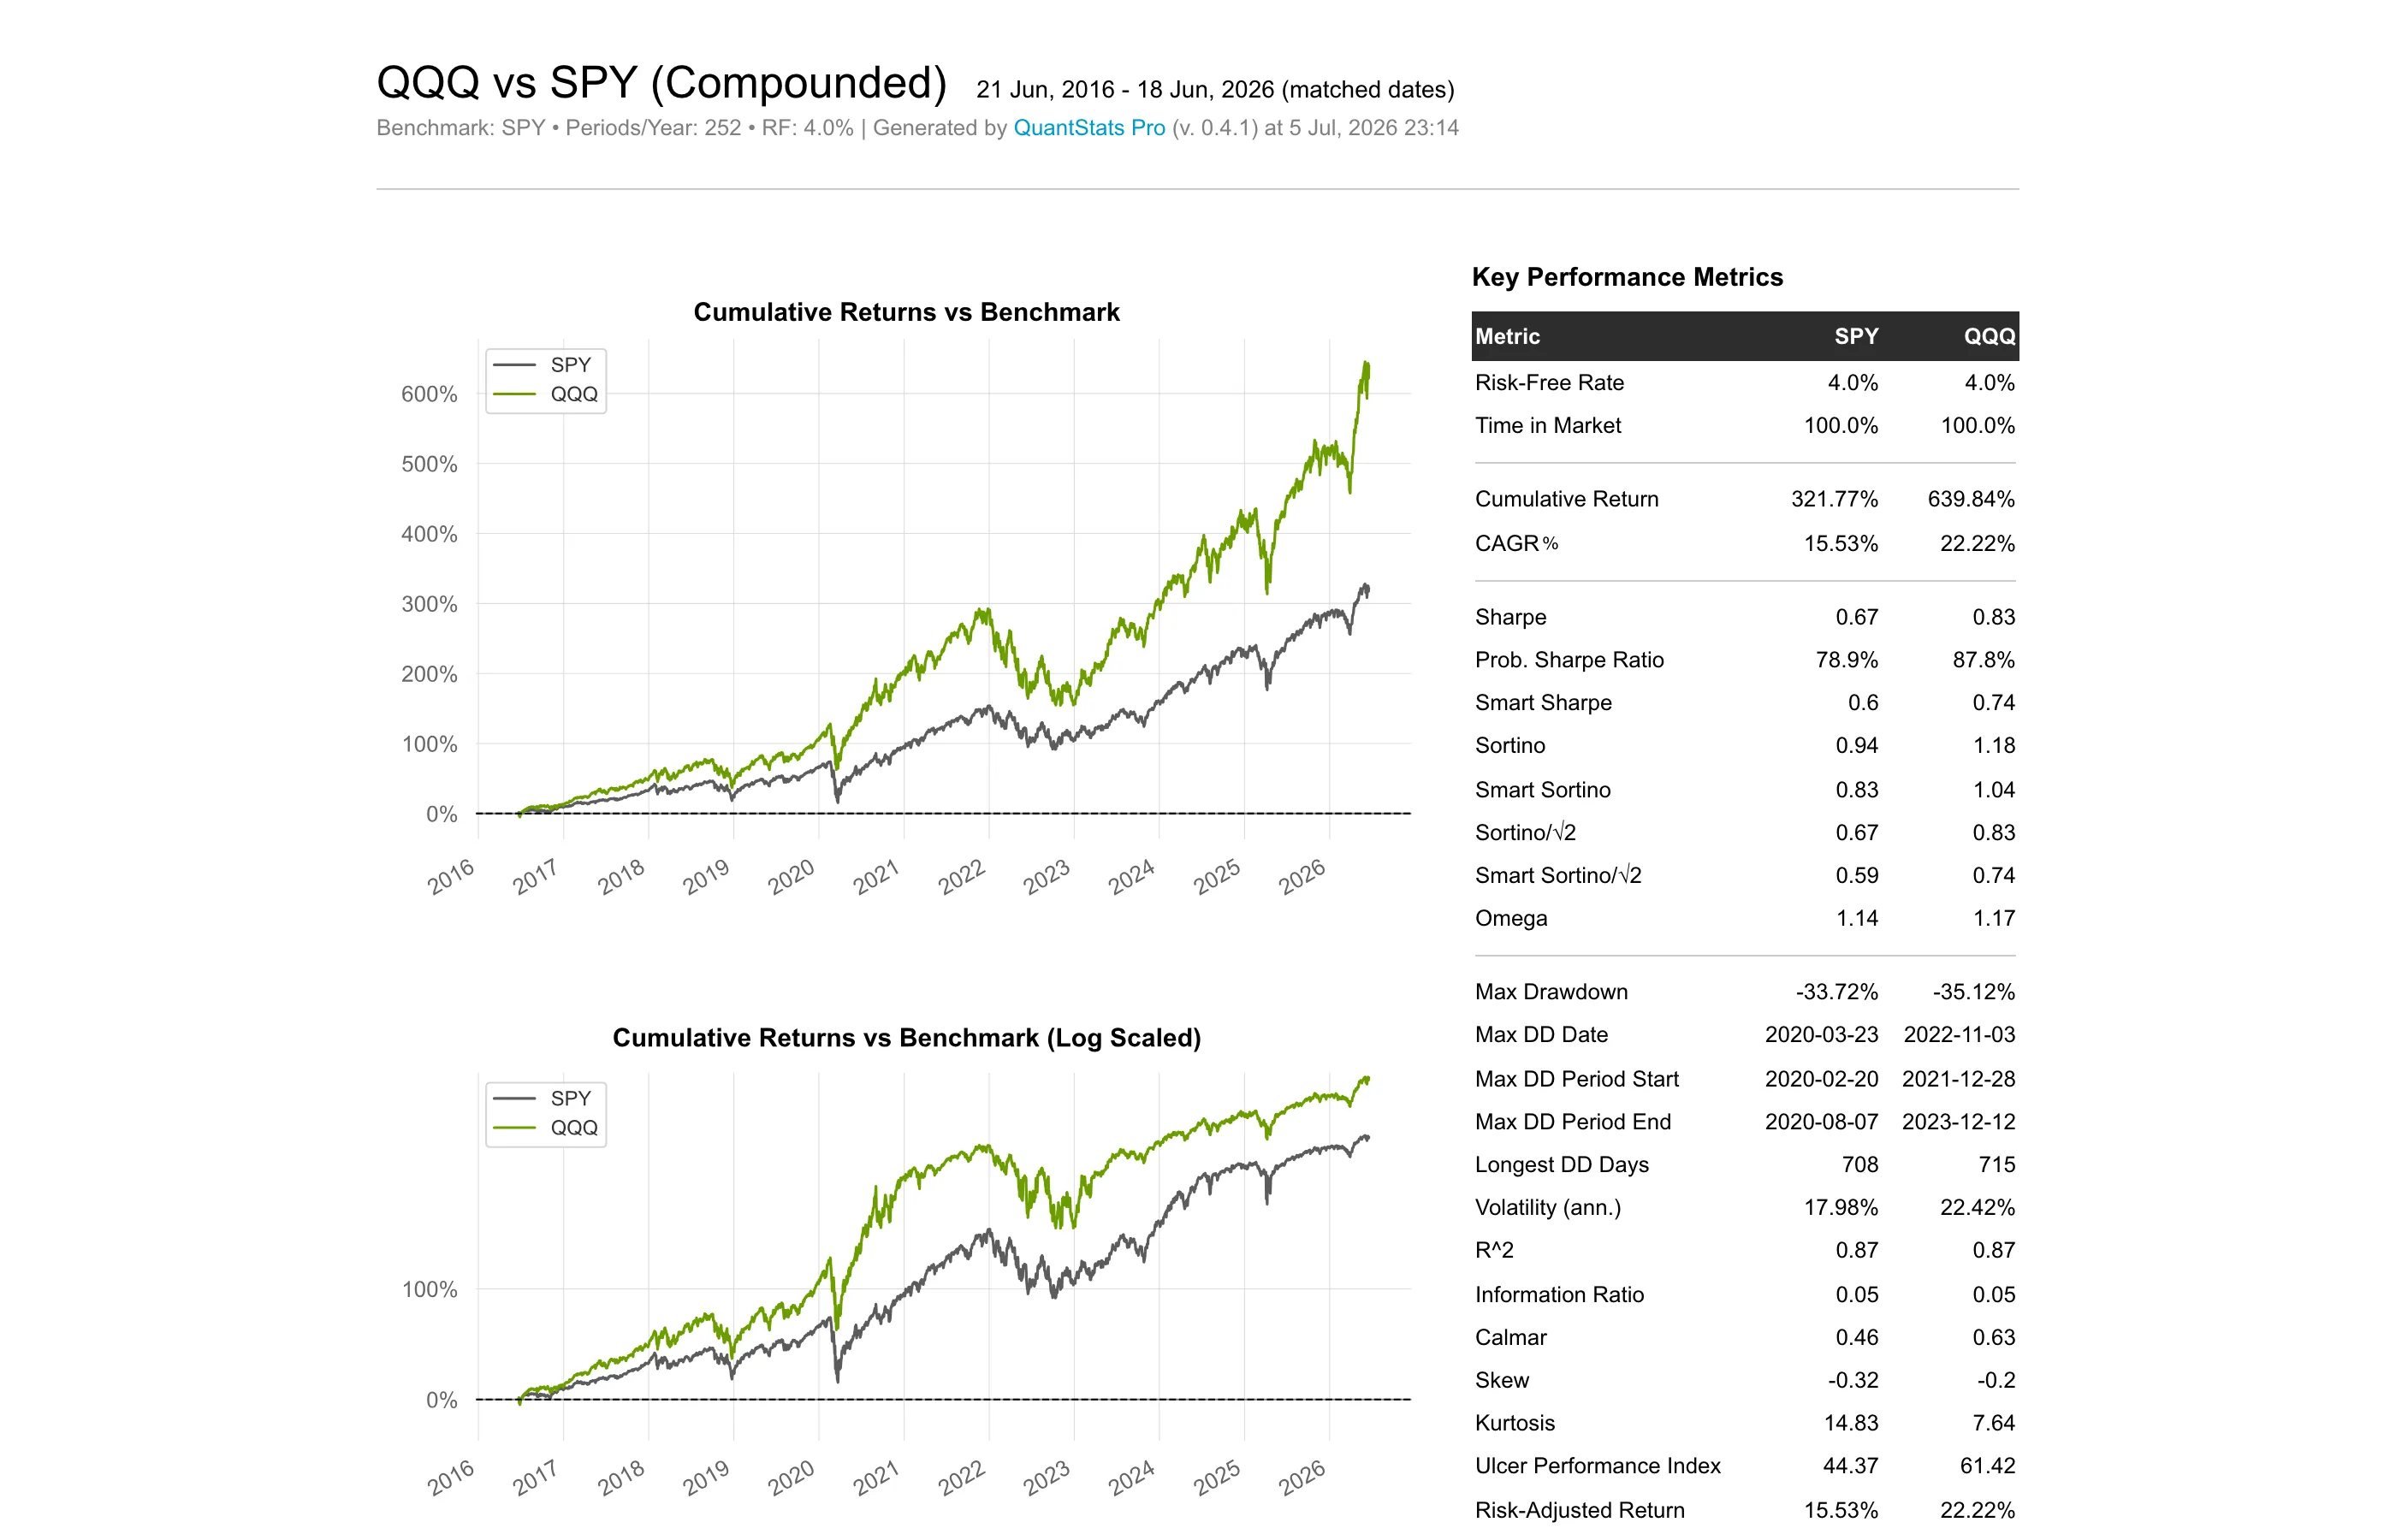
Classic full tearsheet — html
The original QuantStats report — all metrics and charts, visually redesigned in v0.2.0+.
qs.reports.html(returns, benchmark="SPY", output="qqq_full.html")
View interactive classic sample · Montecarlo docs · Alpha Decay docs
Quick Start
import quantstats as qs

qs.extend_pandas()
returns = qs.utils.download_returns("QQQ")

# Single metric
qs.stats.sharpe(returns)
returns.sharpe()  # via extend_pandas()

# Snapshot plot
qs.plots.snapshot(returns, title="QQQ Performance", show=True)

# HTML tearsheet vs benchmark
qs.reports.html(returns, "SPY", output="qqq_report.html")
qs.reports.html_simple(returns, "SPY", output="qqq_simple.html")
qs.reports.html_montecarlo(returns, output="qqq_montecarlo.html")
qs.reports.html_alpha_decay(returns, output="qqq_alpha_decay.html")
See HTML Tearsheets above for screenshots and parameter details.
Crypto and 24/7 markets
For daily crypto data, pass periods_per_year=365 to reports and stats that annualize:
returns = qs.utils.download_returns("BTC-USD")
qs.reports.html(returns, periods_per_year=365, output="btc_report.html")
qs.stats.sharpe(returns, periods=365)
Montecarlo Engine
quantstats.montecarlo characterises an asset with several stochastic models, simulates forward paths from each, and compares the distribution of outcomes (CAGR, max drawdown, bust/goal probabilities, CVaR).
Built-in models
| Model | Name | Category |
|---|---|---|
| GBM | gbm |
Montecarlo |
| Shuffle (legacy) | shuffle |
Montecarlo |
| Bootstrap | bootstrap |
Montecarlo |
| Block Bootstrap | block_bootstrap |
Montecarlo |
| Jump Diffusion (Merton) | jump_diffusion |
Montecarlo |
| GARCH(1,1)-t | garch |
Montecarlo |
| Heston (SV) | heston |
Montecarlo |
| Bayesian (NIG) | bayesian |
Montecarlo |
| Bayesian Bootstrap | bayesian_bootstrap |
Montecarlo |
| Trimmed Bootstrap (top 1%) | trimmed_1pct |
Stress |
Programmatic API
from quantstats.montecarlo import run_models, available_models
from quantstats.montecarlo import analytics as mca

print(available_models())
# ['bayesian', 'bayesian_bootstrap', 'block_bootstrap', 'bootstrap', ...]

results = run_models(
    returns,
    models=["gbm", "garch", "bootstrap"],
    horizon=252,      # 1 year (default: periods_per_year)
    sims=1000,
    bust=-0.25,
    goal=0.50,
    seed=42,
)

# Per-model summary row
gbm = results["gbm"]
print(gbm.summary)          # cagr_p5, cagr_median, maxdd_p95, prob_loss, cvar_5, …
print(gbm.sim_returns.shape)  # (horizon, sims)

# Cross-model consensus and stress envelope
median = mca.model_median_summary(results)
envelope = mca.conservative_envelope(results)
hist = mca.historical_summary(returns, horizon=252)
Legacy shuffle Montecarlo
The original upstream API still works — random permutation of historical returns:
mc = qs.stats.montecarlo(returns, sims=1000, bust=-0.20, goal=0.50, seed=42)
print(f"Bust probability: {mc.bust_probability:.1%}")
print(f"Goal probability: {mc.goal_probability:.1%}")
mc.plot()
Full Montecarlo documentation »
Alpha Decay Monitor
quantstats.alphadecay tracks whether a strategy's short-term risk profile is drifting from its historical norm. It computes 10 rolling metrics over configurable windows (default 7/15/30 days):
CAGR · Volatility · Downside Vol · Max Drawdown · Mean Drawdown · Win Rate · VaR 95% · Expected Shortfall 95% · Payoff Ratio · Skew
Each metric-window cell gets a traffic-light status (Excellent / Good / Warning / Critical) based on z-scores computed on a per-metric analysis scale (log transforms for skewed metrics). The tearsheet also includes:
- Health score — count of Good/Excellent cells
- CUSUM return-decay detector
- Time underwater duration analysis
- Per-metric distribution charts with current observation vs historical mean
Programmatic API
from quantstats.alphadecay import analyze, available_metrics

print(available_metrics())
# ['cagr', 'volatility', 'downside_vol', 'max_drawdown', ...]

result = analyze(
    returns,
    windows=(7, 15, 30),
    rf=0.0,
    periods=252,
)

print(f"Health: {result.score}/{result.total} ({result.score_pct:.0f}%)")

for metric in result.metrics:
    wr = metric.windows[30]  # latest 30-day window
    print(f"{metric.spec.label}: z={wr.z_score:+.2f} → {wr.status}")
Generate the full HTML tearsheet with qs.reports.html_alpha_decay(returns).
API reference
QuantStats Pro exposes 50+ stats, 15+ plot types, and 4 HTML report generators. Explore the full API interactively:
[f for f in dir(qs.stats) if not f.startswith("_")]
[f for f in dir(qs.plots) if not f.startswith("_")]
help(qs.stats.sharpe)
Notebook / console helpers:
qs.reports.metrics(returns, mode="full")   # metrics table
qs.reports.plots(returns, mode="full")     # all plots
qs.reports.basic(returns)                  # basic metrics + plots
qs.reports.full(returns)                   # full metrics + plots
See Montecarlo documentation and help(qs.stats.<method>) for parameter details.
Period-based vs trade-based metrics
QuantStats analyzes return series (daily, weekly, monthly returns), not discrete trade data. This means:
- Win Rate = percentage of periods with positive returns
- Consecutive Wins/Losses = consecutive positive/negative return periods
- Payoff Ratio = average winning period return / average losing period return
- Profit Factor = sum of positive returns / sum of negative returns
These metrics are valid and useful for systematic strategies, return-series analysis, and period-by-period comparison. For discretionary traders with multi-day trades, period-based stats may differ from trade-level statistics — consistent with how Sharpe, Sortino, and drawdown metrics operate on return periods.
Installation
pip install quantstats-pro --upgrade
Requirements
- Python >= 3.10
- pandas >= 1.5.0
- numpy >= 1.24.0
- scipy >= 1.11.0
- matplotlib >= 3.7.0
- seaborn >= 0.13.0
- tabulate >= 0.9.0
- yfinance >= 0.2.40
- arch >= 6.0 (GARCH calibration for Montecarlo)
- plotly >= 5.0.0 (optional, for using
plots.to_plotly())
Questions?
If you find a bug, please open an issue.
Contributions welcome — check open issues or upstream QuantStats issues for bugs we're tracking.
Known limitations
When saving the monthly returns heatmap via savefig={...}, the figure may still be displayed in addition to being written to disk. Pass show=False explicitly where supported.
Legal Stuff
QuantStats Pro is a fork of QuantStats by Ran Aroussi, distributed under the Apache Software License. See LICENSE.txt for details.
Credits
QuantStats Pro — maintained by Diego Alvarez
QuantStats (original) — Ran Aroussi
Project details
Verified details
These details have been verified by PyPIProject links
GitHub Statistics
Maintainers


Download files
Download the file for your platform. If you're not sure which to choose, learn more about installing packages.
Source Distribution
Built Distribution
Filter files by name, interpreter, ABI, and platform.
If you're not sure about the file name format, learn more about wheel file names.
Copy a direct link to the current filters
File details
Details for the file quantstats_pro-0.4.4.tar.gz.
File metadata
- Download URL: quantstats_pro-0.4.4.tar.gz
- Upload date:
- Size: 130.9 kB
- Tags: Source
- Uploaded using Trusted Publishing? Yes
- Uploaded via: twine/6.1.0 CPython/3.13.12
File hashes
| Algorithm | Hash digest | |
|---|---|---|
| SHA256 |
a06dc2f4892e284e2c58cb05f1aaf315b0ab868f5a07d11175b4dc75b655d5de
|
|
| MD5 |
0b0c37b9f5870f47adb1d6245e8bc39e
|
|
| BLAKE2b-256 |
8b27b3c7b79c66b27a5e41d98531c784cc3e98bcb1fa18bd2875ceb3306472ad
|
Provenance
The following attestation bundles were made for quantstats_pro-0.4.4.tar.gz:
Publisher:
python-publish.yml on diegoalvarezmgl/quantstats-pro
-
Statement:
-
Statement type:
https://in-toto.io/Statement/v1 -
Predicate type:
https://docs.pypi.org/attestations/publish/v1 -
Subject name:
quantstats_pro-0.4.4.tar.gz -
Subject digest:
a06dc2f4892e284e2c58cb05f1aaf315b0ab868f5a07d11175b4dc75b655d5de - Sigstore transparency entry: 2083093586
- Sigstore integration time:
-
Permalink:
diegoalvarezmgl/quantstats-pro@995baeeb755ba328763342faa187b26475970f55 -
Branch / Tag:
refs/tags/v0.4.4 - Owner: https://github.com/diegoalvarezmgl
-
Access:
public
-
Token Issuer:
https://token.actions.githubusercontent.com -
Runner Environment:
github-hosted -
Publication workflow:
python-publish.yml@995baeeb755ba328763342faa187b26475970f55 -
Trigger Event:
release
-
Statement type:
File details
Details for the file quantstats_pro-0.4.4-py3-none-any.whl.
File metadata
- Download URL: quantstats_pro-0.4.4-py3-none-any.whl
- Upload date:
- Size: 144.0 kB
- Tags: Python 3
- Uploaded using Trusted Publishing? Yes
- Uploaded via: twine/6.1.0 CPython/3.13.12
File hashes
| Algorithm | Hash digest | |
|---|---|---|
| SHA256 |
668b8ad7f5f11821ddabbc8fc0e789a9e40ab189601f3328b11a6a913a69529a
|
|
| MD5 |
02cd259062e5cfafca56e8f294c88720
|
|
| BLAKE2b-256 |
42718b094dc1c4ba915a032122457a3be7b95bc91dae99e4ad308d4f6504074f
|
Provenance
The following attestation bundles were made for quantstats_pro-0.4.4-py3-none-any.whl:
Publisher:
python-publish.yml on diegoalvarezmgl/quantstats-pro
-
Statement:
-
Statement type:
https://in-toto.io/Statement/v1 -
Predicate type:
https://docs.pypi.org/attestations/publish/v1 -
Subject name:
quantstats_pro-0.4.4-py3-none-any.whl -
Subject digest:
668b8ad7f5f11821ddabbc8fc0e789a9e40ab189601f3328b11a6a913a69529a - Sigstore transparency entry: 2083093597
- Sigstore integration time:
-
Permalink:
diegoalvarezmgl/quantstats-pro@995baeeb755ba328763342faa187b26475970f55 -
Branch / Tag:
refs/tags/v0.4.4 - Owner: https://github.com/diegoalvarezmgl
-
Access:
public
-
Token Issuer:
https://token.actions.githubusercontent.com -
Runner Environment:
github-hosted -
Publication workflow:
python-publish.yml@995baeeb755ba328763342faa187b26475970f55 -
Trigger Event:
release
-
Statement type:






