






QuantStats: Portfolio analytics for quants
QuantStats Python library that performs portfolio profiling, allowing quants and portfolio managers to understand their performance better by providing them with in-depth analytics and risk metrics.
QuantStats is comprised of 3 main modules:
quantstats.stats- for calculating various performance metrics, like Sharpe ratio, Win rate, Volatility, etc.quantstats.plots- for visualizing performance, drawdowns, rolling statistics, monthly returns, etc.quantstats.reports- for generating metrics reports, batch plotting, and creating tear sheets that can be saved as an HTML file.
NEW! Monte Carlo Simulations
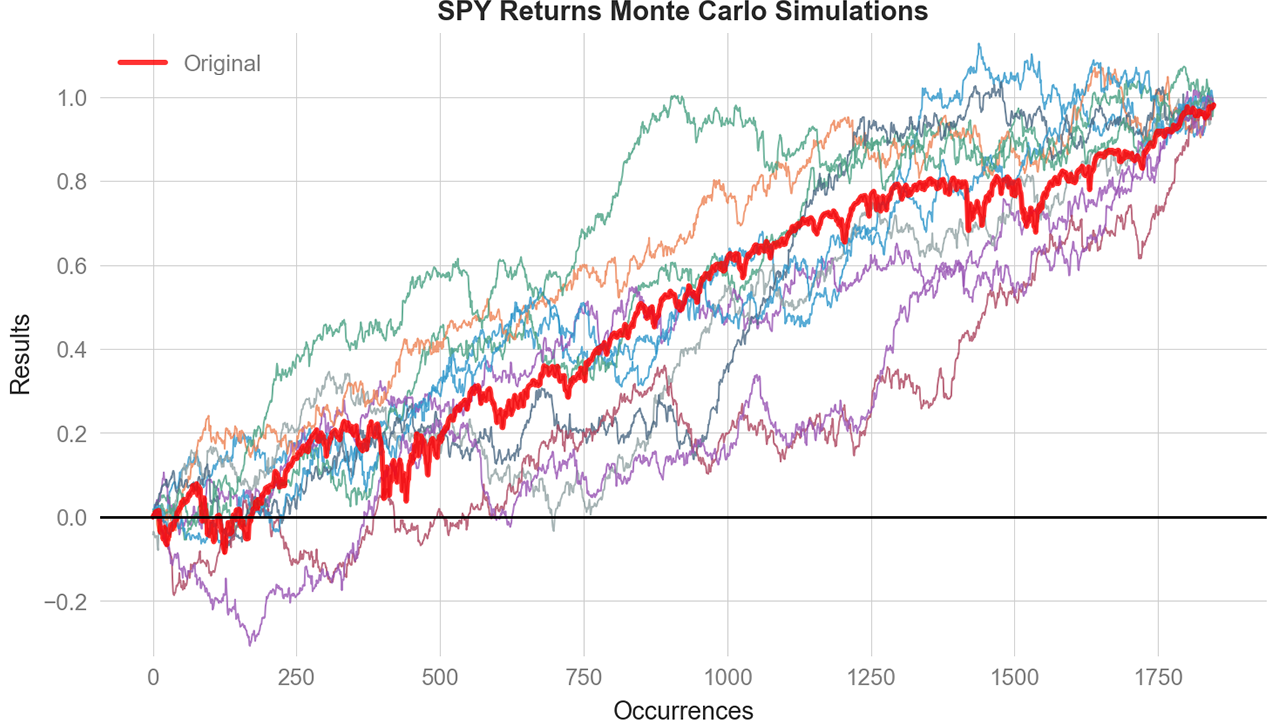
Run probabilistic risk analysis with built-in Monte Carlo simulations:
mc = qs.stats.montecarlo(returns, sims=1000, bust=-0.20, goal=0.50)
print(f"Bust probability: {mc.bust_probability:.1%}")
print(f"Goal probability: {mc.goal_probability:.1%}")
mc.plot()
Full Monte Carlo documentation »
Quick Start
%matplotlib inline
import quantstats as qs

# extend pandas functionality with metrics, etc.
qs.extend_pandas()

# fetch the daily returns for a stock
stock = qs.utils.download_returns('META')

# show sharpe ratio
qs.stats.sharpe(stock)

# or using extend_pandas() :)
stock.sharpe()
Output:
0.7604779884378278
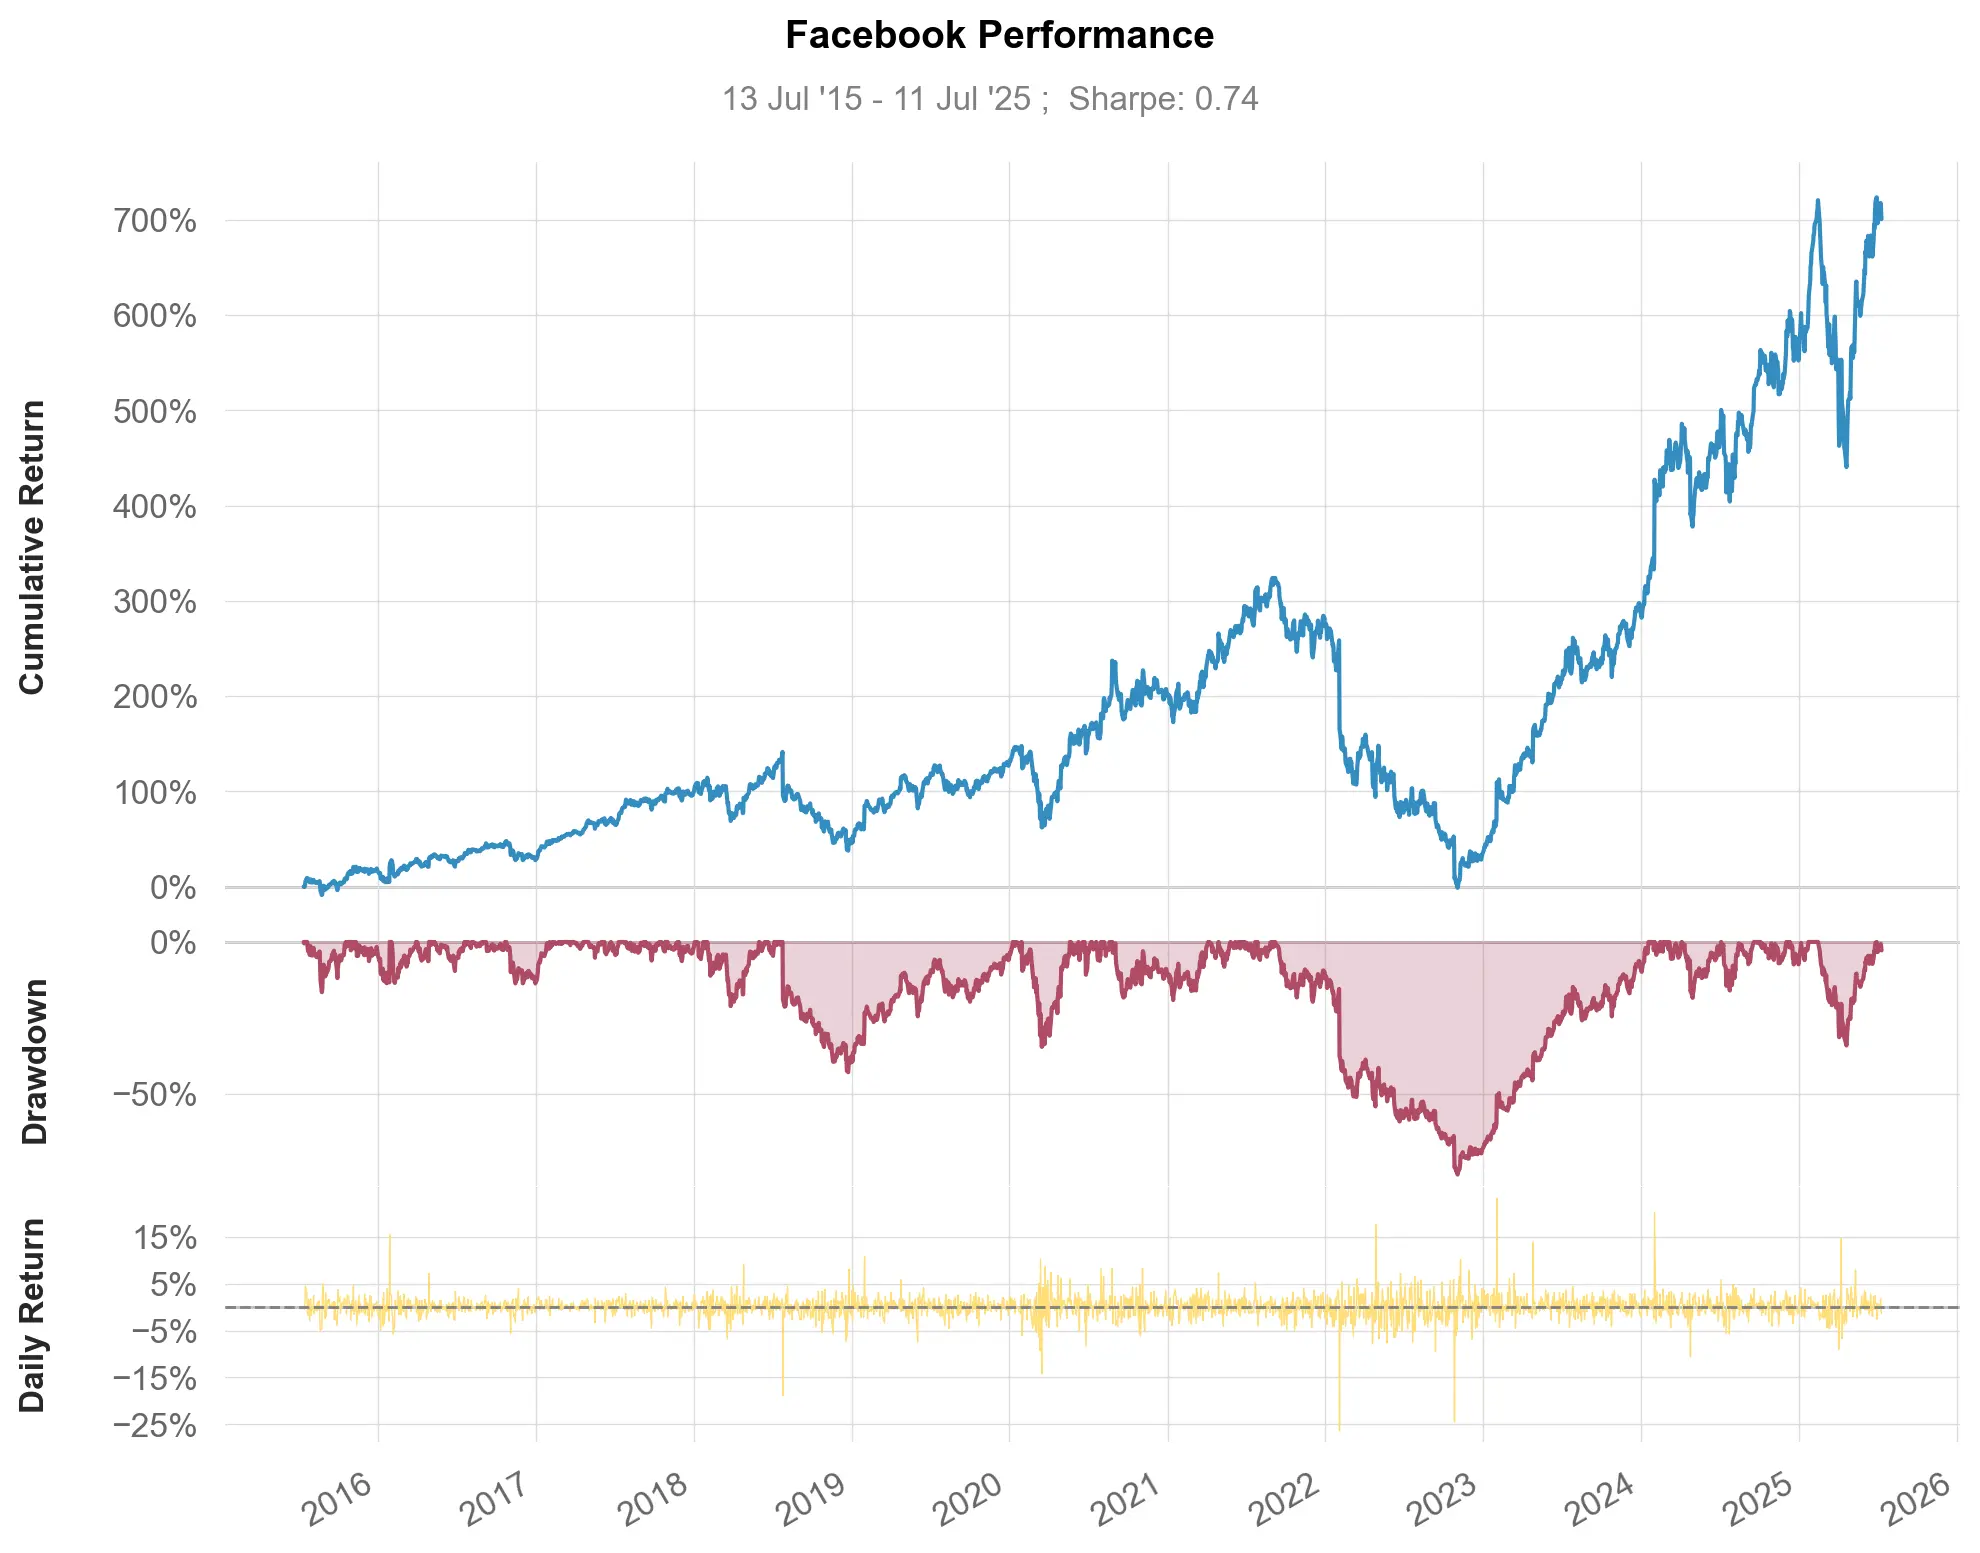
Visualize stock performance
qs.plots.snapshot(stock, title='Facebook Performance', show=True)

# can also be called via:
# stock.plot_snapshot(title='Facebook Performance', show=True)
Output:
Creating a report
You can create 7 different report tearsheets:
qs.reports.metrics(mode='basic|full", ...)- shows basic/full metricsqs.reports.plots(mode='basic|full", ...)- shows basic/full plotsqs.reports.basic(...)- shows basic metrics and plotsqs.reports.full(...)- shows full metrics and plotsqs.reports.html(...)- generates a complete report as html
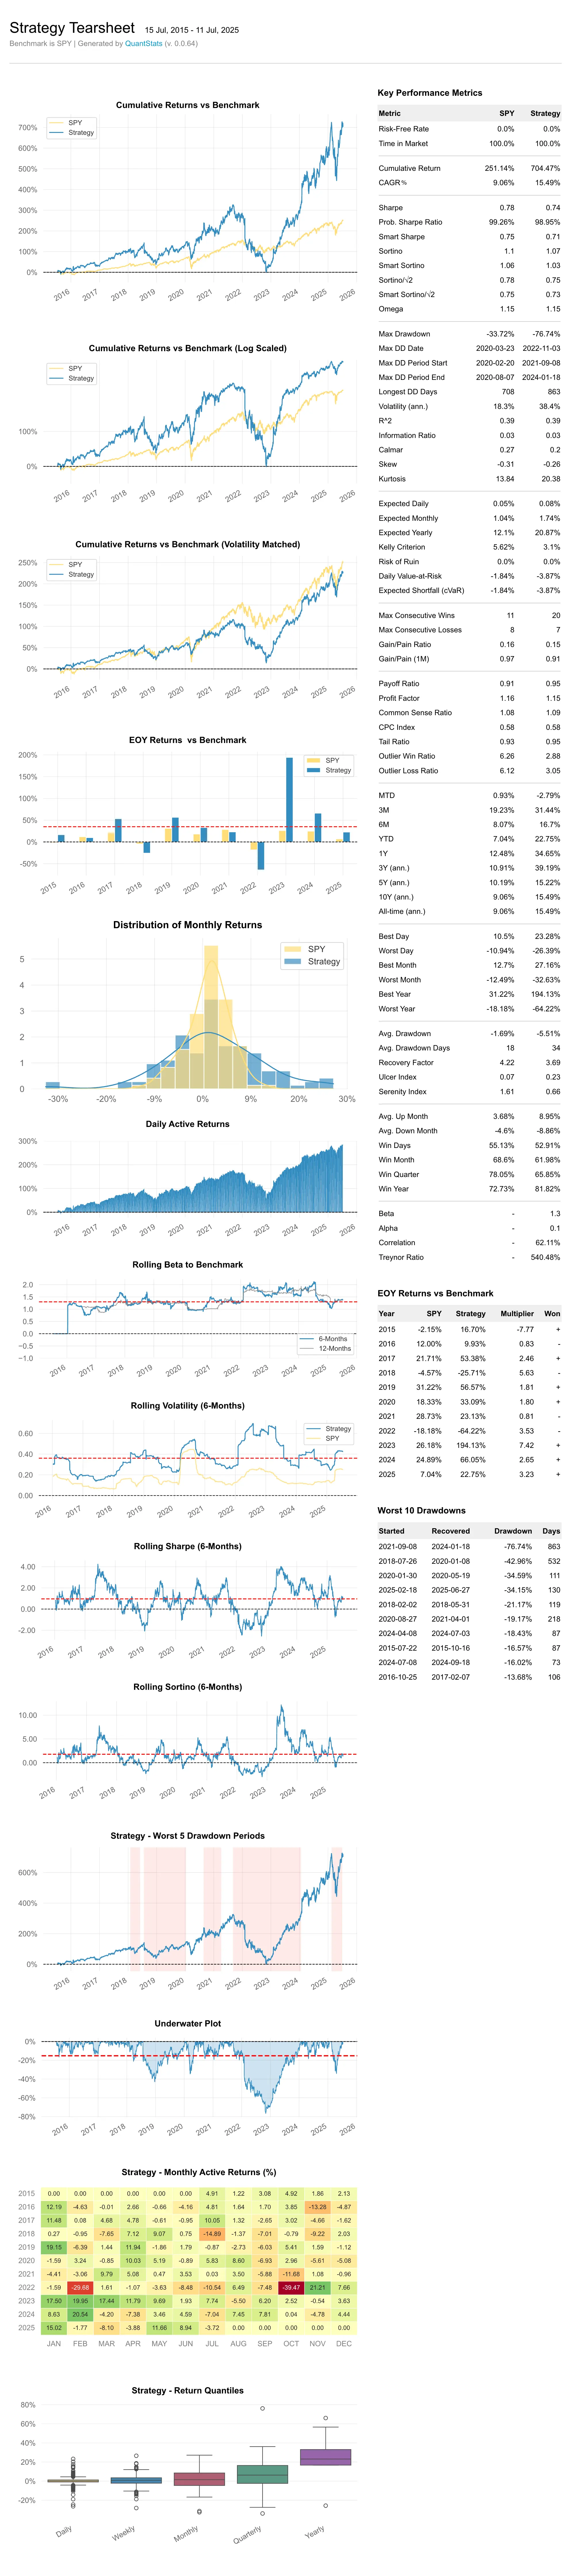
Let's create an html tearsheet:
# benchmark can be a pandas Series or ticker
qs.reports.html(stock, "SPY")
Output will generate something like this:
Available methods
To view a complete list of available methods, run:
[f for f in dir(qs.stats) if f[0] != '_']
['avg_loss',
 'avg_return',
 'avg_win',
 'best',
 'cagr',
 'calmar',
 'common_sense_ratio',
 'comp',
 'compare',
 'compsum',
 'conditional_value_at_risk',
 'consecutive_losses',
 'consecutive_wins',
 'cpc_index',
 'cvar',
 'drawdown_details',
 'expected_return',
 'expected_shortfall',
 'exposure',
 'gain_to_pain_ratio',
 'geometric_mean',
 'ghpr',
 'greeks',
 'implied_volatility',
 'information_ratio',
 'kelly_criterion',
 'kurtosis',
 'max_drawdown',
 'monthly_returns',
 'montecarlo',
 'montecarlo_cagr',
 'montecarlo_drawdown',
 'montecarlo_sharpe',
 'outlier_loss_ratio',
 'outlier_win_ratio',
 'outliers',
 'payoff_ratio',
 'profit_factor',
 'profit_ratio',
 'r2',
 'r_squared',
 'rar',
 'recovery_factor',
 'remove_outliers',
 'risk_of_ruin',
 'risk_return_ratio',
 'rolling_greeks',
 'ror',
 'sharpe',
 'skew',
 'sortino',
 'adjusted_sortino',
 'tail_ratio',
 'to_drawdown_series',
 'ulcer_index',
 'ulcer_performance_index',
 'upi',
 'value_at_risk',
 'var',
 'volatility',
 'win_loss_ratio',
 'win_rate',
 'worst']
[f for f in dir(qs.plots) if f[0] != '_']
['daily_returns',
 'distribution',
 'drawdown',
 'drawdowns_periods',
 'earnings',
 'histogram',
 'log_returns',
 'monthly_heatmap',
 'montecarlo',
 'montecarlo_distribution',
 'returns',
 'rolling_beta',
 'rolling_sharpe',
 'rolling_sortino',
 'rolling_volatility',
 'snapshot',
 'yearly_returns']
*** Full documentation coming soon ***
Important: Period-Based vs Trade-Based Metrics
QuantStats analyzes return series (daily, weekly, monthly returns), not discrete trade data. This means:
- Win Rate = percentage of periods with positive returns
- Consecutive Wins/Losses = consecutive positive/negative return periods
- Payoff Ratio = average winning period return / average losing period return
- Profit Factor = sum of positive returns / sum of negative returns
These metrics are valid and useful for:
- Systematic/algorithmic strategies with regular rebalancing
- Analyzing return-series behavior over time
- Comparing strategies on a period-by-period basis
For discretionary traders with multi-day trades, these period-based metrics may differ from trade-level statistics. A single 5-day trade might span 3 positive days and 2 negative days - QuantStats would count these as 3 "wins" and 2 "losses" at the daily level.
This is consistent with how all return-based analytics work (Sharpe ratio, Sortino ratio, drawdown analysis, etc.) - they operate on return periods, not discrete trade entries/exits.
In the meantime, you can get insights as to optional parameters for each method, by using Python's help method:
help(qs.stats.conditional_value_at_risk)
Help on function conditional_value_at_risk in module quantstats.stats:

conditional_value_at_risk(returns, sigma=1, confidence=0.95, prepare_returns=True, method='parametric')
    Calculate the Conditional Value at Risk (CVaR), also known as Expected Shortfall.

    CVaR measures the expected loss given that a loss exceeds the VaR threshold.
    It quantifies the amount of tail risk an investment faces, providing a more
    comprehensive risk measure than VaR alone.
Installation
Install using pip:
$ pip install quantstats --upgrade --no-cache-dir
Install using conda:
$ conda install -c ranaroussi quantstats
Requirements
- Python >= 3.10
- pandas >= 1.5.0
- numpy >= 1.24.0
- scipy >= 1.11.0
- matplotlib >= 3.7.0
- seaborn >= 0.13.0
- tabulate >= 0.9.0
- yfinance >= 0.2.40
- plotly >= 5.0.0 (optional, for using
plots.to_plotly())
Questions?
This is a new library... If you find a bug, please open an issue.
If you'd like to contribute, a great place to look is the issues marked with help-wanted.
Known Issues
For some reason, I couldn't find a way to tell seaborn not to return the
monthly returns heatmap when instructed to save - so even if you save the plot (by passing savefig={...}) it will still show the plot.
Legal Stuff
QuantStats is distributed under the Apache Software License. See the LICENSE.txt file in the release for details.
P.S.
Please drop me a note with any feedback you have.
Ran Aroussi
1 maintainer

Metadata
1 maintainer
Release files for quantstats 0.0.86
For a detailed explanation of source distributions (sdists) and built distributions (wheels), please see the package formats documentation.
Source distribution (sdist)
| File | Size | Uploaded | |
|---|---|---|---|
| quantstats-0.0.86.tar.gz | 99.1 kB | Details |
Built distribution (wheel)
| File | Interpreter | ABI | Platform | Reset |
|---|---|---|---|---|
| quantstats-0.0.86-py3-none-any.whl | Python 3 | none | any | Details |
Total release size: 195.9 kB
Release files / quantstats-0.0.86.tar.gz
| Download URL | quantstats-0.0.86.tar.gz |
|---|---|
| Size | 99.1 kB |
| Tags | Source |
|
SHA-256 checksum How to use checksums |
eb348e342410f0abb9b7a457f524df703dc337ed075303b842eaba220a11c7e1
|
|
BLAKE2b-256 checksum How to use checksums |
3c5aa859727babc25df8e42e5d2d0d928de5652be7bf1d20a768ecc58add2d3c
|
| Upload date | |
|
Uploaded using Trusted Publishing? What is trusted publishing? |
No |
| Uploaded via |
twine/7.0.0 CPython/3.12.14
|
Release files / quantstats-0.0.86-py3-none-any.whl
| Download URL | quantstats-0.0.86-py3-none-any.whl |
|---|---|
| Size | 96.8 kB |
| Tags | Python 3 |
|
SHA-256 checksum How to use checksums |
4cfb157c8228cbb47681d6a81767d465fbc2bdf529643dd7e836479d2165efd6
|
|
BLAKE2b-256 checksum How to use checksums |
d8463d9304b888c5e67e00e3ad814e06ab08b21c0386e14ba5d08daceaab9b31
|
| Upload date | |
|
Uploaded using Trusted Publishing? What is trusted publishing? |
No |
| Uploaded via |
twine/7.0.0 CPython/3.12.14
|














