A client for quickchart.io, a service that generates static chart images

Project description
quickchart-python


A Python client for the quickchart.io image charts web service.
Installation
Use the quickchart.py library in this project, or install through pip:
pip install quickchart.io
Usage
This library provides a QuickChart class. Import and instantiate it. Then set properties on it and specify a Chart.js config:
from quickchart import QuickChart

qc = QuickChart()
qc.width = 500
qc.height = 300
qc.config = {
    "type": "bar",
    "data": {
        "labels": ["Hello world", "Test"],
        "datasets": [{
            "label": "Foo",
            "data": [1, 2]
        }]
    }
}
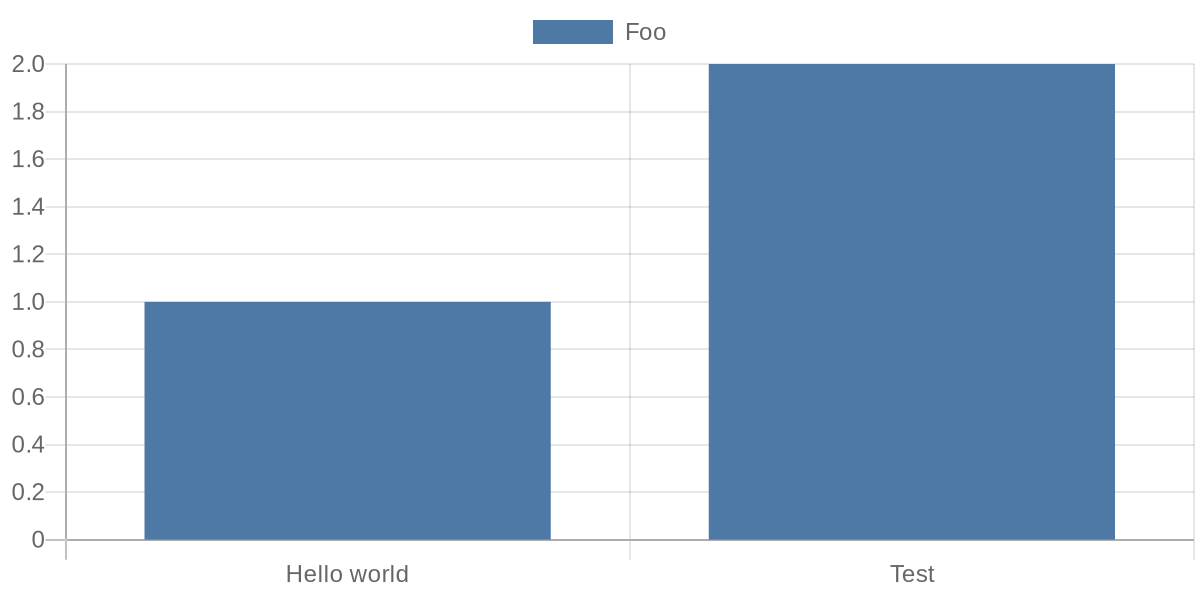
Use get_url() on your quickchart object to get the encoded URL that renders your chart:
print(qc.get_url())
# https://quickchart.io/chart?c=%7B%22chart%22%3A+%7B%22type%22%3A+%22bar%22%2C+%22data%22%3A+%7B%22labels%22%3A+%5B%22Hello+world%22%2C+%22Test%22%5D%2C+%22datasets%22%3A+%5B%7B%22label%22%3A+%22Foo%22%2C+%22data%22%3A+%5B1%2C+2%5D%7D%5D%7D%7D%7D&w=600&h=300&bkg=%23ffffff&devicePixelRatio=2.0&f=png
If you have a long or complicated chart, use get_short_url() to get a fixed-length URL using the quickchart.io web service (note that these URLs only persist for a short time unless you have a subscription):
print(qc.get_short_url())
# https://quickchart.io/chart/render/f-a1d3e804-dfea-442c-88b0-9801b9808401
The URLs will render an image of a chart:
Using Javascript functions in your chart
Chart.js sometimes relies on Javascript functions (e.g. for formatting tick labels). There are a couple approaches:
- Build chart configuration as a string instead of a Python object. See
examples/simple_example_with_function.py. - Build chart configuration as a Python object and include a placeholder string for the Javascript function. Then, find and replace it.
- Use the provided
QuickChartFunctionclass. Seeexamples/using_quickchartfunction.pyfor a full example.
A short example using QuickChartFunction:
qc = QuickChart()
qc.config = {
    "type": "bar",
    "data": {
        "labels": ["A", "B"],
        "datasets": [{
            "label": "Foo",
            "data": [1, 2]
        }]
    },
    "options": {
        "scales": {
            "yAxes": [{
                "ticks": {
                    "callback": QuickChartFunction('(val) => val + "k"')
                }
            }],
            "xAxes": [{
                "ticks": {
                    "callback": QuickChartFunction('''function(val) {
                      return val + '???';
                    }''')
                }
            }]
        }
    }
}

print(qc.get_url())
Customizing your chart
You can set the following properties:
config: dict or str
The actual Chart.js chart configuration.
width: int
Width of the chart image in pixels. Defaults to 500
height: int
Height of the chart image in pixels. Defaults to 300
format: str
Format of the chart. Defaults to png. svg is also valid.
background_color: str
The background color of the chart. Any valid HTML color works. Defaults to #ffffff (white). Also takes rgb, rgba, and hsl values.
device_pixel_ratio: float
The device pixel ratio of the chart. This will multiply the number of pixels by the value. This is usually used for retina displays. Defaults to 1.0.
version: str
The version of Chart.js to use. Acceptable values are documented here. Usually used to select Chart.js 3+.
host
Override the host of the chart render server. Defaults to quickchart.io.
key
Set an API key that will be included with the request.
Getting URLs
There are two ways to get a URL for your chart object.
get_url(): str
Returns a URL that will display the chart image when loaded.
get_short_url(): str
Uses the quickchart.io web service to create a fixed-length chart URL that displays the chart image. Returns a URL such as https://quickchart.io/chart/render/f-a1d3e804-dfea-442c-88b0-9801b9808401.
Note that short URLs expire after a few days for users of the free service. You can subscribe to keep them around longer.
Other functionality
get_bytes()
Returns the bytes representing the chart image.
to_file(path: str)
Writes the chart image to a file path.
More examples
Checkout the examples directory to see other usage.
Release history Release notifications | RSS feed


Download files
Download the file for your platform. If you're not sure which to choose, learn more about installing packages.
Source Distribution
Built Distribution
Filter files by name, interpreter, ABI, and platform.
If you're not sure about the file name format, learn more about wheel file names.
Copy a direct link to the current filters
File details
Details for the file quickchart.io-1.0.0.tar.gz.
File metadata
- Download URL: quickchart.io-1.0.0.tar.gz
- Upload date:
- Size: 5.3 kB
- Tags: Source
- Uploaded using Trusted Publishing? No
- Uploaded via: poetry/1.0.10 CPython/3.7.6 Linux/5.4.0-80-generic
File hashes
| Algorithm | Hash digest | |
|---|---|---|
| SHA256 |
e896963d476be5985b280925398955b6b52679f39990ea4b7082289924f71d86
|
|
| MD5 |
ec94af2dd0d555b68ab1f1441608dc9a
|
|
| BLAKE2b-256 |
809e294877c28c547f5220394fbb90f21b0403772e5d9ddfbe2938fc0cf72591
|
File details
Details for the file quickchart.io-1.0.0-py2.py3-none-any.whl.
File metadata
- Download URL: quickchart.io-1.0.0-py2.py3-none-any.whl
- Upload date:
- Size: 5.1 kB
- Tags: Python 2, Python 3
- Uploaded using Trusted Publishing? No
- Uploaded via: poetry/1.0.10 CPython/3.7.6 Linux/5.4.0-80-generic
File hashes
| Algorithm | Hash digest | |
|---|---|---|
| SHA256 |
afb1e36e257ce37df3e9bd0369f08b0b5c51d967b5739d33264045d89e5cf9a9
|
|
| MD5 |
fab9ac4b05a7833b17bcd2655a5f5963
|
|
| BLAKE2b-256 |
95af2f95d6497ff3fd51ba022bb7d91fd03959e1c0b4a4f24b100367a3d62fe6
|


