A visualization tool for medical images
Project description
RadVis
RadVis (Radiology Visualization) is a visualization tool for medical images.
Currently implemented features:
- Load both DICOM and NIFTI images
- Can display 2D slices of the 3D images
- Ability to add a mask to the image
- Works in both notebooks and scripts
Installation
pip install radvis
RadSlice Viewer
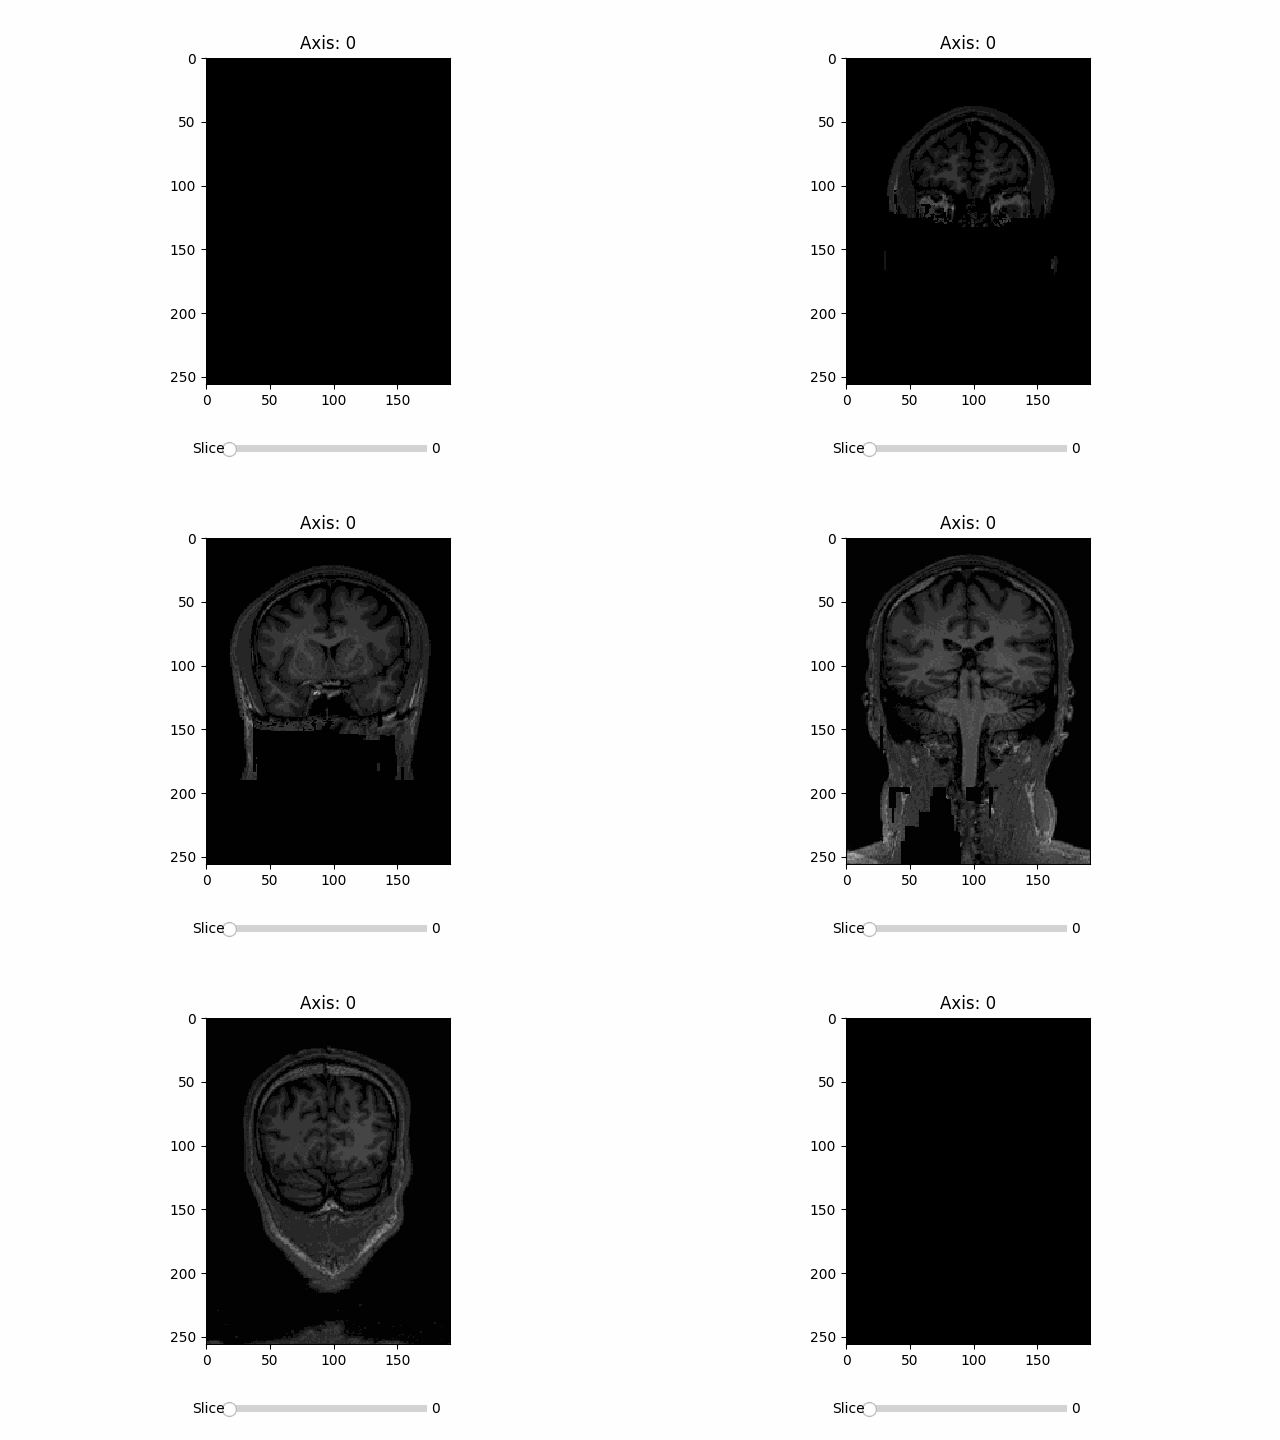
Loading an image and displaying it with a slider
import radvis as rv

# Creates a 'RadImage' object containing the image data
image = rv.load_image('path/to/image.nii.gz')

slicer = rv.RadSlicer(image, axis=0)

slicer.display()
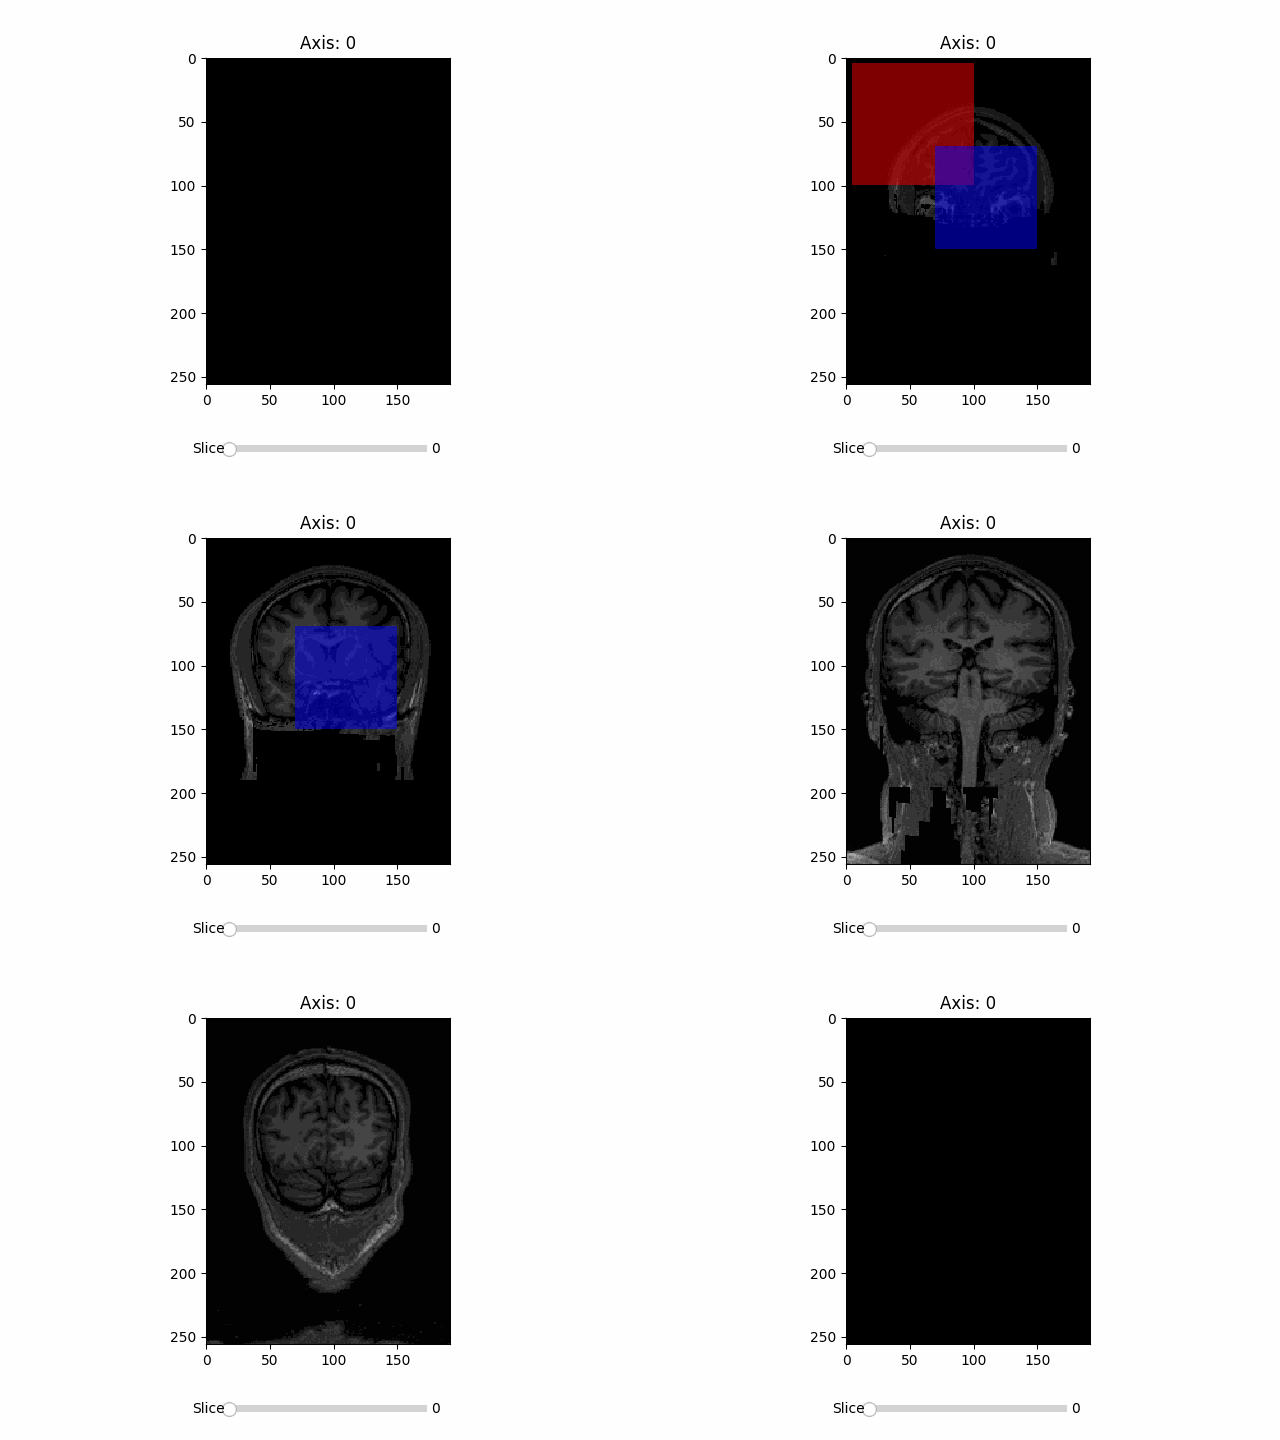
Adding masks to the image
import radvis as rv
import numpy as np

image = rv.load_image('path/to/image.nii.gz')

slicer = rv.RadSlicer(image, axis=0)

# 0 values wont be displayed
red_mask = np.zeros_like(image.image_data)
red_mask[5:100, 5:100, 5:100] = 1

blue_mask = np.zeros_like(image.image_data)
blue_mask[70:150, 70:150, 70:150] = 1

slicer.add_mask(red_mask, color="red")
slicer.add_mask(blue_mask, color="blue")

slicer.display()
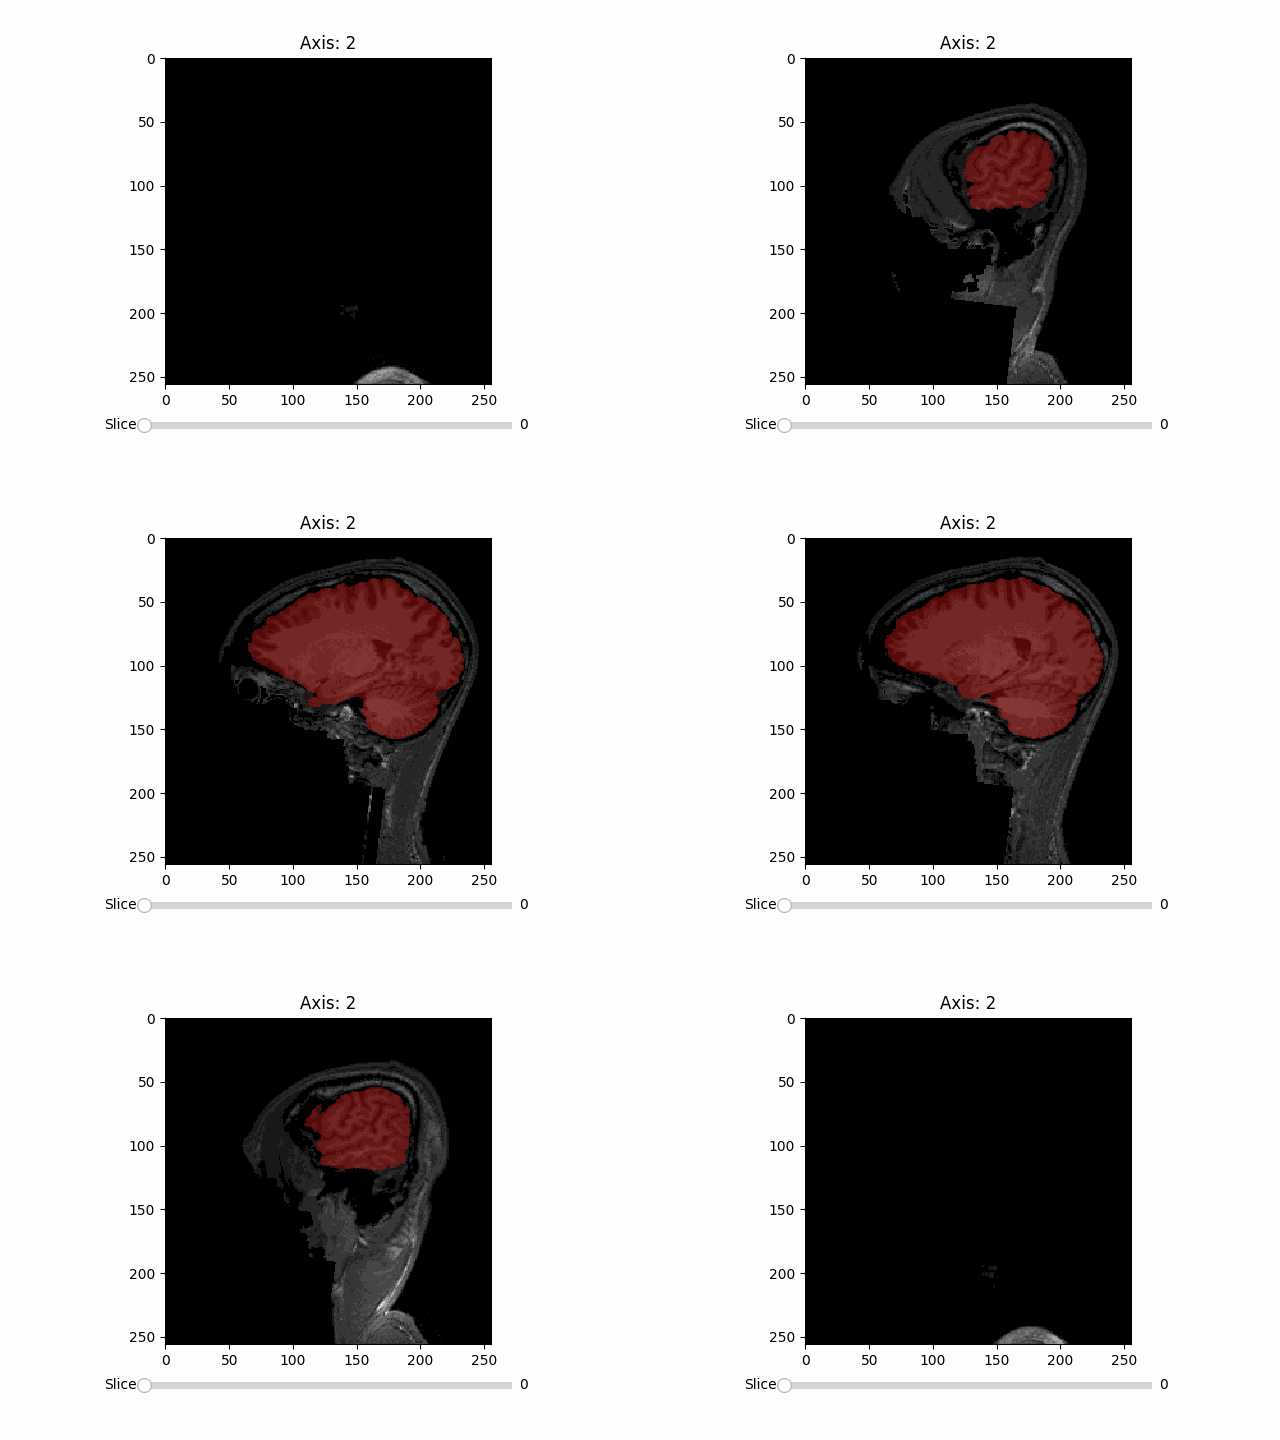
Mask can be another RadImage object so you can load up your masks from a DICOM or NIFTI
import radvis as rv
import numpy as np

AXIS = 1
IMAGE_PATH = "path/to/image.nii.gz"
IMAGE_MASK_PATH = "path/to/mask.nii.gz"

image = rv.load_image(IMAGE_PATH)
mask = rv.load_image(IMAGE_MASK_PATH)

slicer = rv.RadSlicer(image, AXIS, width=3)
slicer.add_mask(mask, color="red", alpha=0.3)

slicer.display()
# slicer.save_animation(f"images/axis_{AXIS}_brain_seg.gif", fps=30)


Processing Module
The processing module of RadVis offers a set of functions to perform preprocessing tasks
Clipping
The percentile_clipping function allows you to clip the pixel intensities of an image at specified lower and upper percentiles. This can be helpful in enhancing the contrast of the image.
Noise Reduction
The noise_reduction function can be used to reduce the amount of noise in your images, which is particularly useful for medical images where noise can often interfere with the analysis.
Normalization
The normalization function is used to normalize the pixel intensities of the image to a specified range. This is useful for preparing your images for machine learning models, which often perform better when the input data is normalized.
Padding
The add_padding function can be used to add padding to your images, which can be useful when you need to make all your images the same size for subsequent analysis or to apply a neural network that requires input images to be of a certain size.
Example usage of processing functions:
import radvis as rv
import numpy as np

# Loading image
image = rv.load_image(filepath='path/to/image.nii.gz')

# Applying processing functions
clipped_image = rv.processing.percentile_clipping(image, lower_percentile=0.25, upper_percentile=0.75)
filtered_image = rv.processing.noise_reduction(clipped_image, filter_size=1)
normalized_image = rv.processing.normalization(filtered_image, min_val=0, max_val=255)
padded_image = rv.processing.add_padding(normalized_image, target_shape=(128, 128, 128))

# Displaying processed image
slicer = rv.RadSlicer(padded_image, axis=0)
slicer.display()
Project details
Release history Release notifications | RSS feed
Download files
Download the file for your platform. If you're not sure which to choose, learn more about installing packages.


