Visualize and evaluate rank evolution across retrieval steps - rankflow plots, retrieval metrics, and pipeline comparison for RAG.

Project description
RankFlow


See exactly how each document moves through your retrieval pipeline -- and measure whether re-ranking actually helps.
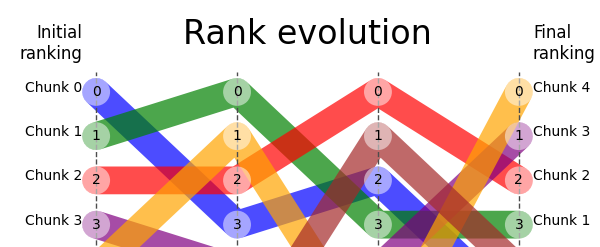
RankFlow visualizes and evaluates rank evolution across retrieval and re-ranking steps in RAG pipelines. Instead of staring at log files, you get a clear picture of what each pipeline stage does to your search results.
Why RankFlow?
- Your re-ranker might be making things worse -- RankFlow shows per-step metrics (NDCG, MRR, Precision, Recall, MAP) so you know exactly which stage helps and which hurts.
- You can't optimize what you can't see -- rank evolution plots reveal how documents shuffle between stages, which ones get dropped, and where relevant results fall off.
- Evaluating one query isn't enough --
BatchRankFlowaggregates across hundreds of queries with dashboards, win/loss analysis, and automatic failure detection. - Hybrid search is a black box --
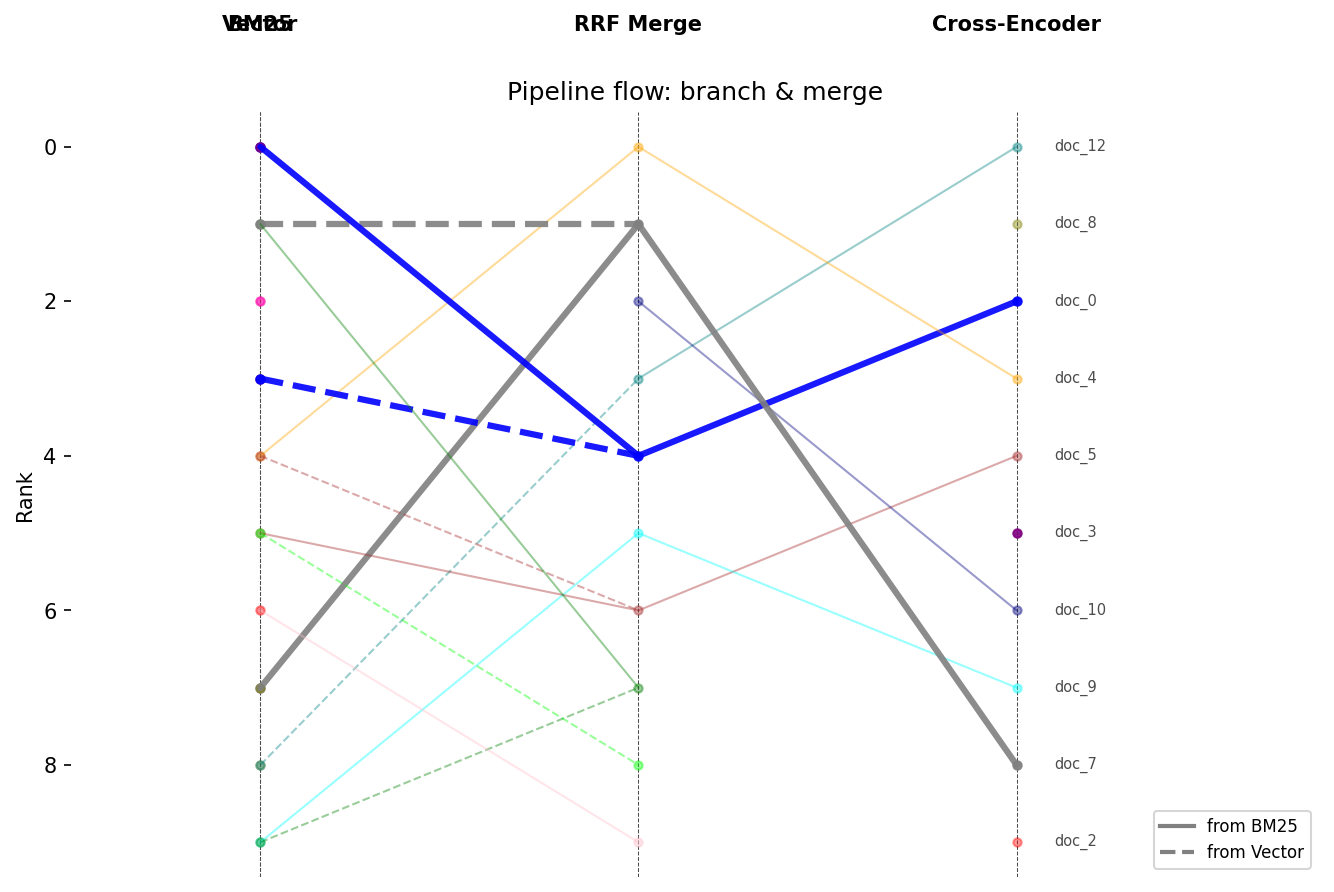
MergeRankFlowmodels branching pipelines (BM25 + vector search), showing overlap between branches and whether they're complementary or redundant. - Experiment tracking shouldn't require MLflow -- save, load, and statistically compare retrieval experiments with a file-based store. No database, no infra.
Quick Start
pip install rankflow
import numpy as np
from rankflow import RankFlow

rf = RankFlow(
    ranks=np.array([[3, 0, 5, 1, 2], [1, 2, 4, 0, 3], [0, 3, 6, 1, 2]]),
    step_labels=["BM25", "Semantic", "Cross-Encoder"],
    chunk_labels=["doc_a", "doc_b", "doc_c", "doc_d", "doc_e"],
    relevant_chunks=["doc_a", "doc_c"],  # ground truth
    show_metrics=True,
)
rf.plot()
Relevant documents are highlighted, irrelevant ones fade out, and retrieval metrics are annotated at each step.
More examples
| Density mode (100+ docs) | Batch evaluation dashboard | Hybrid pipeline (MergeRankFlow) |
|---|---|---|
 |
 |
 |
Features
Visualization
| Feature | Description |
|---|---|
| Rank evolution plot | Line plot showing how each document's rank changes across pipeline stages |
| Density mode | Percentile bands for 100+ documents with focus lines for top-K and relevant docs |
| Interactive Plotly | Hover tooltips with document name, rank, score, and delta |
| A/B comparison | Side-by-side rendering of two pipelines |
| Source provenance | Distinct markers/colors for text vs. vector vs. hybrid results |
| NaN handling | Dashed lines for documents that appear or disappear between steps |
Evaluation
| Feature | Description |
|---|---|
| Per-step metrics | Precision@K, Recall@K, MRR, NDCG@K, MAP computed at every pipeline stage |
| Graded relevance | Numeric relevance grades with colormap visualization |
| Rank deltas | Annotate rank changes between consecutive steps |
| Per-chunk summary | Initial/final rank, max gain, max loss, total displacement |
| Top-K filtering | Focus on top-K documents (modes: any, initial, final) |
Multi-Query Batch Evaluation
| Feature | Description |
|---|---|
| Aggregated metrics | Mean/std across all queries per step |
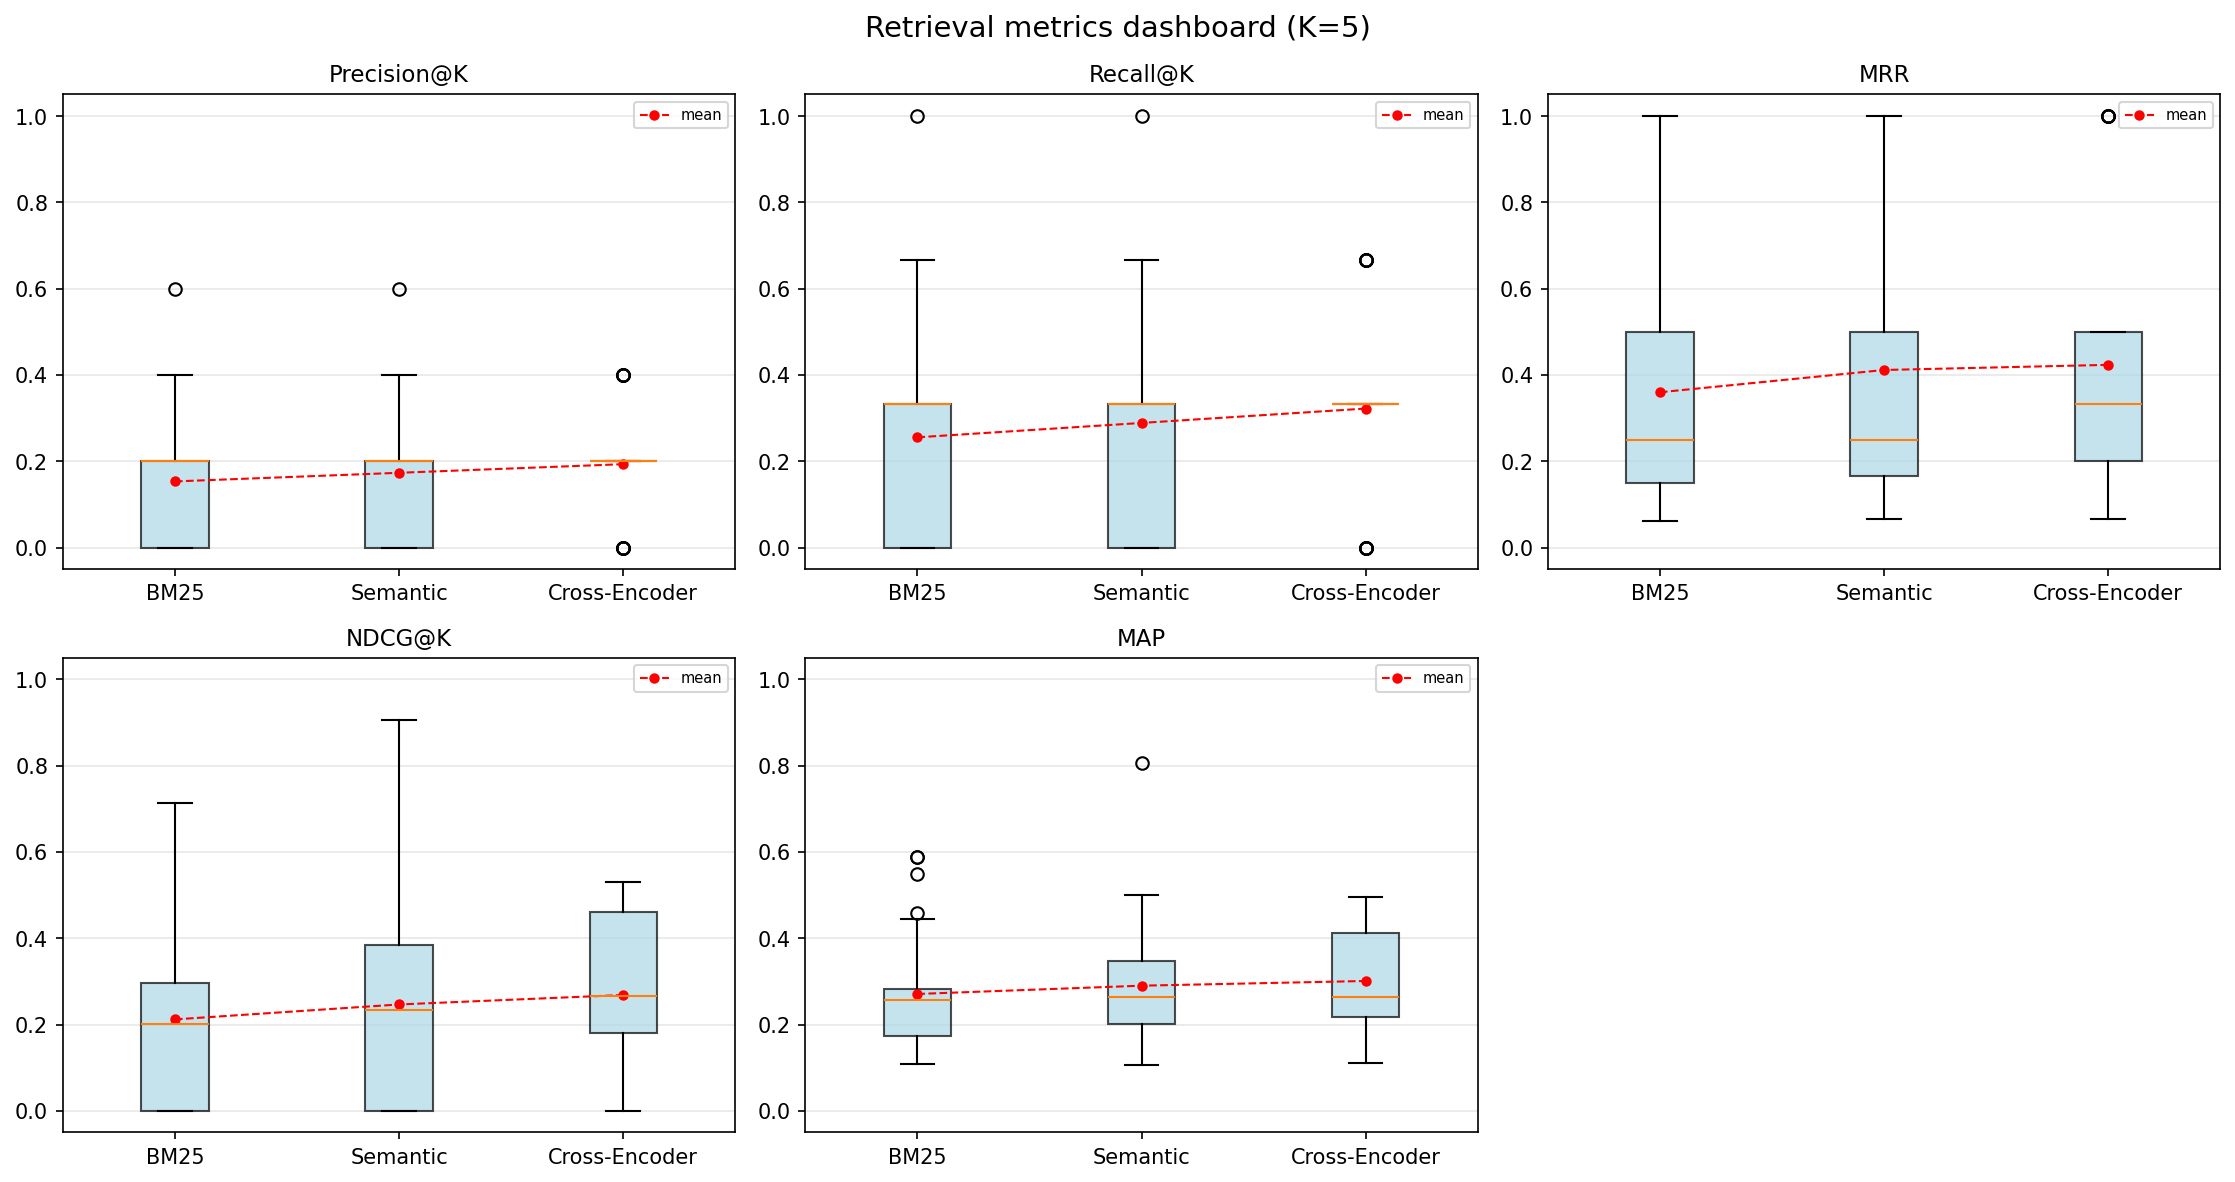
| Metrics dashboard | Box plots for all metrics in a single figure |
| Win/loss/tie analysis | Count queries that improved or degraded at each transition |
| Difficulty segmentation | Group queries by difficulty, compare metric evolution per bucket |
| Improvement heatmap | Queries x transitions matrix colored by metric delta |
| Failure detection | Automatically find queries where the pipeline made results worse |
Hybrid Pipelines
| Feature | Description |
|---|---|
| DAG pipeline model | MergeRankFlow for branching/merging pipelines (BM25 + vector + RRF) |
| Overlap analysis | Shared vs. exclusive documents at merge points |
| Rank correlation | Spearman rho between branches -- are they complementary or redundant? |
| Branch visualization | Distinct line styles per source branch with legend |
Experiment Tracking
| Feature | Description |
|---|---|
| Experiment registry | ExperimentStore saves/loads experiments as JSON files -- no database needed |
| Pipeline config | Attach pipeline_config dicts to RankFlow, preserved through export/import |
| Experiment comparison | compare_experiments() with config diff, per-metric deltas, paired t-test p-values |
| Win/loss/tie | Count queries that improved, degraded, or stayed the same |
| Regression detection | Identify specific queries where the challenger is worse |
| Web UI | Interactive Streamlit dashboard for browsing and comparing experiments |
Ecosystem Integration
| Format | Import | Export |
|---|---|---|
| TREC run/qrels | RankFlow.from_trec_run() |
rf.to_trec_run() |
| RankFlow JSON | RankFlow.from_rankflow_json() |
rf.to_rankflow_json() |
| ranx | RankFlow.from_ranx() |
rf.to_ranx_run() |
| RAGAS | RankFlow.from_ragas() |
-- |
| pandas | RankFlow(df=df) |
rf.to_dataframe() |
| dict / JSON | -- | rf.to_dict() / rf.to_json() |
Examples
Metrics at every step
rf = RankFlow(
    ranks=ranks,
    step_labels=["BM25", "Semantic", "Cross-Encoder"],
    chunk_labels=chunk_labels,
    relevant_chunks=["doc_a", "doc_c"],
    relevance_grades={"doc_a": 3, "doc_c": 1},
)

for step, m in zip(rf.step_labels, rf.metrics(k=5)):
    print(f"{step}: NDCG@5={m['ndcg_at_k']:.3f}  MRR={m['mrr']:.3f}")
Batch evaluation across 100 queries
from rankflow import BatchRankFlow

batch = BatchRankFlow(rankflows)  # list of RankFlow objects
batch.plot_dashboard(k=10)        # box plots for all metrics

# Find queries where re-ranking hurt performance
for f in batch.failure_cases(metric="ndcg_at_k", k=10, threshold=-0.1):
    print(f"{f['query_label']}: {f['initial_value']:.3f} -> {f['final_value']:.3f}")
Density plot for large result sets
rf = RankFlow(
    ranks=ranks_150_docs,
    step_labels=step_labels,
    chunk_labels=chunk_labels,
    relevant_chunks=relevant,
    density_focus_k=10,
)
rf.plot(mode="density")
Compare two experiments
from rankflow import Experiment, ExperimentStore, compare_experiments

store = ExperimentStore("./experiments")
baseline = store.load("bm25-baseline")
challenger = store.load("cross-encoder-v1")

report = compare_experiments(baseline, challenger, k=10)
print(f"Win/Loss/Tie: {report.wins}W / {report.losses}L / {report.ties}T")

for metric, data in report.metric_deltas.items():
    sig = "*" if data["p_value"] < 0.05 else ""
    print(f"  {metric}: {data['delta']:+.3f} (p={data['p_value']:.3f}) {sig}")
Load from TREC format
rf = RankFlow.from_trec_run(
    ["bm25.run", "reranker.run"],
    qrels_path="qrels.txt",
    query_id="q1",
)
rf.plot()
Tutorials
Step-by-step notebooks in notebooks/:
- Quick Start -- creating plots from arrays and DataFrames, customizing appearance
- Metrics & Analysis -- relevance highlighting, IR metrics, rank deltas, top-K filtering
- Advanced Visualization -- A/B comparison, density plots, source provenance, Plotly
- Batch Evaluation -- multi-query aggregation, dashboards, win/loss, failure detection
- Adapters & Export -- TREC/RAGAS/ranx import, JSON export, hybrid pipeline modeling
- Experiments & Comparison -- experiment registry, statistical comparison, regression detection
- Web UI Walkthrough -- synthetic data generation, launching the Streamlit dashboard, page-by-page guide
Installation
pip install rankflow              # core (matplotlib + numpy)
pip install rankflow[pandas]      # + pandas support
pip install rankflow[interactive] # + Plotly interactive plots
pip install rankflow[all]         # everything
For adapter and UI dependencies (optional):
pip install rankflow[ranx]        # ranx IR evaluation library
pip install rankflow[ragas]       # RAGAS RAG evaluation framework
pip install rankflow[ui]          # Streamlit web UI
Web UI
Launch the interactive experiment explorer:
rankflow ui ./experiments
The UI provides four views: experiment list, comparison dashboard with config diff and significance tests, per-query explorer with drill-down, and full BatchRankFlow deep dive.
Further Reading
RankFlow plot for retriever visual evaluation -- a blog post describing practical usage of RankFlow for tuning RAG retrieval pipelines.
License
If RankFlow helps your retrieval work, consider giving it a ⭐ on GitHub.


Download files
Download the file for your platform. If you're not sure which to choose, learn more about installing packages.
Source Distribution
Built Distribution
Filter files by name, interpreter, ABI, and platform.
If you're not sure about the file name format, learn more about wheel file names.
Copy a direct link to the current filters
File details
Details for the file rankflow-0.2.1.tar.gz.
File metadata
- Download URL: rankflow-0.2.1.tar.gz
- Upload date:
- Size: 47.1 kB
- Tags: Source
- Uploaded using Trusted Publishing? No
- Uploaded via: twine/6.1.0 CPython/3.13.12
File hashes
| Algorithm | Hash digest | |
|---|---|---|
| SHA256 |
0ee2409a0c2a76284f788f7219ab3baf92ebc1507a29a428a21d326d697d64a7
|
|
| MD5 |
cade548dddaf05694639ce6fc015e584
|
|
| BLAKE2b-256 |
58a0d7b6e20dd0d601726db0d6d067a825be528d0f6462b0a55517021c6c90d2
|
File details
Details for the file rankflow-0.2.1-py3-none-any.whl.
File metadata
- Download URL: rankflow-0.2.1-py3-none-any.whl
- Upload date:
- Size: 47.4 kB
- Tags: Python 3
- Uploaded using Trusted Publishing? No
- Uploaded via: twine/6.1.0 CPython/3.13.12
File hashes
| Algorithm | Hash digest | |
|---|---|---|
| SHA256 |
be1420782a452ce1dca51cd1b482317131ce87f68afd4d871983bee7971bfa4d
|
|
| MD5 |
3e3983c2666610fd526cd38248d64c35
|
|
| BLAKE2b-256 |
a803efc8750b73863c2845d928a5880208a1546f9217fcd9b883320a98ea0112
|


