Data diagnostic package with minimum setup to analyze miss predictions of ML models

Project description


Rarity is a diagnostic library for tabular data with minimal setup to enable deep dive into datasets identifying features that could have potentially influenced the model prediction performance. It is meant to be used at post model training phase to ease the understanding on miss predictions and carry out systematic analysis to identify the gap between actual values versus prediction values. The auto-generated gap analysis is presented as a dash web application with flexible parameters at several feature components.
The inputs needed to auto-generate gap analysis report with Rarity are solely depending on features, yTrue and yPred values. Rarity is therefore a model anogstic package and can be used to inspect miss predictions on tabular data generated by any model framework.
Supported Analysis Type
Rarity currently supports tasks related to
- Regression
- Binary Classifciation
- Multiclass Classification
It can also be used to conduct bimodal analysis. As it is used to inspect miss predictions in details down to the granularity at each data index level, multiple modal analysis won't be ideal for repetition at individual data index for each model. Therefore, the package supports upto 2 model miss prediction gap analysis for side-by-side comparison benefiting more during the post model training and final phase of model fine-tuning stage.
Core Feature Components
There are five core feature components covered in the auto-generated gap analysis report by Rarity:
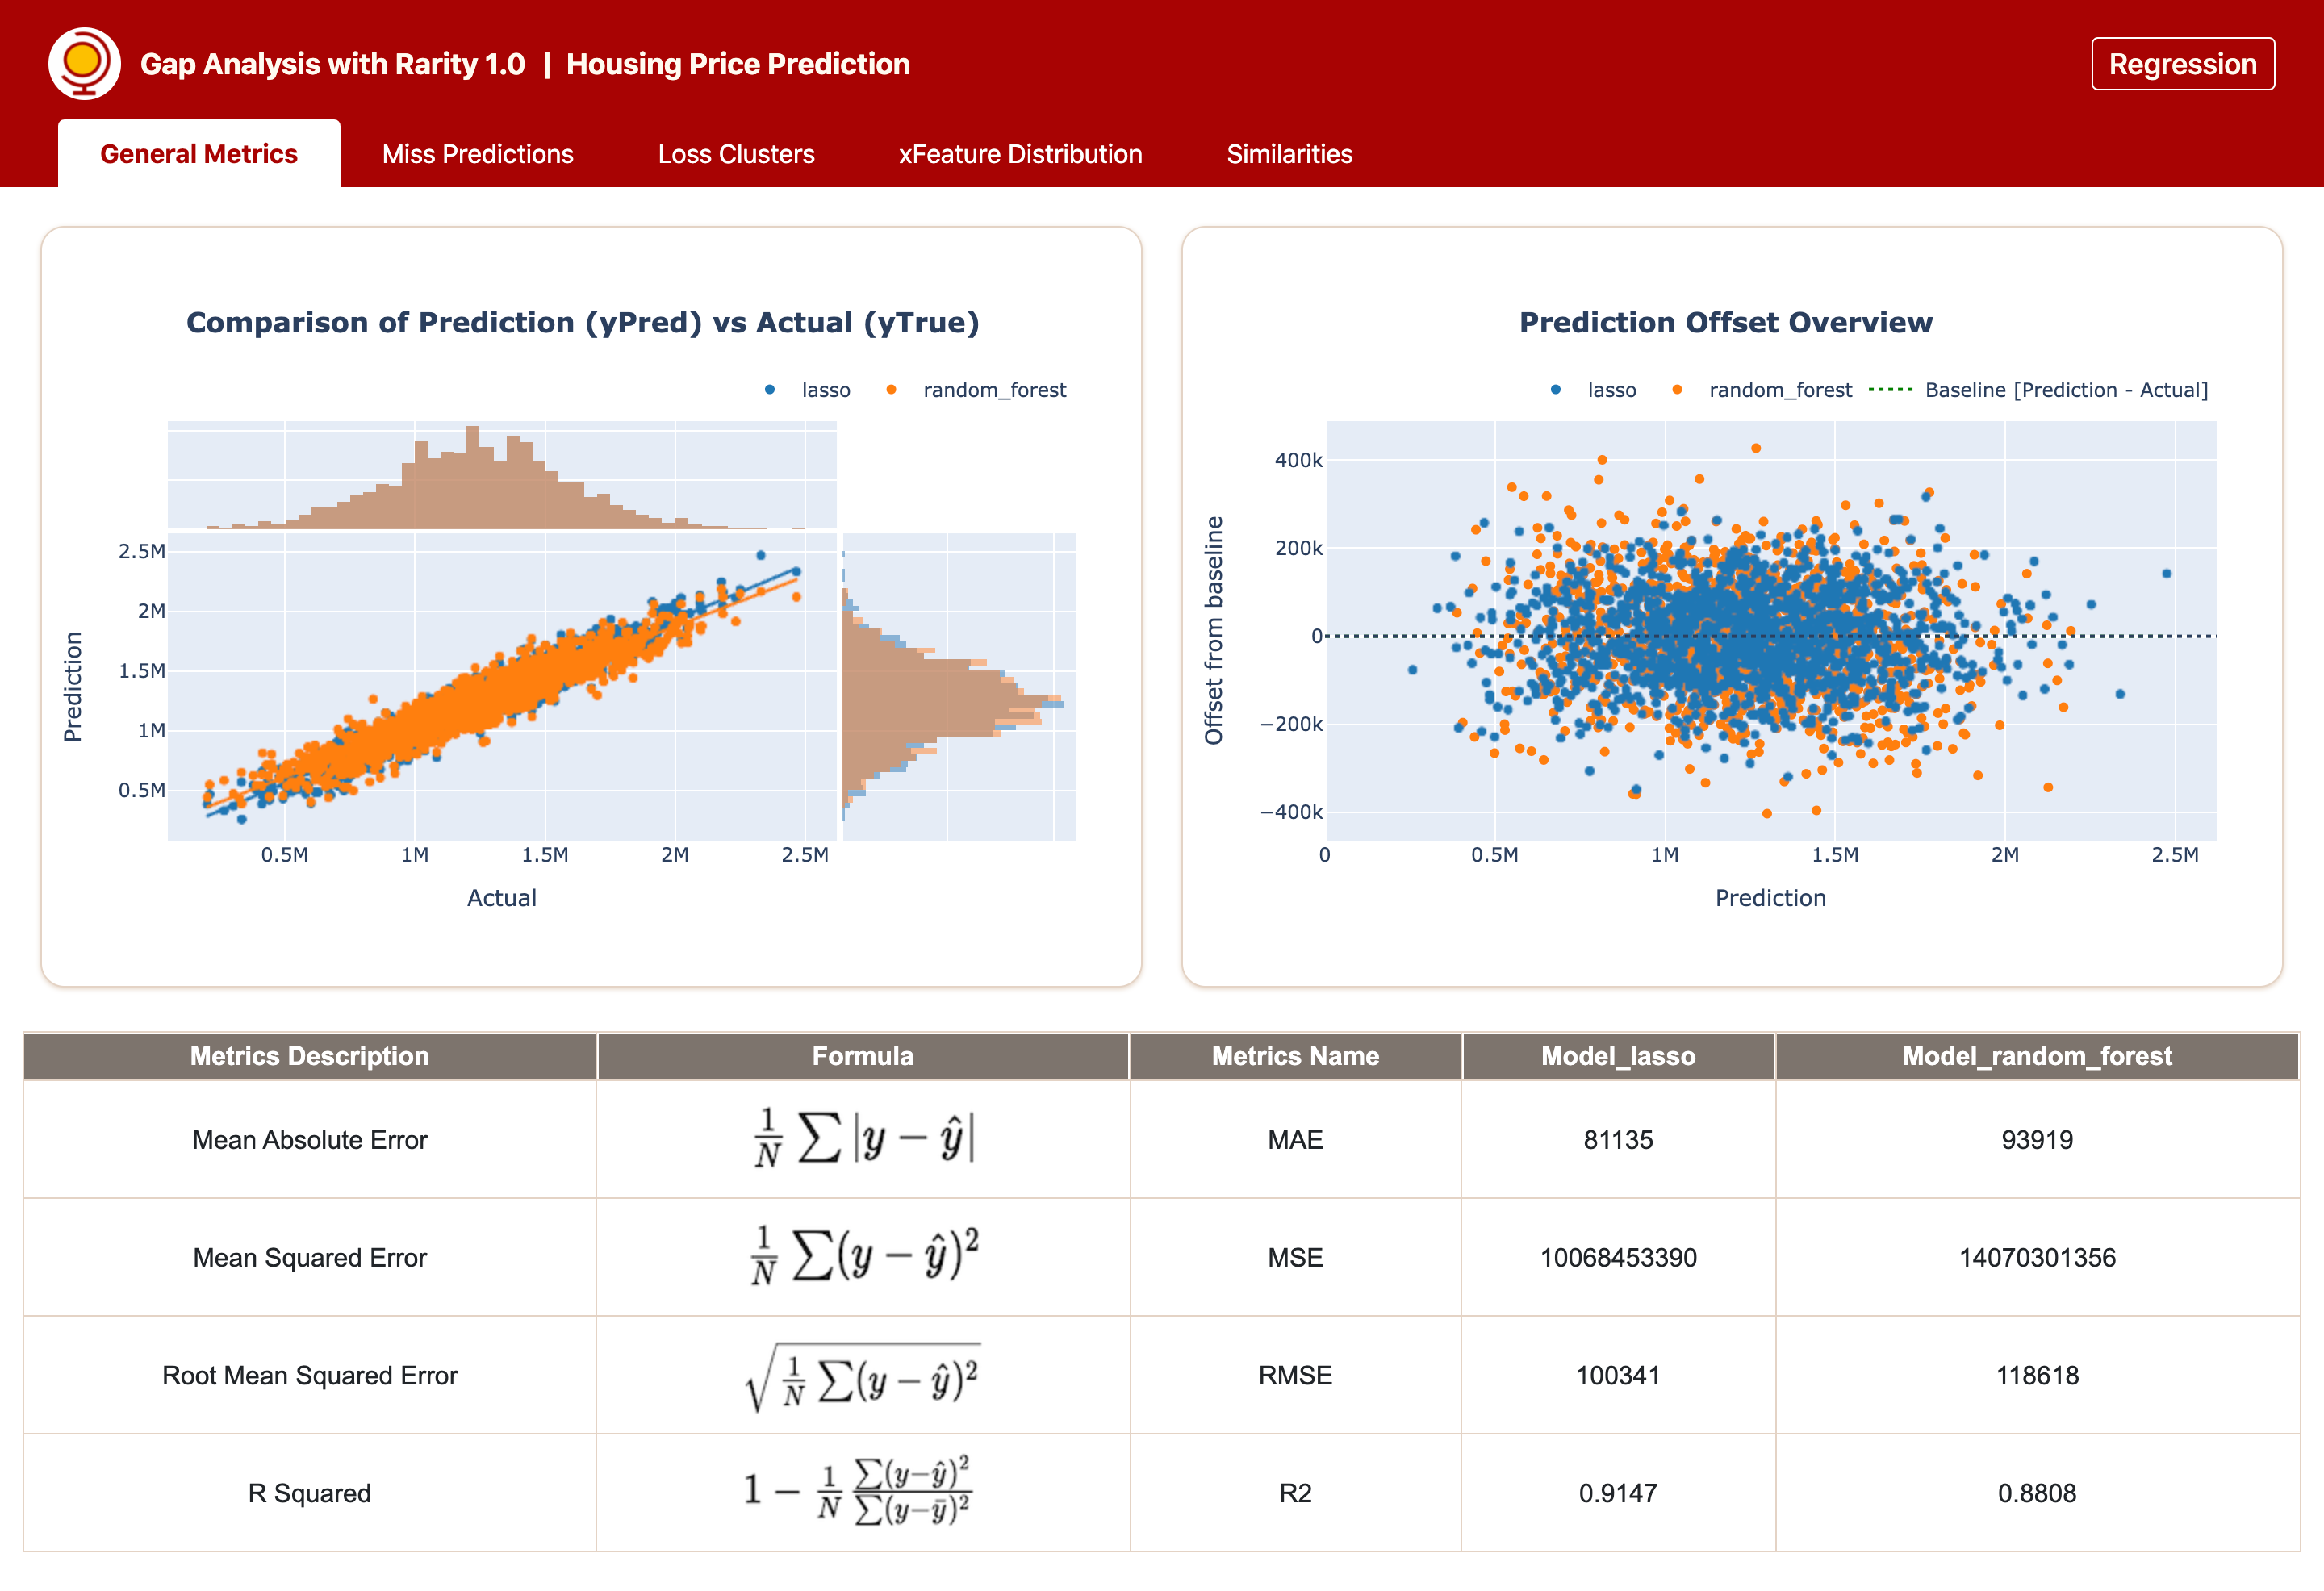
- General Metrics : covers general metrics used to evaluate model performance.
- Miss Predictions : presents miss predictions scatter plot by index number
- Loss Clusters : covers clustering info on offset values (regression) and logloss values (classification)
- xFeature Distribution : distribution plots ranked by kl-divergence score
- Similarities : tabulated info listing top-n data points based on similarities in features with reference to data index specified by user
Counter-Factuals is also included under Similarities component tab for classification task to better compare data points with most similar features but show different prediction outcomes. For futher details on how the feature components are displayed in the web application, please checkout more examples under section Feature Introduction in the package documentation.
Installation
Rarity has been tested on Python 3.6+. It is advisable to create a Virtual Environment to use along with Rarity.
For details guide on how to create virtual environment, you can refer to this user guide. After creation of the virtual environment, activate it and proceed with one of the following steps.
From PyPI
pip install rarity
From Source
git clone https://github.com/aimakerspace/rarity.git
cd rarity
pip install -e .
Quick Start
Rarity is developed with minimum setup in mind in order for users to focus more on actual modelling works and decide appropriate fine-tuning strategy after quick overview on the state of miss-prediction at post model training phase. Users can compile the required inputs and prediction outcomes via one of the following mentioned methods and spin up the dash web application to see the final gap analysis report produced by Rarity.
Simplest mode with mininum code
After cloning Rarity repository, place xFeatures, yTrue and yPred files into configs/csv_data folder as illustrated in example below
    rarity
    ├── configs
    │   ├── csv_data
    │   │   ├── <example_user_xFeatures>.csv
    │   │   ├── <example_user_yTrue>.csv
    │   │   ├── <example_user_yPred_model_x>.csv
    │   │   └── <example_user_yPred_model_y>.csv
    │   │
    │   └── configs.py
    ...
    │
    ├── auto_gap_analysis.py
Then open configs.py file and update the first section to define the required meta data.
# *******************************************************************************************
# To be updated by user accordingly if to run this script using saved csv files
# Replace 'example_xxx.csv' with user's file name
xFeature_filename = 'example_user_xFeatures.csv'
yTrue_filename = 'example_user_yTrue.csv'
# yPred_file can be single file or max 2 files, wrap in a list
yPred_filename = ['example_user_yPred_model_x.csv', 'example_user_yPred_model_y.csv']

# model name must be listed according to the same sequence of the yPred_filename list above
# can be single model or max bi-modal, wrap in a list
MODEL_NAME_LIST = ['example_model_x', 'example_model_y']

# Supported analysis type: 'Regression', 'Binary Classification', 'Multiclass Classification'
ANALYSIS_TYPE = 'Regression'
ANALYSIS_TITLE = 'example_Customer Churn Prediction'

# Defaults to 8000, user can re-define to a new port number of choice
PORT = 8000
# *******************************************************************************************
After uploading files to configs/csv_data folder and updating configs/configs.py file, open terminal and make sure you are in the Rarity project root folder. A file named auto_gap_analysis.py is already in the root folder upon installation. Then run the following line of code in the terminal
python auto_gap_analysis.py
A window will be open in the web browser and you will see the gap analysis report is generated for you by Rarity. Below is an example generated for Bimodal analysis on Regression task.
Using CSVDataLoader
After installation, open terminal and run the following codes :
from rarity import GapAnalyzer
from rarity.data_loader import CSVDataLoader

# define the file paths
xFeatures_file = 'example_xFeatures.csv'
yTrue_file = 'example_yTrue.csv'
yPred_file_list = ['example_yPreds_model_xx.csv', 'example_yPreds_rf.csv']
model_names_list = ['model_xx', 'model_yy']

# specify which port to use, if not provided, default port is set to 8000
preferred_port = 8866

# collate all files using dataloader to transform them into the input format
# that can be processed by various internal function calls
# example : '<analysis_type>' => 'Regression'
# example : '<analysis_title>' => 'Customer Churn Prediction'
data_loader = CSVDataLoader(xFeatures_file, yTrue_file, yPred_file_list,
                            model_names_list, '<analysis_type>')
analyzer = GapAnalyzer(data_loader, '<analysis_title>', preferred_port)
analyzer.run()
with additional adjustments as follows :
! replacement of example files to your own file names
! define `model_names_list`, `analysis_type` and `analysis_title` accordingly
Using DataframeLoader
To use DataframeLoader, it is assumed that you already have some inital dataframes tap-out in earlier runs in the terminal and would like to continue analysing the miss-predictions after model training. The DataframeLoader api call is meant for inline analysis if you prefer not to collate base info using csv files. You may collate all the xFeatures, yTrue and yPreds dataframes into the right input format using DataframeLoader as demonstrated below :
from rarity import GapAnalyzer
from rarity.data_loader import DataframeLoader

# define the file paths
xFeatures_df = <xfeatures_stored_in_pd.DataFrame>
yTrue_df = <yTrue_stored_in_pd.DataFrame/Series>
yPred_df_model_xx = <yPred_generated_by_model_xx_stored_in_pd.DataFrame>
yPred_df_model_yy = <yPred_generated_by_model_yy_stored_in_pd.DataFrame>
yPred_list = [yPred_df_model_xx, yPred_df_model_yy]
model_names_list = ['model_xx', 'model_yy']

# specify which port to use, if not provided, default port is set to 8000
preferred_port = 8866

# collate all files using dataloader to transform them into the input format
# that can be processed by various internal function calls
# example : '<analysis_type>' => 'Regression'
# example : '<analysis_title>' => 'Customer Churn Prediction'
data_loader = DataframeLoader(xFeatures_df, yTrue_df, yPred_list,
                              model_names_list, '<analysis_type>')
analyzer = GapAnalyzer(data_loader, '<analysis_title>', preferred_port)
analyzer.run()
Supports
- Package documentation : Full version of the package documentation can be found HERE
- Community : For interest on AI Singapore program, kindly head to our AISG community channels HERE
Acknowledgement
The developer team would like to express our gratitude to the program office for the support given to the development and release of this data dianogstic library #. Special thanks to AI Singapore making the development works of the package feasible.
Program Office
This project is supported by the National Research Foundation (NRF), Singapore under its AI Singapore Programme (AISG-RP-2019-050).
Developers
Yap Siew Lin (Core developer), Jeanne Choo (ex-AISG), Chong Wei Yih (ex-AISG)
# Any opinions, findings and conclusions or recommendations expressed in this material are those of the author(s) and do not reflect the views of National Research Foundation, Singapore.
Release history Release notifications | RSS feed


Download files
Download the file for your platform. If you're not sure which to choose, learn more about installing packages.
Source Distribution
Built Distribution
Filter files by name, interpreter, ABI, and platform.
If you're not sure about the file name format, learn more about wheel file names.
Copy a direct link to the current filters
File details
Details for the file rarity-1.0.2.tar.gz.
File metadata
- Download URL: rarity-1.0.2.tar.gz
- Upload date:
- Size: 296.7 kB
- Tags: Source
- Uploaded using Trusted Publishing? No
- Uploaded via: twine/3.4.2 importlib_metadata/4.8.1 pkginfo/1.7.1 requests/2.25.1 requests-toolbelt/0.9.1 tqdm/4.62.2 CPython/3.9.4
File hashes
| Algorithm | Hash digest | |
|---|---|---|
| SHA256 |
8f9e2ef6e67949eed51f6d8f70f8d9b9dc25b6125d98621197a14a70bd8df3d5
|
|
| MD5 |
e39756b918984513c990f0add8847a14
|
|
| BLAKE2b-256 |
981ff929d946f86cd963bcaf90df7ea14b4d43653903eff7689f473c32d0bc70
|
File details
Details for the file rarity-1.0.2-py3-none-any.whl.
File metadata
- Download URL: rarity-1.0.2-py3-none-any.whl
- Upload date:
- Size: 358.4 kB
- Tags: Python 3
- Uploaded using Trusted Publishing? No
- Uploaded via: twine/3.4.2 importlib_metadata/4.8.1 pkginfo/1.7.1 requests/2.25.1 requests-toolbelt/0.9.1 tqdm/4.62.2 CPython/3.9.4
File hashes
| Algorithm | Hash digest | |
|---|---|---|
| SHA256 |
2de820efe6bf631b82fc6947f0c581f59e61674cefbf2edcf70ae0b0e5034a03
|
|
| MD5 |
3c712e6086cfb49506e30d3ede5c8375
|
|
| BLAKE2b-256 |
6e42249f1ae166512da217df9b3d5ae5e244622fbf515ad08b9a01b7a0b8ea4d
|


