A library for fitting multi-segment stage-discharge rating curves.

Project description
ratingcurve
A Python package for fitting hydrologic rating curves.
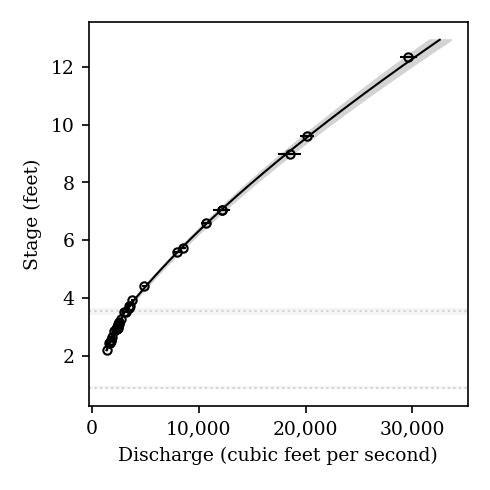
In hydrology, a rating curve is a mathematical relationship between streamflow and water surface elevation (stage).
Because stage is much easier to measure than streamflow, almost all streamflow timeseries are generated from rating curves.
For the most part, those rating curves are still fit manually by drawing a curve to the data,
which can be time consuming and subjective.
To improve that process, the U.S. Geological Survey (USGS), among others, is evaluating methods for automating that fitting.
Several automated methods currently exist, but each parameterizes the rating curve slightly differently,
and because of the nature of the problem, those slight differences can greatly affect performance.
To help the community evaluate different parameterizations,
we created the ratingcurve package, which implements our best parameterization for others to try.
Furthermore, the implementation uses PyMC, a general purpose library for probabilistic modeling,
which makes it easier for others to modify the model to test different parameterizations or fitting algorithms.
If you can improve upon our parameterization, USGS might use your algorithm to generate streamflow timeseries at thousands of locations around the United States.
The package includes simple demonstrations and test datasets to get you started.
Please report any bugs, suggest enhancements, or ask questions by creating an issue.
Installation
Install using pip
pip install ratingcurve
or conda
conda install -c conda-forge ratingcurve
Basic Usage
This tutorial demonstrates basic usage of fitting and plottig a rating curve


from ratingcurve.ratings import PowerLawRating
from ratingcurve import data

# load tutorial data
df = data.load('green channel')

# initialize the model
powerrating = PowerLawRating(segments=2)

# fit the model
trace = powerrating.fit(q=df['q'],
                        h=df['stage'],
                        q_sigma=df['q_sigma'])
powerrating.plot()
Once fit, easily generate a rating table that can be imported into other applications.
powerrating.table()
For more, see the documentation.
Disclaimer
This software is preliminary or provisional and is subject to revision. It is being provided to meet the need for timely best science. The software has not received final approval by the U.S. Geological Survey (USGS). No warranty, expressed or implied, is made by the USGS or the U.S. Government as to the functionality of the software and related material nor shall the fact of release constitute any such warranty. The software is provided on the condition that neither the USGS nor the U.S. Government shall be held liable for any damages resulting from the authorized or unauthorized use of the software.
Citation
Hodson, T.O., Doore, K.J., Kenney, T.A., Over T.M., and Yeheyis, M.B., 2024, Ratingcurve: A Python Package for Fitting Streamflow Rating Curves, Hydrology 11, no. 2: 14. https://doi.org/10.3390/hydrology11020014
@Article{hydrology11020014,
AUTHOR = {Hodson, Timothy O. and Doore, Keith J. and Kenney, Terry A. and Over, Thomas M. and Yeheyis, Muluken B.},
TITLE = {Ratingcurve: A Python Package for Fitting Streamflow Rating Curves},
JOURNAL = {Hydrology},
VOLUME = {11},
YEAR = {2024},
NUMBER = {2},
ARTICLE-NUMBER = {14},
URL = {https://www.mdpi.com/2306-5338/11/2/14},
ISSN = {2306-5338},
DOI = {10.3390/hydrology11020014}
}
Release history Release notifications | RSS feed


Download files
Download the file for your platform. If you're not sure which to choose, learn more about installing packages.
Source Distribution
Built Distribution
Filter files by name, interpreter, ABI, and platform.
If you're not sure about the file name format, learn more about wheel file names.
Copy a direct link to the current filters
File details
Details for the file ratingcurve-1.0.3.tar.gz.
File metadata
- Download URL: ratingcurve-1.0.3.tar.gz
- Upload date:
- Size: 92.4 kB
- Tags: Source
- Uploaded using Trusted Publishing? No
- Uploaded via: twine/6.2.0 CPython/3.9.25
File hashes
| Algorithm | Hash digest | |
|---|---|---|
| SHA256 |
3001b36e82ad0e42a1e4f8cccd65ede0121acdae3fe8f000273d2d4b1b503c0a
|
|
| MD5 |
6262e0b25a8a89b7e14f0fee9e3c6b3a
|
|
| BLAKE2b-256 |
5d447619d8ca8d0917e705a4420262c76a8f7024fd9019bcb9c71857595a0d6a
|
File details
Details for the file ratingcurve-1.0.3-py3-none-any.whl.
File metadata
- Download URL: ratingcurve-1.0.3-py3-none-any.whl
- Upload date:
- Size: 47.4 kB
- Tags: Python 3
- Uploaded using Trusted Publishing? No
- Uploaded via: twine/6.2.0 CPython/3.9.25
File hashes
| Algorithm | Hash digest | |
|---|---|---|
| SHA256 |
e796c9ac124a242ce42ed81f92f189f097b28a15d1984952b2be31438fe945ae
|
|
| MD5 |
6b0569a4d275a9fc07e87990e51415db
|
|
| BLAKE2b-256 |
82b46c9e4770908eb9447619caf762c3c01e9dc170b380ae9c88d82163230fae
|


