No project description provided

Project description
reactpy-apexcharts
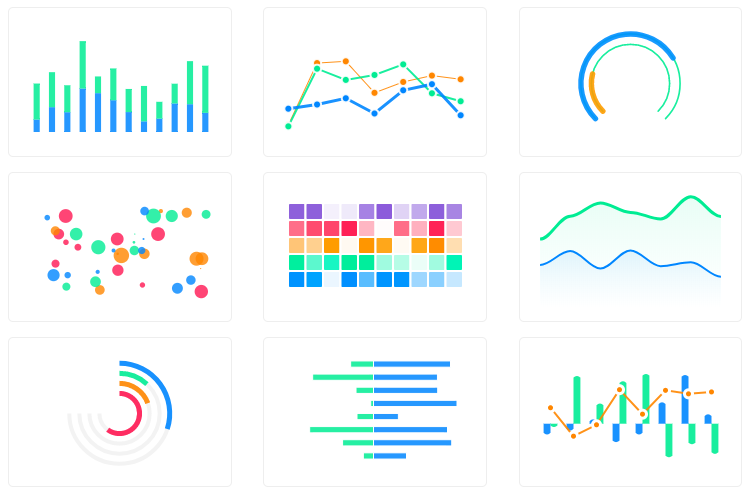
Minimal ReactPy wrapper for the react-apexcharts library (v 1.4.1).
Usage
pip install reactpy-apexcharts
Documentation
Configuration options can be found here
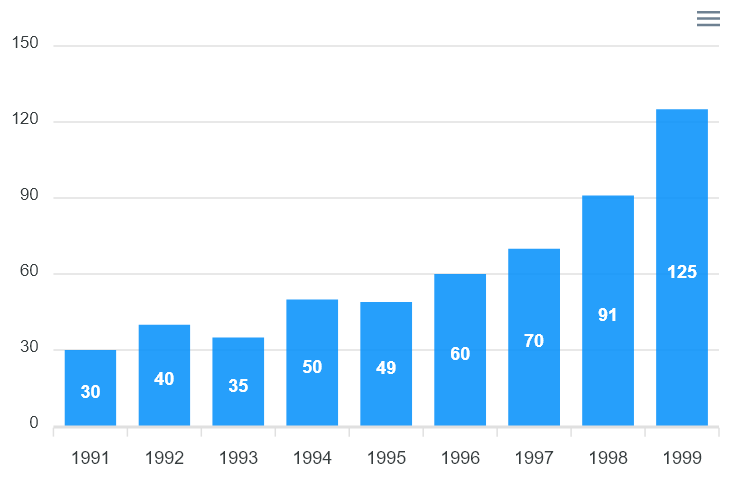
Simple Barchart Example
./examples/barchart_example.py
from reactpy import component, html, run
from reactpy_apexcharts import ApexChart

@component
def AppMain():

    return html.div(

        ApexChart(
            options = {
                'chart': {'id': 'apex-chart-example'},
                'xaxis': {
                'categories': [1991, 1992, 1993, 1994, 1995, 1996, 1997, 1998, 1999]}
            },

            series = [{
                'name': 'series-1',
                'data': [30, 40, 35, 50, 49, 60, 70, 91, 125]
            }],

            chart_type = "bar",
            width=500,
            height=320
        )
    )

# python -m examples.chart_example

if __name__ == "__main__":
    run(AppMain)
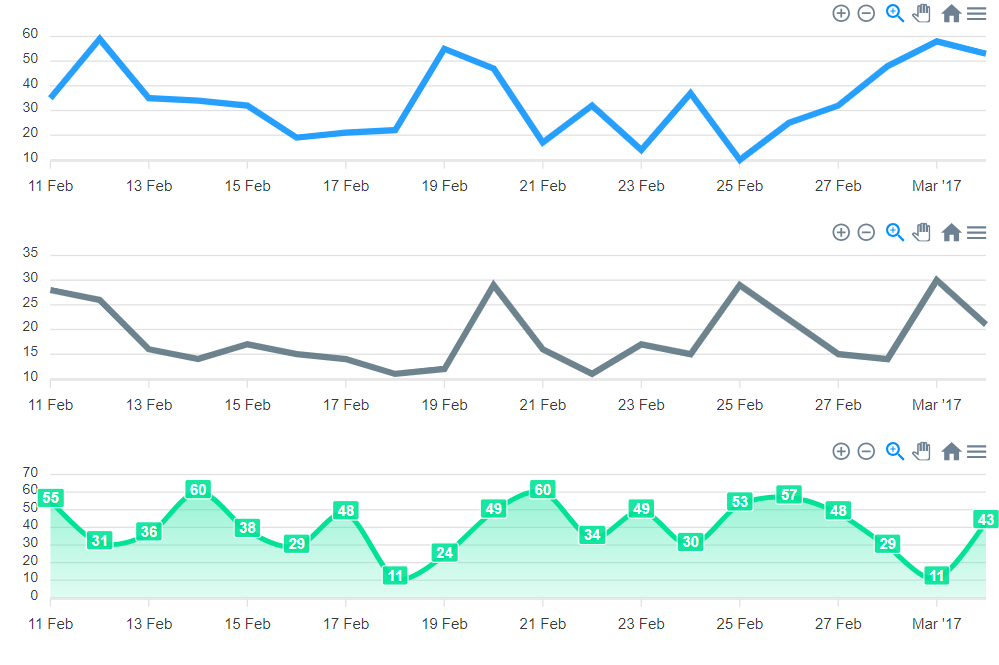
More complex area chart
syncing_chart.py, is a more complex example showing how to control color, grids and format X & Y axis labels.
./examples/syncing_chart.py
from reactpy import component, html, run
from reactpy_apexcharts import ApexChart

DATE = dt(2017, 2, 11)

options = {
    "series": [{"data": time_series(DATE, 20, {"min": 10, "max": 60})}],
    "chart": {"id": "fb", "group": "social", "type": "line", "height": 160},
    "xaxis": {'type': 'datetime'},
    "colors": ["#008FFB"],
}

optionsLine2 = {
    "series": [{"data": time_series(DATE, 20, {"min": 10, "max": 30})}],
    "chart": {"id": "tw", "group": "social", "type": "line", "height": 160},
    "xaxis": {'type': 'datetime'},
    "colors": ["#546E7A"],
}

optionsArea = {
    "series": [{"data": time_series(DATE, 20, {"min": 10, "max": 60})}],
    "chart": {"id": "yt","group": "social","type": "area","height": 160},
    "xaxis": {'type': 'datetime'},
    "colors": ["#00E396"]
}


@component
def CustomChart(options):
    return  html.div({'style': {'min-height': '175px'}},
        ApexChart(options=options),
    )

@component
def AppMain():
    return html.div(
        CustomChart(options=options),
        CustomChart(options=optionsLine2),
        CustomChart(options=optionsArea),
    )


# python -m examples.syncing_chart

if __name__ == "__main__":
    run(AppMain)


Download files
Download the file for your platform. If you're not sure which to choose, learn more about installing packages.
Source Distribution
Built Distribution
Filter files by name, interpreter, ABI, and platform.
If you're not sure about the file name format, learn more about wheel file names.
Copy a direct link to the current filters
File details
Details for the file reactpy_apexcharts-0.0.12.tar.gz.
File metadata
- Download URL: reactpy_apexcharts-0.0.12.tar.gz
- Upload date:
- Size: 1.6 MB
- Tags: Source
- Uploaded using Trusted Publishing? No
- Uploaded via: poetry/1.8.3 CPython/3.11.4 Linux/5.15.153.1-microsoft-standard-WSL2
File hashes
| Algorithm | Hash digest | |
|---|---|---|
| SHA256 |
2a34c88a39415a1b92bba2c59753bb294355fdb9891122cd01d829516a562d66
|
|
| MD5 |
1e570d73814c0f078942fba89d307e9f
|
|
| BLAKE2b-256 |
6e66f2778206e9f31c179afa30bc3ba1cec679a2d389d66bbcb49083b41623b5
|
File details
Details for the file reactpy_apexcharts-0.0.12-py3-none-any.whl.
File metadata
- Download URL: reactpy_apexcharts-0.0.12-py3-none-any.whl
- Upload date:
- Size: 1.6 MB
- Tags: Python 3
- Uploaded using Trusted Publishing? No
- Uploaded via: poetry/1.8.3 CPython/3.11.4 Linux/5.15.153.1-microsoft-standard-WSL2
File hashes
| Algorithm | Hash digest | |
|---|---|---|
| SHA256 |
baec728051a79c7358b231e7a59bdaa4328f634d9ab5460fce6e4cb82e990431
|
|
| MD5 |
3d4bc5d132add608000c2efb117c69ec
|
|
| BLAKE2b-256 |
fdc5b892083cd65468d81d5df7fd27b8c51131a6c2d34cc38cb8bc3226a33f71
|


