A smart and lightweight toolkit for regression modeling, statistical summaries, and Excel annotations.

Project description
regmonkey
regmonkey is a lightweight Python package designed to streamline data analysis and regression modeling tasks. It simplifies tasks like descriptive statistics, dummy variable creation, regression model estimation, and exporting annotated Excel files.
Features
- 📊 Descriptive Statistics: Easily generate clean and rounded summary statistics from a DataFrame.
- 🧠 Smart Variable Parsing: Automatically interpret log transformations, polynomial terms, and interaction terms.
- 📦 Dummy Variable Creation: Quickly convert categorical variables into dummy/indicator variables.
- 📈 Regression Analysis: Run multiple linear regressions with support for log, power, and interaction terms, and export well-formatted result tables.
- 📄 Excel Footer Annotation: Add footnotes to Excel files automatically.
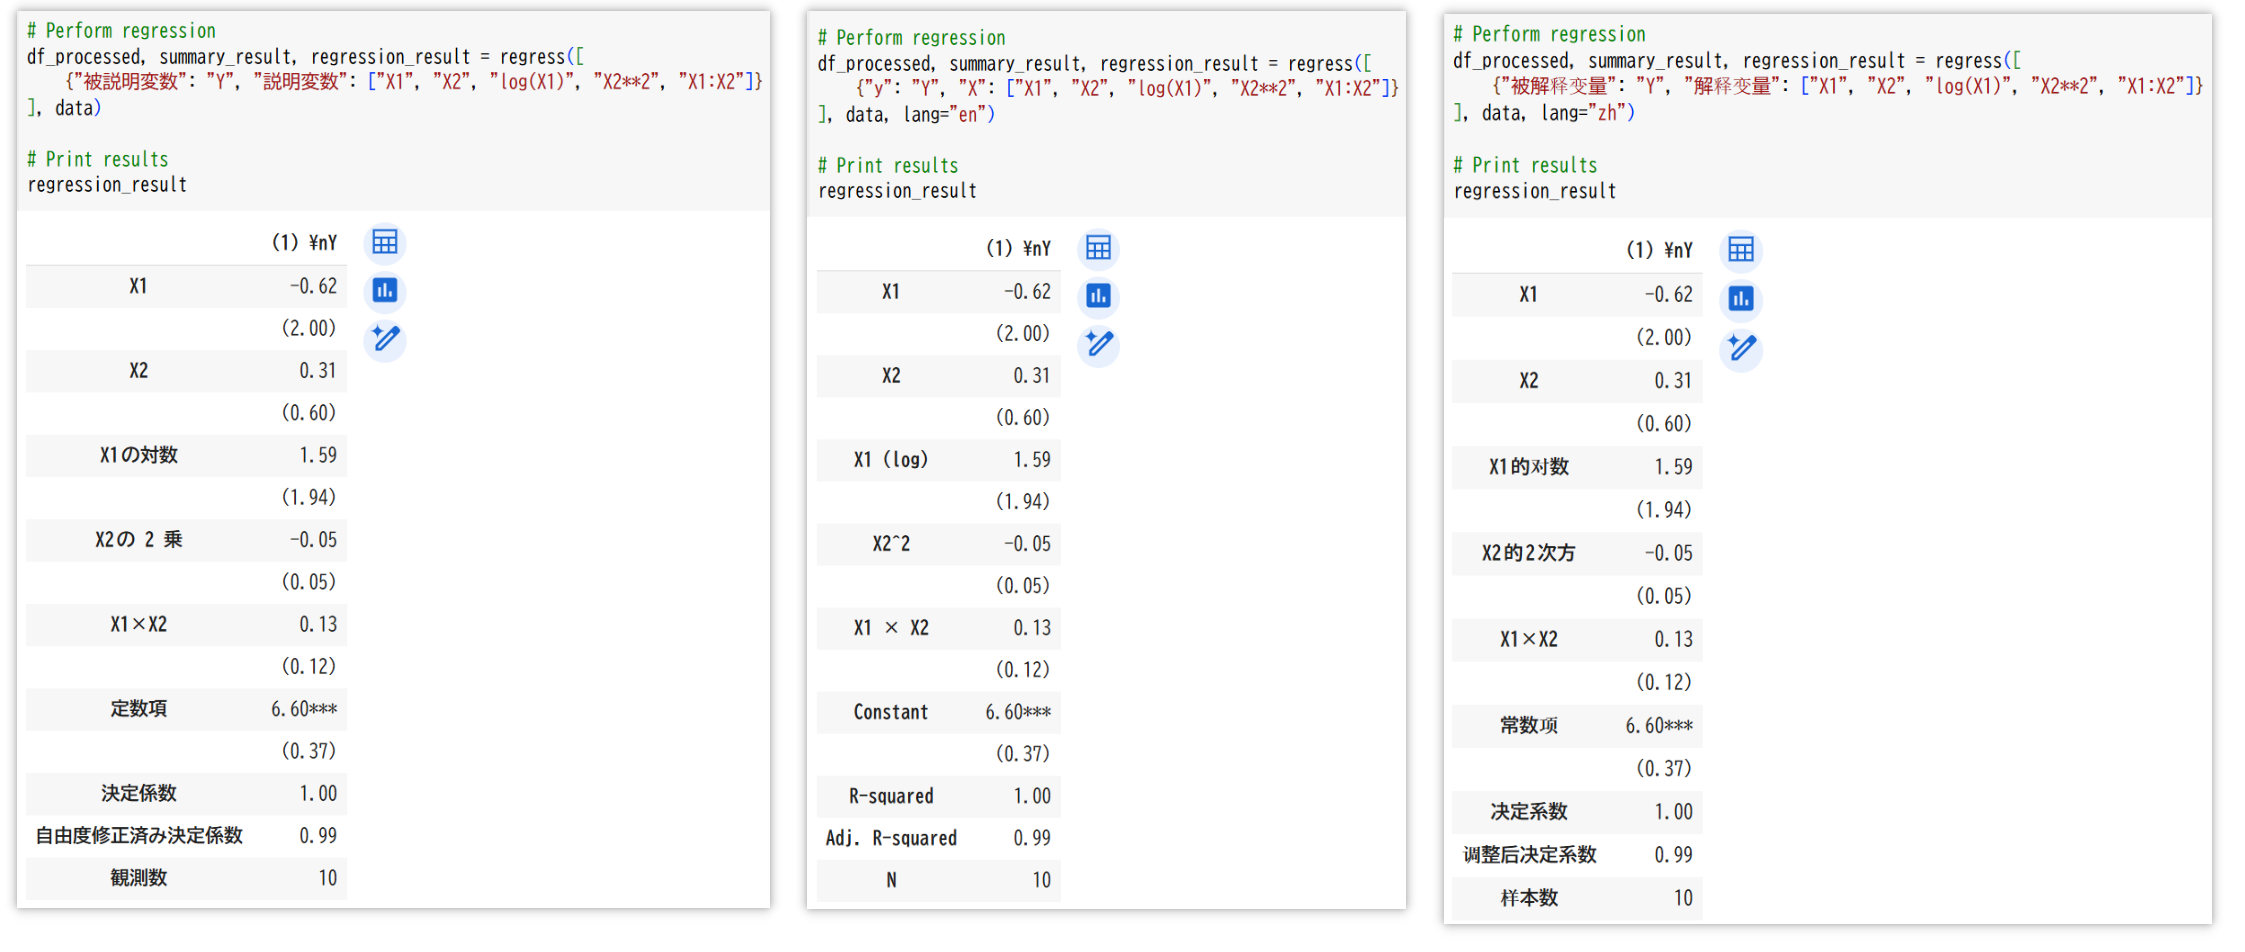
- 🌐 Multilingual Support: Specify variables in any supported language (English, Japanese, or Chinese) and control output language independently using the
langparameter for consistent formatting across all results.
Installation
pip install regmonkey
Functions
add_footer(file_path, value, sheet_name=None)
Adds a footer note to the last row of an Excel sheet.
Arguments:
file_path(str): Path to the Excel file.value(str): The content of the footer note.sheet_name(str, optional): Name of the sheet to modify. Defaults to the first sheet.
Example:
from regmonkey.stats import add_footer

add_footer("example.xlsx", "Note: Data is preliminary.", sheet_name="Sheet1")
get_dummies(df, columns)
Converts categorical variables into dummy/indicator variables.
Arguments:
df(DataFrame): The input DataFrame.columns(list of str): List of column names to convert.
Returns:
- A new DataFrame with dummy variables.
Example:
from regmonkey.stats import get_dummies
import pandas as pd

data = pd.DataFrame({"Year": ["2020", "2021", "2022"], "Value": [10, 20, 30]})
dummies = get_dummies(data, columns=["Year"])
print(dummies)
summary(df, var_list, round_digits=2, lang="ja")
Calculates descriptive statistics for the specified variables.
df: DataFrame containing the datavar_list: List of variable namesround_digits: Number of decimal places (default: 2)lang: Language code ("ja", "en", "zh") for output labels (default: "ja")
Note: By default (when lang is not specified), the output will be in Japanese.
Returns a DataFrame with the following statistics:
- N (Sample size)
- Mean
- Std. Dev. (Standard deviation)
- Min (Minimum value)
- Max (Maximum value)
Example:
# Default (Japanese labels)
summary_stats = summary(df, ["X1", "X2"])

# English labels
summary_stats = summary(df, ["X1", "X2"], lang="en")

# Japanese labels
summary_stats = summary(df, ["X1", "X2"], lang="ja")

# Chinese labels
summary_stats = summary(df, ["X1", "X2"], lang="zh")
regress(variables_dicts, df, decimal_places=2, lang="ja", cov_type="HC1", dynamic_format=True)
Performs regression analysis with support for log, power, and interaction terms.
Arguments:
variables_dicts(list of dict): List of dictionaries specifying dependent and independent variables.- Multilingual Support: You can use different language keys for variables:
- Japanese:
{"被説明変数": "Y", "説明変数": ["X1", "X2"]} - English:
{"y": "Y", "X": ["X1", "X2"]} - Chinese:
{"被解释变量": "Y", "解释变量": ["X1", "X2"]}
- Japanese:
- Log terms: Use
log(X1)for the natural logarithm ofX1. - Power terms: Use
X2**2orX2**3for squared or cubed terms. - Dummy variables: For binary variables, use them directly (e.g.,
['Gender']). For categorical variables, preprocess the DataFrame usingget_dummies(e.g.,['Year_1990', 'Year_1995']). - Interaction terms: Use
X1:X2for the interaction betweenX1andX2, or combine transformations likeX1**2:log(X2).
- Multilingual Support: You can use different language keys for variables:
df(DataFrame): The input data.decimal_places(int): Number of decimal places for results.lang(str): Language code ("ja", "en", "zh") for output labels (default: "ja")cov_type(str): Type of standard error calculation (default: "HC1")- "HC1": White's standard errors with small sample correction
- "HC0": White's standard errors
- "HC2": MacKinnon's standard errors
- "HC3": Davidson-MacKinnon's standard errors
- "nonrobust": Conventional standard errors
dynamic_format(bool): WhenTrue, dynamically adjusts decimal places to preserve significant digits (default:True). Useful when variables have very different scales, e.g. a coefficient of 0.000234 will display as "0.00023" instead of "0.00" withdecimal_places=2. Set toFalseto use fixed decimal places.
Note: By default (when lang is not specified), the output will be in Japanese.
Returns:
- A tuple containing:
- Processed DataFrame.
- Descriptive statistics for used variables.
- Regression results table.
Example:
from regmonkey.stats import regression
import pandas as pd

# Sample data
data = pd.DataFrame({
    "X1": [1, 2, 3],
    "X2": [4, 5, 6],
    "Y": [7, 8, 9],
    "Category": ["A", "B", "A"]
})

# Preprocess categorical variables
data_with_dummies = pd.get_dummies(data, columns=["Category"])

# Define regression variables (Japanese)
variables_ja = [
    {"被説明変数": "Y", "説明変数": ["X1", "X2", "log(X1)", "X2**2", "X1:X2"]}
]

# Define regression variables (English)
variables_en = [
    {"y": "Y", "X": ["X1", "X2", "log(X1)", "X2**2", "X1:X2"]}
]

# Define regression variables (Chinese)
variables_zh = [
    {"被解释变量": "Y", "解释变量": ["X1", "X2", "log(X1)", "X2**2", "X1:X2"]}
]

# Perform regression with default output (Japanese)
df_processed, summary_result, regression_result = regress(variables_ja, data_with_dummies)

# Perform regression with Japanese output
df_processed, summary_result, regression_result = regress(variables_ja, data_with_dummies, lang="ja")

# Perform regression with English output
df_processed, summary_result, regression_result = regress(variables_en, data_with_dummies, lang="en")

# Perform regression with Chinese output
df_processed, summary_result, regression_result = regress(variables_zh, data_with_dummies, lang="zh")

# Perform regression with fixed decimal places (disabling dynamic formatting)
df_processed, summary_result, regression_result = regress(variables_en, data_with_dummies, dynamic_format=False)

# Print results
print(regression_result)
In this example:
- The regression can be specified using any of the supported languages (Japanese, English, or Chinese).
- The output language is determined by the
langparameter, not by the input keys. log(X1)computes the natural logarithm ofX1.X2**2computes the square ofX2.X1:X2computes the interaction betweenX1andX2.- Dummy variables for
Categoryare automatically created usingget_dummies. - The output labels (e.g., "観測数"/"N"/"样本数") will match the language specified by the
langparameter. - By default (
dynamic_format=True), very small coefficients are displayed with enough decimal places to show meaningful digits, instead of being rounded to "0.00".
interpret_result(df_result, lang="ja")
Interprets regression results and generates a human-readable text description.
Arguments:
df_result(DataFrame): The regression results table returned by theregressfunction.lang(str, optional): Language code ("ja", "en", "zh") for output text (default: "ja")
Returns:
- A string containing an interpretation of the regression results, including:
- Model description (dependent variable regressed on independent variables)
- Coefficient estimates and significance levels for each variable
- Adjusted R-squared for each model
Note: By default (when lang is not specified), the output will be in Japanese.
Example:
from regmonkey.stats import regress, interpret_result
import pandas as pd

# Sample data
data = pd.DataFrame({
    "X1": [1, 2, 3, 4, 5],
    "X2": [2, 3, 4, 5, 6],
    "Y": [3, 5, 7, 9, 11]
})

# Perform regression
variables = [
    {"y": "Y", "X": ["X1", "X2"]}
]
df_processed, summary_result, regression_result = regress(variables, data, lang="ja")

# Interpret results
interpretation = interpret_result(regression_result, lang="ja")
print(interpretation)
The output will be in Japanese (default):
モデル(1)ではYをX1、X2に回帰した。
X1の係数の推定値は1.00となり、10%の有意水準でも有意に推定されていない。
X2の係数の推定値は1.00となり、10%の有意水準でも有意に推定されていない。
モデル(1)の自由度修正済み決定係数は0.50である。
For English output:
interpretation = interpret_result(regression_result, lang="en")
print(interpretation)
For Chinese output:
interpretation = interpret_result(regression_result, lang="zh")
print(interpretation)
Usage Example
import pandas as pd
from regmonkey.stats import get_dummies, regress, interpret_result, add_footer

# Load data
data = pd.DataFrame({
    "X1": [1, 2, 3, 4, 5],
    "X2": [2, 3, 4, 5, 6],
    "Y": [3, 5, 7, 9, 11],
    "Category": ["A", "B", "A", "B", "A"]
})

# Create dummy variables
data_with_dummies = get_dummies(data, columns=["Category"])

# Perform regression with log, power, and interaction terms (using English keys)
variables = [
    {"y": "Y", "X": ["X1", "X2"]},
    {"y": "Y", "X": ["X1", "X2", "log(X1)", "X2**2"]}
]
df_processed, summary_result, regression_result = regress(variables, data_with_dummies, lang="en")

# Interpret regression results
interpretation = interpret_result(regression_result, lang="en")
print(interpretation)

# Save regression results to Excel and add a footer
regression_result.to_excel("regression_results.xlsx", index=True)
add_footer("regression_results.xlsx", "Note: Regression results include log, power, and interaction terms.")

# Save summary statistics to Excel and add a footer
summary_result.to_excel("summary_statistics.xlsx", index=True)
add_footer("summary_statistics.xlsx", "Note: Summary statistics for all variables used in the regression analysis.")

# Save interpretation to a text file
with open("interpretation.txt", "w", encoding="utf-8") as f:
    f.write(interpretation)
For a more comprehensive example, see example.py in examples folder.


Download files
Download the file for your platform. If you're not sure which to choose, learn more about installing packages.
Source Distribution
Built Distribution
Filter files by name, interpreter, ABI, and platform.
If you're not sure about the file name format, learn more about wheel file names.
Copy a direct link to the current filters
File details
Details for the file regmonkey-0.1.5.tar.gz.
File metadata
- Download URL: regmonkey-0.1.5.tar.gz
- Upload date:
- Size: 15.7 kB
- Tags: Source
- Uploaded using Trusted Publishing? No
- Uploaded via: twine/6.2.0 CPython/3.11.3
File hashes
| Algorithm | Hash digest | |
|---|---|---|
| SHA256 |
473378889b6a9d648080d2da9ae8f8b4ab8520ca288b622c1de98b80101d1f51
|
|
| MD5 |
4f4573daef7fd44ed256bb036bf270f8
|
|
| BLAKE2b-256 |
d680ed8b33bb07d40a0c048d59984ff9947ab84da4d4fba0d9d6ea9b2794bc31
|
File details
Details for the file regmonkey-0.1.5-py3-none-any.whl.
File metadata
- Download URL: regmonkey-0.1.5-py3-none-any.whl
- Upload date:
- Size: 12.2 kB
- Tags: Python 3
- Uploaded using Trusted Publishing? No
- Uploaded via: twine/6.2.0 CPython/3.11.3
File hashes
| Algorithm | Hash digest | |
|---|---|---|
| SHA256 |
8649ba996e8b414e864a023f848e48a16c60c9759f80d31365577d72e8ada150
|
|
| MD5 |
03a5d93024048a3e1774e8b2a00dc66b
|
|
| BLAKE2b-256 |
61a92599e5c2c48fd50225a01925e42a355b7dca4c4f2911739dd7532d847ff7
|


