Charting spatial ligand-target activity using Renoir (ligand-taRgEt iNteractions acrOss spatIal topogRaphy)

Project description
Charting spatial ligand-target activity using Renoir


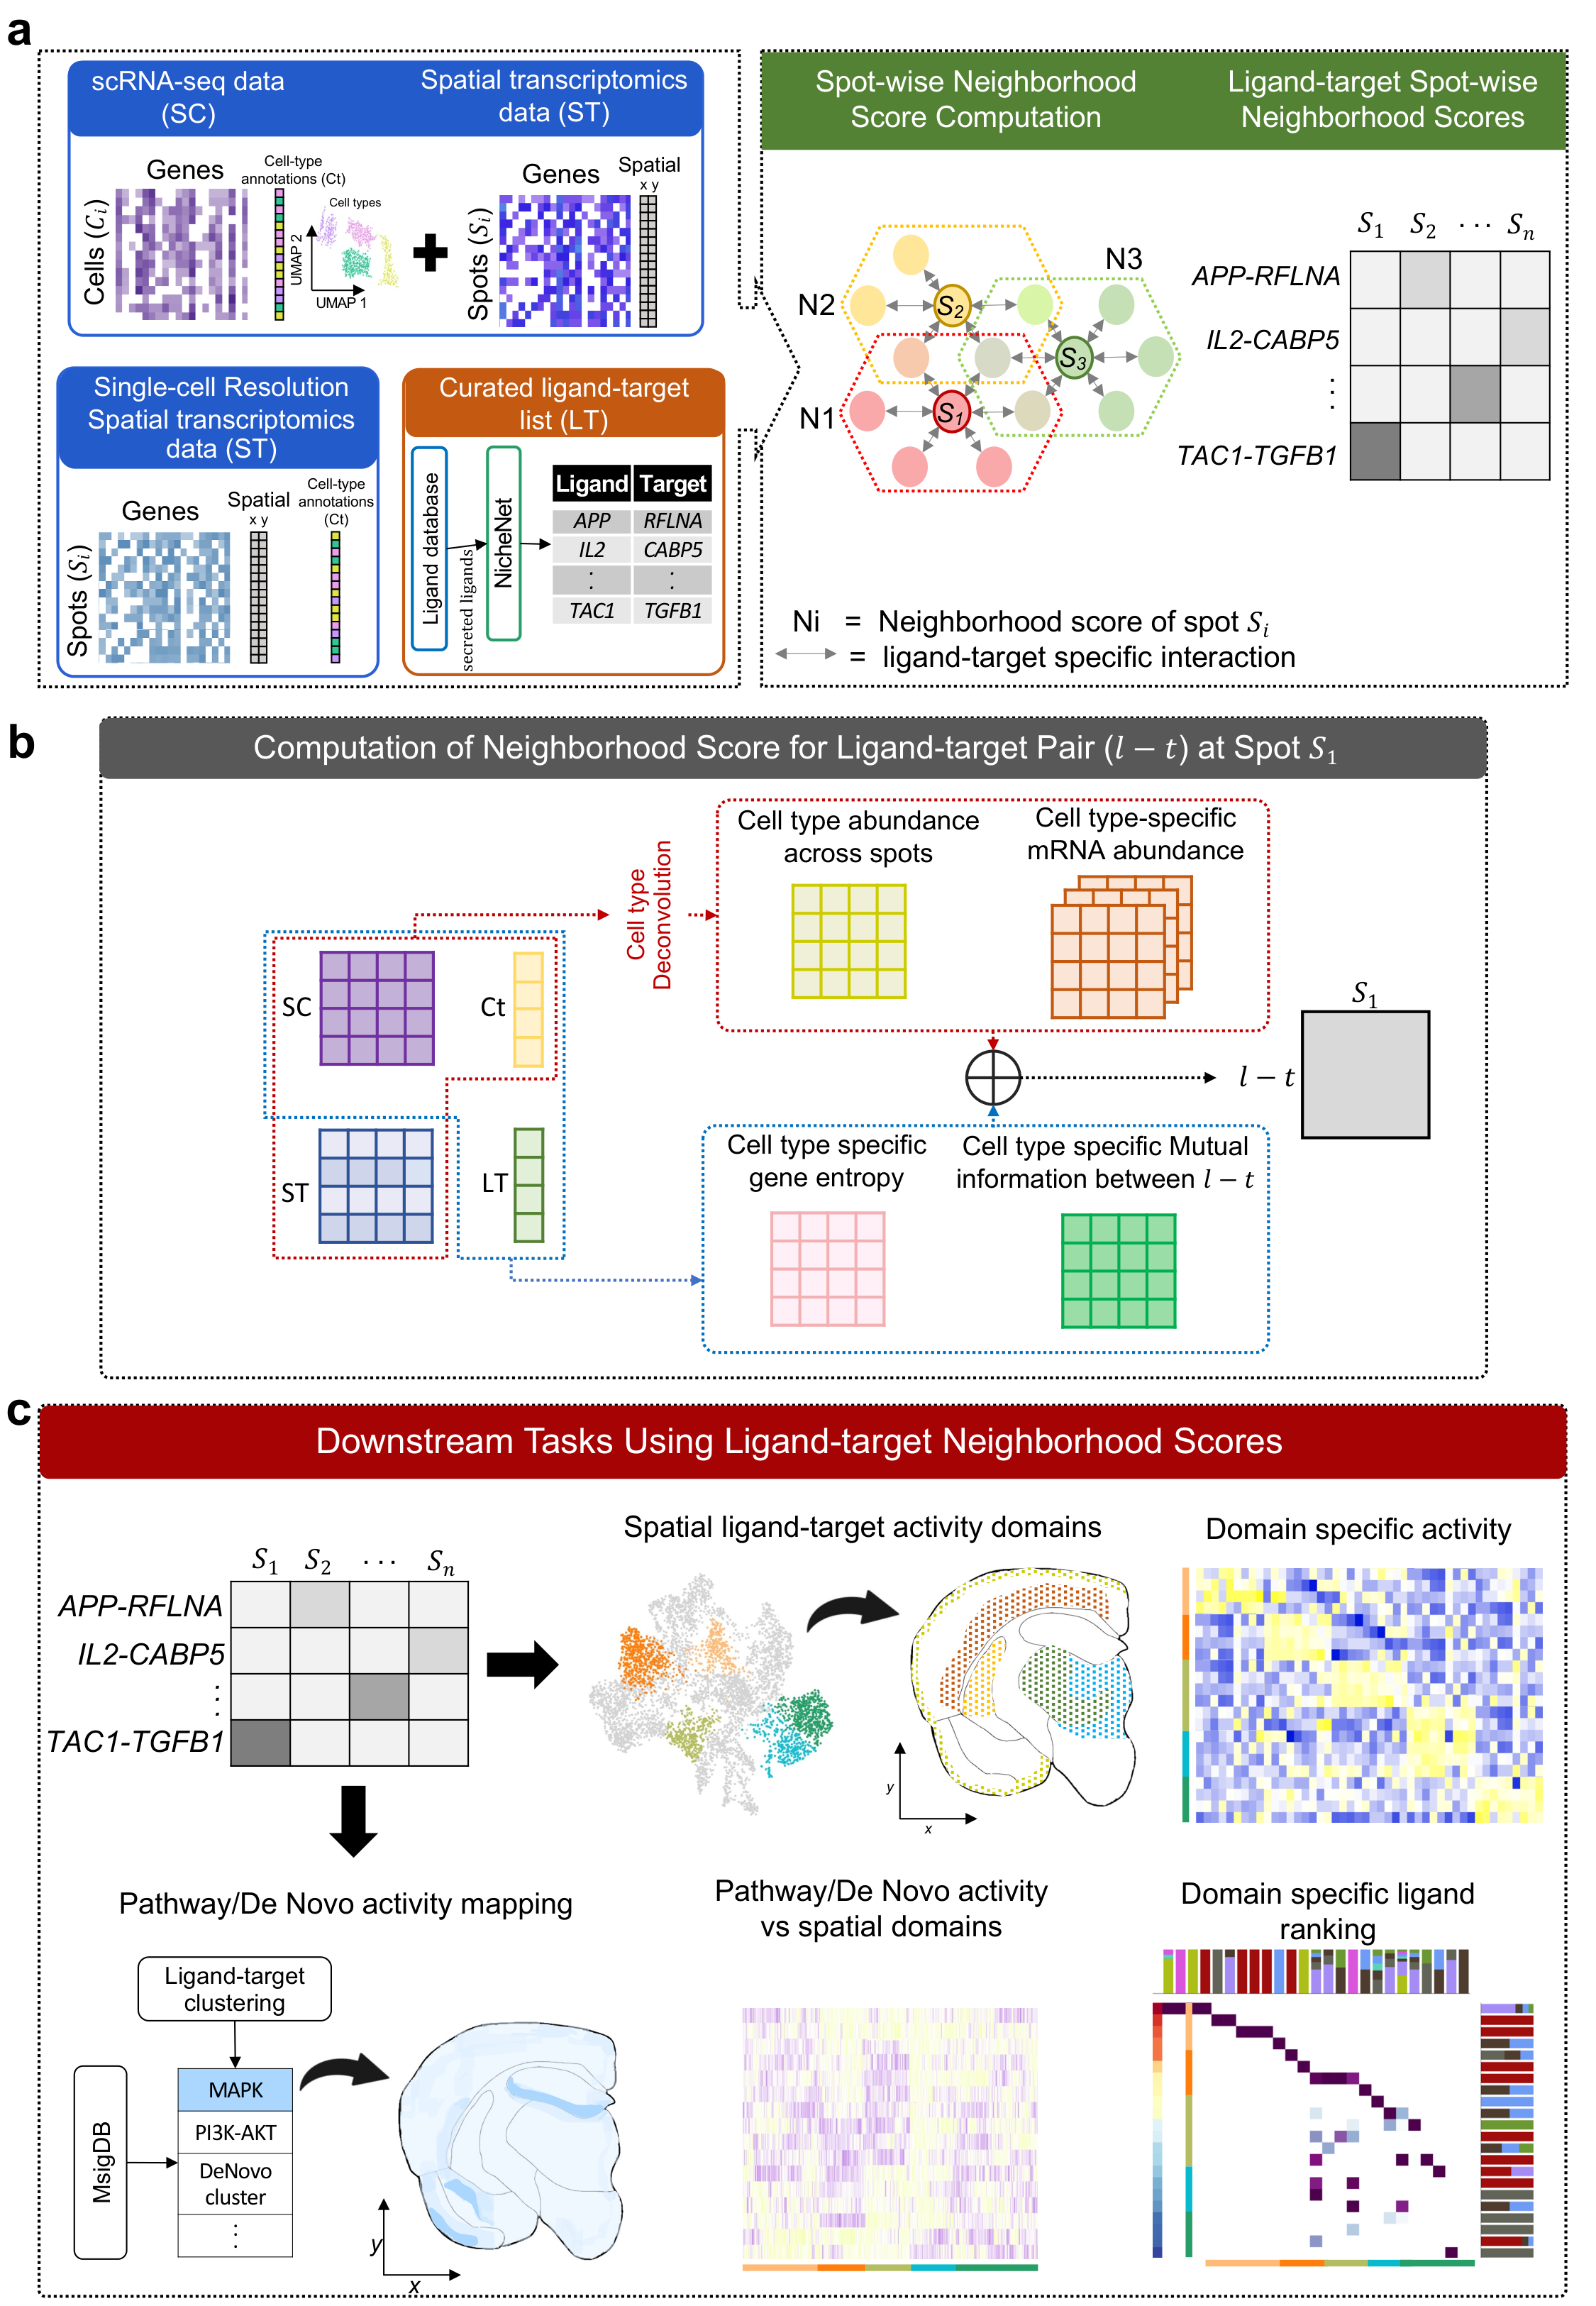
Renoir is an information-theory-based scoring metric for quantifying the activity between a ligand and its target gene given a specific spatial context. Renoir can also infer spatial communication domains that harbor similar ligand-target activities. Renoir also identifies spatially enriched ligand-target gene sets (pathway activity) and characterizes domain-specific activities between ligands and targets.
Requirements
All requirements are provided in the renoir.yml file. It is recommended to utilize the same versions as provided in renoir.yml file.
Quick Start
This example walks through a complete Renoir workflow on a 10x Genomics Visium spatial transcriptomics dataset.
Installation
Via: pip
pip install renoir-spatial
Via: conda
conda env create -f renoir.yml
pip install .
Note:
cell2locationmust be installed separately. See cell2location installation.
Step 1 — Imports
import Renoir
import scanpy as sc
import pandas as pd
import numpy as np
Step 2 — Required inputs
Renoir requires the following input files:
| Input | Description |
|---|---|
ST_path |
Spatial transcriptomics AnnData (.h5ad) |
SC_path |
Matched scRNA-seq reference AnnData with annotated cell types (.h5ad) |
pairs_path |
CSV of ligand–target pairs to score |
ligand_receptor_path |
Curated ligand–receptor pair table (e.g. from NATMI / OmniPath) |
celltype_proportions_path |
CSV of per-spot cell-type proportions (e.g. from cell2location) |
expins_path |
Cell-type-specific mRNA abundance pickle (see format note below) |
mRNA abundance file format
mRNA_abundance.pklmust be a dictionary where each key is a gene name and each value is the cell-type-specific mRNA abundance for that gene across all spots. Two formats are supported:Format 1 — dictionary of DataFrames:
{
    'GENE1': pd.DataFrame(  # shape: (n_spots, n_celltypes)
        index=['spot_1', 'spot_2', ...],       # spot barcodes
        columns=['CellType_A', 'CellType_B', ...],
    ),
    'GENE2': pd.DataFrame(...),
    ...
}
Each cell in the DataFrame holds the expression of that gene attributed to that cell type in that spot.
Format 2 — dictionary of CSR matrices with shared index keys:
{
    'GENE1': scipy.sparse.csr_matrix(...),  # shape: (n_spots, n_celltypes)
    'GENE2': scipy.sparse.csr_matrix(...),
    ...
    'cells':     ['spot_1', 'spot_2', ...],  # row indices, shared across all matrices
    'celltypes': ['CellType_A', 'CellType_B', ...],  # column indices, shared across all matrices
}
In Format 2, the
'cells'and'celltypes'keys provide the row and column labels shared across all gene matrices.Cell-type-specific mRNA abundance values can be computed from cell2location. Currently Renoir also provides a naïve approach to computing cell-type-specific mRNA abundance by setting
expins_path=Nonein thecompute_neighborhood_scoresfunction.
Step 3 — Compute neighborhood scores
neighborhood_scores = Renoir.compute_neighborhood_scores(
    SC_path='path/to/scRNA.h5ad',
    ST_path='path/to/ST.h5ad',
    pairs_path='path/to/lt_pairs.csv',
    ligand_receptor_path='path/to/All_human_lrpairs.csv',
    celltype_proportions_path='path/to/celltype_proportions.csv',
    expins_path='path/to/mRNA_abundance.pkl',
)
Documentation
For full tutorials including Visium, CosMx, VisiumHD, and Xenium workflows, see the documentation.
References
If you use Renoir, please cite our paper:
Rao, N., Kumar, T., Kazemi, D. et al. Charting spatial ligand-target activity using Renoir. Nature Communications 17, 3983 (2026). https://doi.org/10.1038/s41467-026-72388-7
Release history Release notifications | RSS feed

Download files
Download the file for your platform. If you're not sure which to choose, learn more about installing packages.
Source Distribution
Built Distribution
Filter files by name, interpreter, ABI, and platform.
If you're not sure about the file name format, learn more about wheel file names.
Copy a direct link to the current filters
File details
Details for the file renoir_spatial-1.0.0.tar.gz.
File metadata
- Download URL: renoir_spatial-1.0.0.tar.gz
- Upload date:
- Size: 31.1 kB
- Tags: Source
- Uploaded using Trusted Publishing? No
- Uploaded via: twine/6.2.0 CPython/3.9.13
File hashes
| Algorithm | Hash digest | |
|---|---|---|
| SHA256 |
11bcc734fa594df527db86f1cfb5c77f6a4c27e7c9751990764e01b2826a32a7
|
|
| MD5 |
e8eec42567c1af6a42b2768683e3045c
|
|
| BLAKE2b-256 |
61e15dc913a432fcdf6b80e1e940bff6f3f6083cc5f16b4a54aca63d4d36dc8c
|
File details
Details for the file renoir_spatial-1.0.0-py3-none-any.whl.
File metadata
- Download URL: renoir_spatial-1.0.0-py3-none-any.whl
- Upload date:
- Size: 22.0 kB
- Tags: Python 3
- Uploaded using Trusted Publishing? No
- Uploaded via: twine/6.2.0 CPython/3.9.13
File hashes
| Algorithm | Hash digest | |
|---|---|---|
| SHA256 |
1ba8874716cbd945d4f21e23c678631123d6b081dcd16d2ea6a1d94bd7319b35
|
|
| MD5 |
7fc195426c4429fd152be5a082314afe
|
|
| BLAKE2b-256 |
6e3d281f4a72bc3203053f343128848eeb7ef29f08c97541f9b9374ff103adea
|


