
repelly




Repelling, non-overlapping text labels for Plotly in Python, in the spirit of R's ggrepel.
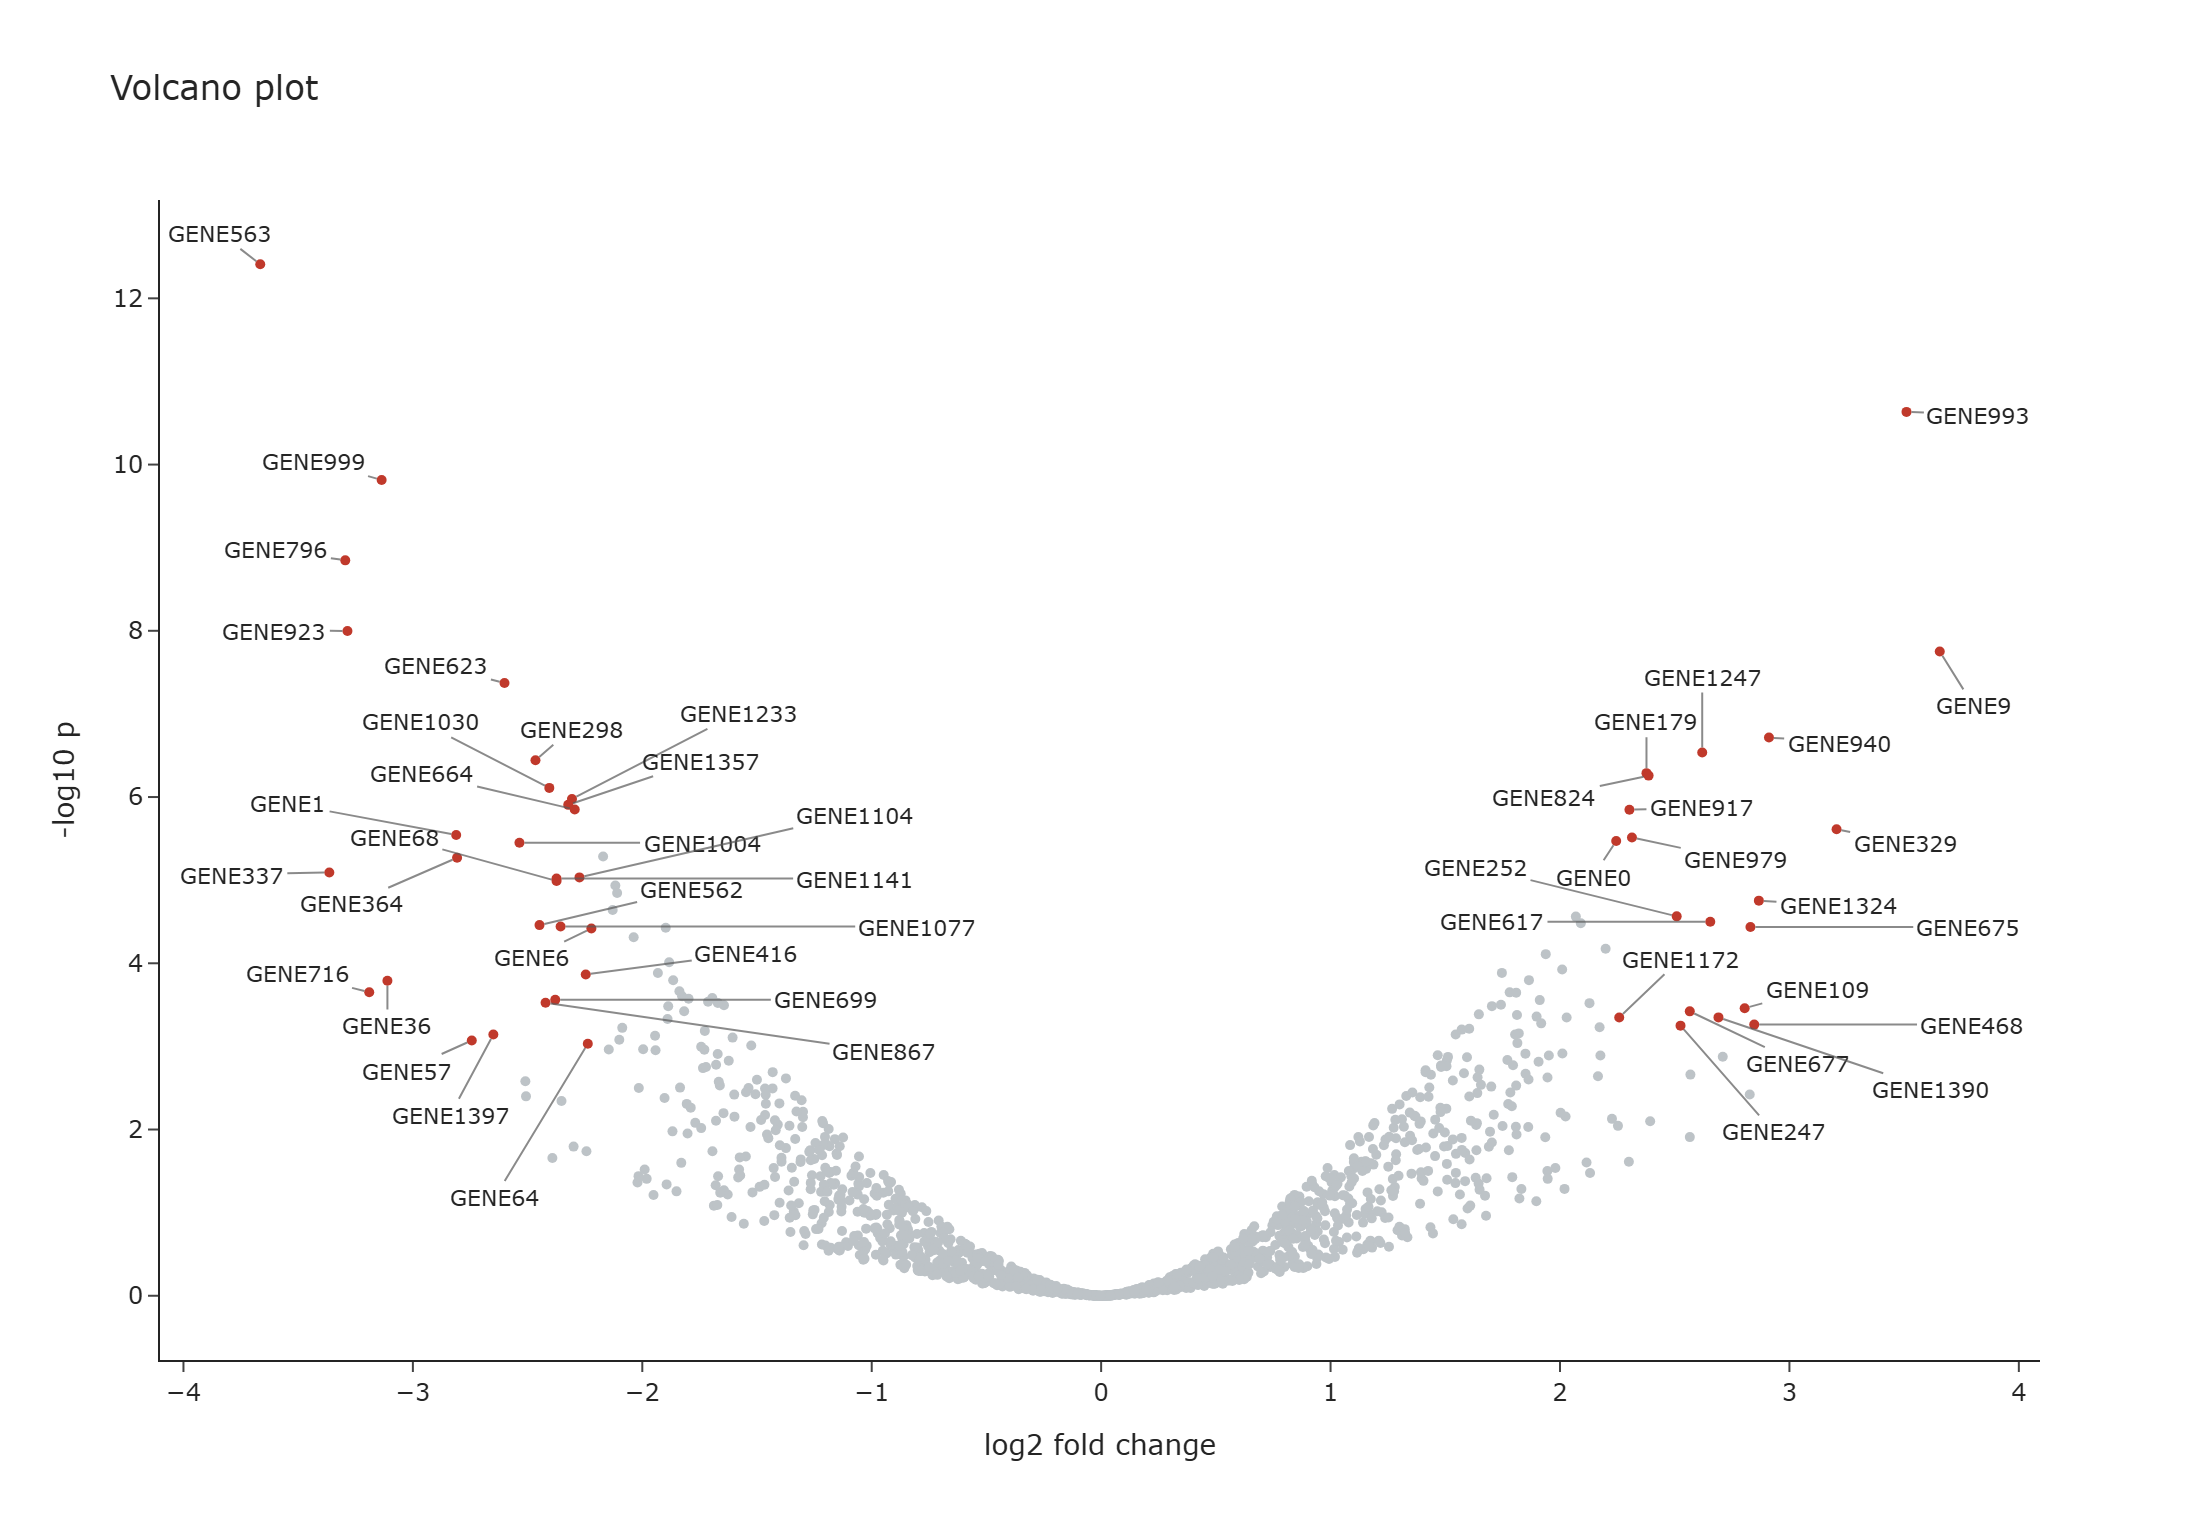
Features
- Labels are solved in the browser and re-solved on zoom, pan, resize and animation.
- Labels stay clear of each other and of every marker in the subplot.
- They are native Plotly annotations, so they appear in the modebar's PNG download.
- Works with
plotly.express, including facets, animations andscattergl. - Supports linear, log, date, category and reversed axes.
- Runs in HTML files, the browser, notebooks, Dash and Streamlit, and exports to static images.
Installation
pip install repelly
Optional extras add static image export, Dash and Streamlit:
pip install "repelly[static]"
pip install "repelly[dash]"
pip install "repelly[streamlit]"
Requires Python 3.10+ and Plotly 6.2+.
Quick start
import pandas as pd
import plotly.express as px
from repelly import add_text_repel

df = pd.DataFrame(
    {
        "x": [1, 1.05, 1.02, 0.98, 1.5, 2.0],
        "y": [2, 2.02, 2.05, 1.97, 2.5, 3.0],
        "gene": ["TP53", "EGFR", "MYC", "PTEN", "BRCA1", "KRAS"],
    }
)

fig = px.scatter(df, x="x", y="y")
fig = add_text_repel(fig, df.x, df.y, df.gene)
fig.show()
add_text_repel returns a copy of your figure as a RepelFigure, so keep the returned
value. It is a go.Figure whose show, to_html, write_html, to_image and
write_image methods include the labels. plotly.io.show(fig) bypasses them, so call
the figure's own methods. If an operation hands back a plain go.Figure,
as_repel_figure(fig) restores it.
Usage
Boxed labels
add_label_repel takes the same arguments and draws each label on a filled box:
from repelly import add_label_repel

fig = add_label_repel(fig, df.x, df.y, df.gene, label={"bgcolor": "lightyellow"})
Labelling existing traces
Omit x and y to label the points of scatter traces already in the figure. This is the
simplest route for facets and animations. Labels hide when their trace is hidden from the
legend, and each animation frame gets its own labels.
fig = px.scatter(df, x="gdpPercap", y="lifeExp", facet_col="continent", text="country")
fig.update_traces(mode="markers")  # repelly draws the text
fig = add_text_repel(fig)

fig = px.scatter(df, x="x", y="y", custom_data=["name"])
fig = add_text_repel(fig, text=lambda trace: trace.customdata[:, 0])
text defaults to each trace's text, then hovertext. Narrow the traces with
selector, row and col.
Subplots
For explicit coordinates, choose the subplot with row and col, or xref and yref:
fig = add_text_repel(fig, x, y, names, row=1, col=2)
Dash
Call init_app once. Figures then work as normal, including as callback outputs:
from dash import Dash, dcc
import repelly.dash

app = Dash(__name__)
repelly.dash.init_app(app)
app.layout = dcc.Graph(figure=fig)
Placing labels for the first time, or changing which labels are shown, updates the
graph's layout, so a callback listening to relayoutData also fires then. When a
re-solve only moves labels, repelly moves them in place without a relayout, so that
callback does not fire.
Streamlit
st.plotly_chart sends only the figure, not the script that places the labels, so
init adds that script to the page. Call it in each run of the script, then use
st.plotly_chart as normal:
import streamlit as st
import repelly.streamlit

repelly.streamlit.init()
st.plotly_chart(fig)
Labels re-solve on zoom, resize and reruns, and work with on_select, tabs and multipage
apps. init needs Streamlit 1.52 or newer. It runs repelly's script in the page through
st.html(..., unsafe_allow_javascript=True).
Notebooks
JupyterLab uses its built-in Plotly, so charts work offline and add little to the notebook. When you reopen a saved notebook, JupyterLab shows a saved preview without labels until you hover over the chart.
VS Code needs internet access for notebook charts. It does not let scripts reach its
built-in Plotly, so repelly shows each chart in an iframe that loads Plotly from a CDN.
Offline, the chart shows a message instead. To work offline anyway, call
fig.show(include_plotlyjs=True), which embeds about 5 MB in each output. HTML files,
browser output, Dash and static images all work offline in VS Code as usual.
Static images
fig.write_image(...) and fig.to_image(...) solve the labels in headless Chrome, using
Kaleido's browser or any installed Chrome, Chromium or Edge (set BROWSER_PATH to choose
one). Positions are computed for the export size.
repelly.bake(fig, width=..., height=...) returns a plain figure with the positions
fixed, if you need one to pass elsewhere.
Options
| Argument | Default | Purpose |
|---|---|---|
row, col, secondary_y, xref, yref |
primary axes | Target subplot for explicit x and y |
selector |
all traces | Which traces to label when x and y are omitted |
priority |
none | Higher values survive culling first |
visible |
all | Boolean mask; hidden points still repel other labels |
frame |
none | Animation frame name per label, for explicit x and y |
force |
1.0 |
Separation strength, effective range 0.05 to 1 |
force_pull |
1.0 |
Pull back towards the anchor |
box_padding, point_padding |
2, 2 |
Gaps in pixels |
direction |
"both" |
Restrict movement to "x" or "y"; one value or one per label |
color |
font colour | Text colour; one value, one per label, or "trace" to match each point when labelling traces |
nudge_x, nudge_y |
0 |
Preferred offset from the point in pixels, positive right and up; one value or one per label |
xlim, ylim |
plot area | (low, high) data values labels must stay within; None leaves a side open |
max_overlaps |
10 |
Drop a label starting on more than this many higher-priority labels; None keeps all |
max_labels |
none | Maximum labels per subplot from this call, by priority |
max_iter, max_time_ms |
400, 40 |
Solver limits for one solve; time in milliseconds |
initial_max_time_ms |
250 |
Time limit when labels are first placed; the solver stops sooner if it finishes |
seed |
42 |
Makes placement reproducible |
min_segment_length |
6 |
Hide the connector below this distance in pixels |
avoid_points |
True |
Keep labels off every marker in the subplot |
drop_unresolved |
False |
Hide labels that still overlap after solving |
font, segment |
Plotly defaults | Styling; segment takes color, width, arrowhead, arrowsize |
on |
all events | Re-solve on any of "zoom", "resize", "frame"; the first render always solves |
Diagnostics
Labels that are hidden by max_overlaps, or that still overlap another label or cover a
data point after solving, are reported with a warning in the browser console. bake, to_image and write_image
raise the same information as a Python warning.
Limitations
- Only cartesian
scatterandscattergltraces can be labelled from traces. FigureWidgetis not supported.- Configuration lives in
layout.meta, so that must be unset or a dict. Replacing it afterwards removes the labels. - Solving freezes autoranged axes at their current range, because annotations would otherwise change the range they were placed in. Double-click still resets the view.
Development
The project uses pixi. Browser tests need Chrome or Edge installed.
pixi install
pixi run hooks      # format and lint before each commit
pixi run lint       # ruff format and ruff check --fix
pixi run test-all   # Python and JavaScript tests
pixi run -e min test-all   # against the oldest supported dependencies
pixi run check-dist # build and validate the package
If the commit hook reformats files, stage them and commit again.
To release, update __version__ in src/repelly/__init__.py and the matching VERSION
in src/repelly/js/runtime.js, then publish a GitHub release tagged vX.Y.Z.
Acknowledgements
repelly brings the ideas of two R packages to Python:
- ggrepel by Kamil Slowikowski and contributors, the original repelling-label package.
- plotly.repel by Santiago Cano Muniz, which
pioneered browser-side solving for Plotly and the
add_text_repelinterface.
See NOTICE for full credits.
License
Copyright (C) 2026 Moritz Peist. Licensed under the GNU General Public License, version 3 or later.
Interactive output embeds repelly's GPL-licensed JavaScript, so HTML files and Dash pages you distribute contain GPL code. The script keeps its license notice for this purpose. Static images and baked figures do not contain it.
1 maintainer

Metadata
1 maintainer
Release files for repelly 0.3.0
For a detailed explanation of source distributions (sdists) and built distributions (wheels), please see the package formats documentation.
Source distribution (sdist)
| File | Size | Uploaded | Provenance | Actions |
|---|---|---|---|---|
| repelly-0.3.0.tar.gz | 74.2 kB | With provenance | Details for repelly-0.3.0.tar.gz |
Built distribution (wheel)
| File | Interpreter | ABI | Platform | Actions Reset |
|---|---|---|---|---|
| repelly-0.3.0-py3-none-any.whl | Python 3 | none | any | Details for repelly-0.3.0-py3-none-any.whl |
Total release size: 128.8 kB
Release files / repelly-0.3.0.tar.gz
| Download URL | repelly-0.3.0.tar.gz |
|---|---|
| Size | 74.2 kB |
| Tags | Source |
|
SHA-256 checksum How to use checksums |
4f405ebb38b99a2872c0e5ff5570f243f31c1d495edcd04d30d54ef0ec9e102c
|
|
BLAKE2b-256 checksum How to use checksums |
0b883e23ca93401428ad3c8b3ed3133e5c7f0bbfa72213f38faf4f35dc86772a
|
| Upload date | |
|
Uploaded using Trusted Publishing? What is trusted publishing? |
Yes |
| Uploaded via |
twine/7.0.0 CPython/3.13.16
|
Provenance
Provenance describes where a file came from. On PyPI, provenance is shared via attestations, which provide a verifiable record of the build or publishing details. View details, limitations and caveats.


PyPI Publish Attestation
PyPI verified that this artifact, at this checksum, originated from the publisher listed below.
Signed by GitHub Actions, verified by PyPI on Nov 10, 2026.
Transparency logRelease files / repelly-0.3.0-py3-none-any.whl
| Download URL | repelly-0.3.0-py3-none-any.whl |
|---|---|
| Size | 54.6 kB |
| Tags | Python 3 |
|
SHA-256 checksum How to use checksums |
9b430581ba9d40c439902c37ecbb3d55ffd566dc26acbcc906f7f72eafe42c89
|
|
BLAKE2b-256 checksum How to use checksums |
a406ee54e6b5262aad08ee8aad1e877a588ea176dd1641df32193a193f702bc6
|
| Upload date | |
|
Uploaded using Trusted Publishing? What is trusted publishing? |
Yes |
| Uploaded via |
twine/7.0.0 CPython/3.13.16
|
Provenance
Provenance describes where a file came from. On PyPI, provenance is shared via attestations, which provide a verifiable record of the build or publishing details. View details, limitations and caveats.
PyPI Publish Attestation
PyPI verified that this artifact, at this checksum, originated from the publisher listed below.
Signed by GitHub Actions, verified by PyPI on Nov 10, 2026.
Transparency logSecurity for repelly 0.3.0
Provenance
Provenance describes where a file came from. On PyPI, provenance is shared via attestations, which provide a verifiable record of the build or publishing details. View details, limitations and caveats.
Full provenance
Both files in this release have been uploaded with provenance metadata.
Attestation for repelly-0.3.0.tar.gz
PyPI Publish Attestation
PyPI verified that this artifact, at this checksum, originated from the publisher listed below.
Signed by GitHub Actions, verified by PyPI on Nov 10, 2026.
Transparency logA note on package security
PyPI is a repository for distributing packages, not a service for auditing them. While third-party security researchers and our staff do their best to detect and remove malicious packages, PyPI cannot guarantee the quality, security or suitability of any given package.
To learn more about protecting yourself from malicious actors, visit our package security documentation.














