Report Guided Annotation

Project description
Report Guided Annotation

Background
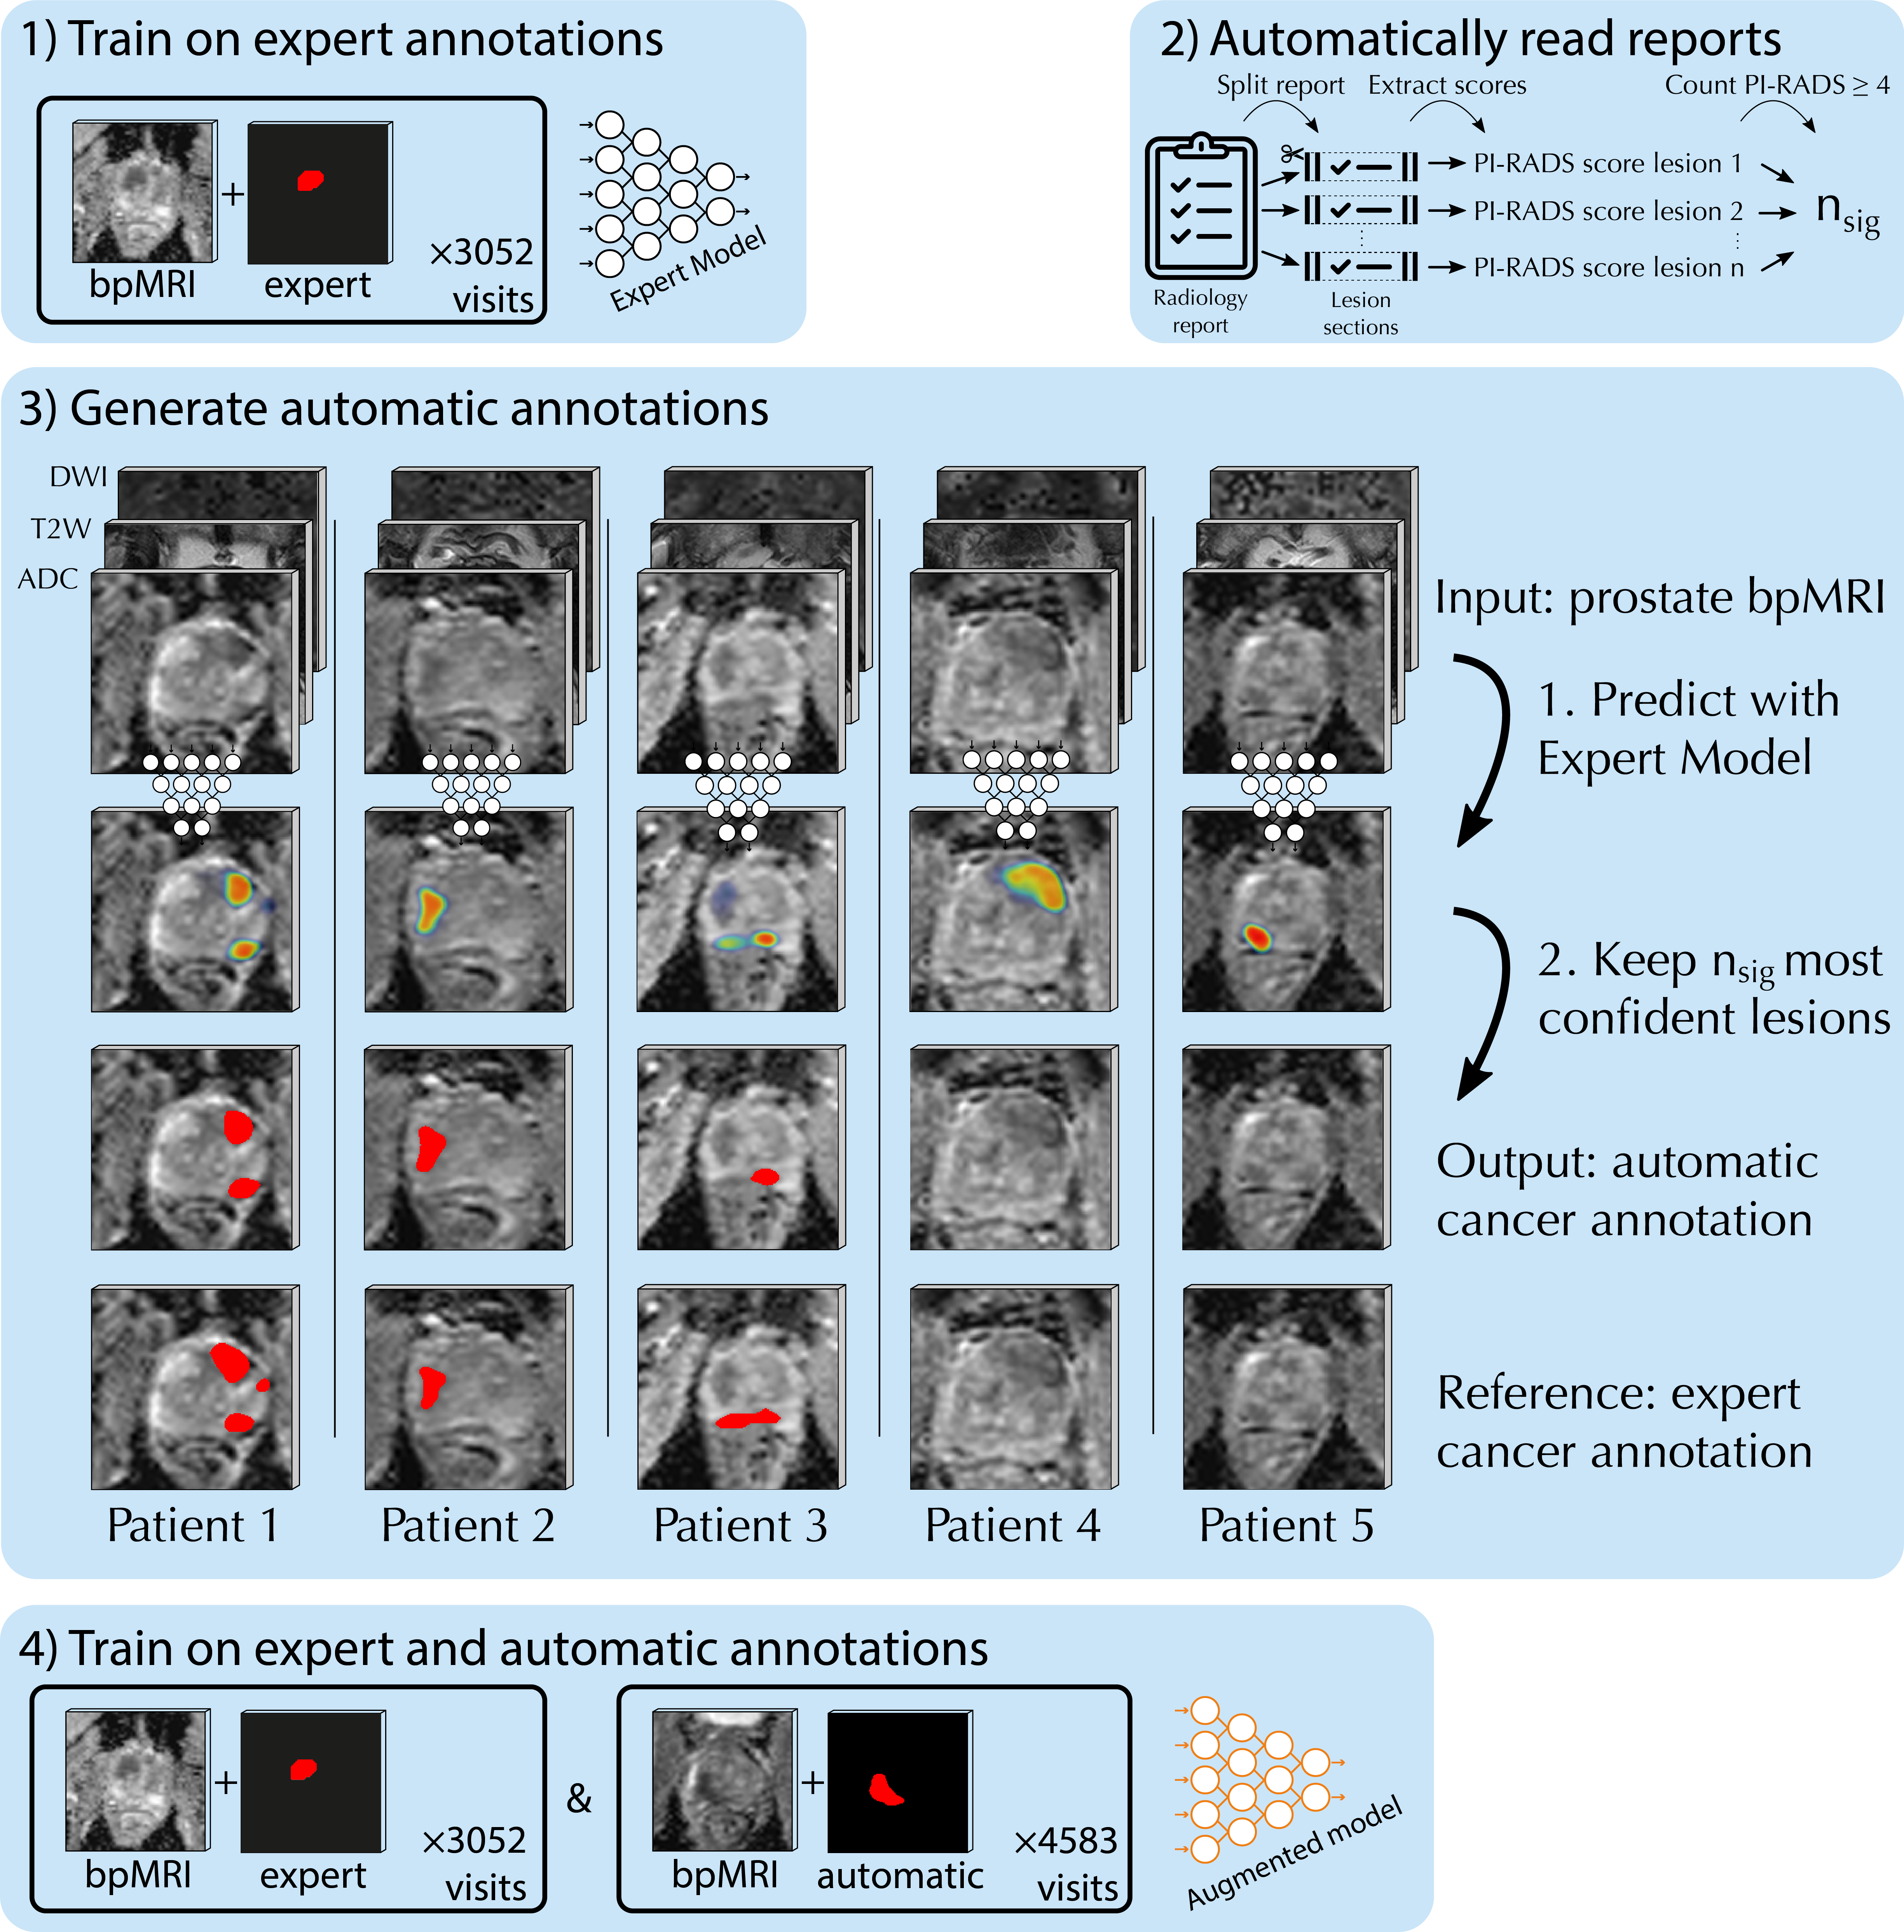
Deep learning-based diagnostic performance increases with more annotated data, but manual annotation is a bottleneck in most fields. Experts evaluate diagnostic images during clinical routine, and write their findings in reports. Automatic annotation based on clinical reports could overcome the manual labelling bottleneck. This repository implements the generation of dense annotations from model predictions, guided by the target number of structures.
📖 Citation
If you use this algorithm in your work, please cite our work:
Bosma, J. S., Saha, A., Hosseinzadeh, M., Slootweg, I., de Rooij, M., & Huisman, H. (2023). Semi-supervised Learning with Report-guided Pseudo Labels for Deep Learning-based Prostate Cancer Detection Using Biparametric MRI. Radiology: Artificial Intelligence, doi:10.1148/ryai.230031..
Installation
Report Guided Annotation is pip-installable:
pip install report_guided_annotation
Usage
Preparation
To generate annotations from softmax predictions, prepare the input folder in the following format:
path/to/softmax/folder/
├── num_lesions_to_retain_map.json
├── ProstateX-0000.nii.gz
├── ProstateX-0001.nii.gz
├── ProstateX-0002.nii.gz
...
See tests/input for an example. Allowed file extensions: .nii.gz, .nii, .mha, .mhd, .npy, and .npz from nnUNet.
The number of lesions to retain should be stored as a json dictionary, with the filenames of the predictions as keys, and the number of structures to retain as values (in this example, the PI-RADS ≥ 3 lesions were counted):
{
    "ProstateX-0000.nii.gz": 1,
    "ProstateX-0001.nii.gz": 1,
    "ProstateX-0002.nii.gz": 2,
    ...
}
Generation
Generate automatic annotations from the command line:
python3 -m report_guided_annotation --input=/path/to/input/folder/ --output=/path/to/output/folder
Or from a Python script:
from report_guided_annotation import create_automatic_annotations_for_folder

create_automatic_annotations_for_folder(
    input_dir="/path/to/input/folder/",
    output_dir="/path/to/output/folder/"
)
Mechanism
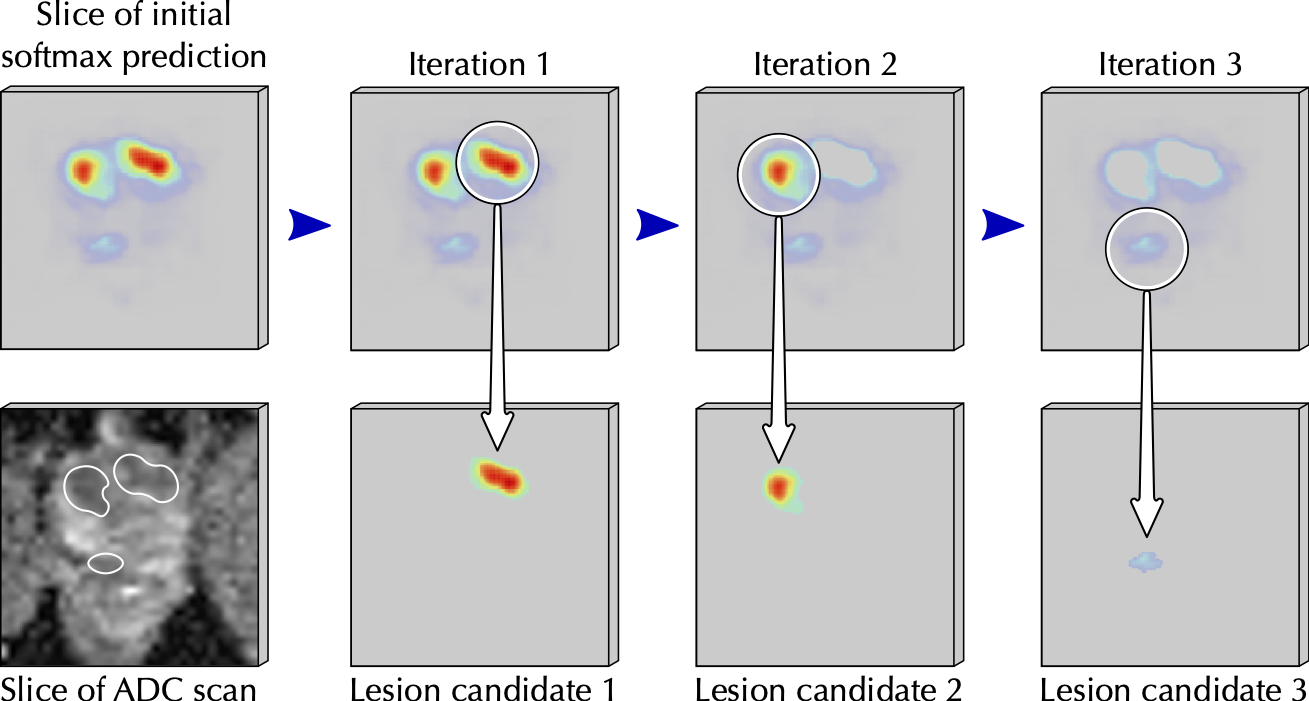
From each softmax volume we create distinct lesion candidates, as illustrated in the figure below. Specifically, we create a lesion candidate by starting at the most confident voxel, and including all connected voxels (in 3D) with at least 40% of the peak's confidence. After a lesion candidate is extracted, we remove it from the model prediction and continue to the next peak.
The automatic voxel-level annotations are generated by keeping the nsig most confident lesion candidates, with nsig the number of clinically significant report findings (in this example, the number of PI-RADS ≥ 3 lesions). If there are fewer lesion candidates than clinically significant report findings, the case is excluded (no automatic annotation will be saved, unless explicitly requested with --skip_if_insufficient_lesions=0 or skip_if_insufficient_lesions=False).
The masks for each finding is binarized and saved to the output folder.
Lesion candidate extraction from softmax prediction:
This is how report-guided automatic annotations would fit in an end-to-end pipeline:
Extract PI-RADS Scores from Radiology Report
The PI-RADS score extraction from radiology report was designed with the reports from RUMC in mind. Please verify if your institution's reports are similar, and modify the code accordingly!
Input:
Radiology report for prostate cancer detection, reported with PI-RADS v2.
Mechanism:
Most of the radiology reports in our dataset were generated from a template, and modified to provide additional information. Although multiple templates were used over the years, this resulted in structured reports for most visits. This makes a rule-based natural language processing script a reliable and transparent way to extract PI-RADS scores from our radiology reports.
Simply counting the occurrences of PI-RADS 4/5 in the report body is reasonably
effective, but has some pitfalls. For example, prior PI-RADS scores are often
referenced during follow-up visits, resulting in false positive matches. Findings
can also be grouped and described jointly, resulting in false negatives. To improve
the reliability of the PI-RADS extraction from radiology reports, we extract the
scores in two steps.
First, we try to split the radiology reports in sections for individual findings, by searching for text that matches the following structure:
[Finding] (number indicator) [number]
Where Finding matches the Dutch translations afwijking, laesie, markering
or regio. The optional number indicators are nr., mark and nummer. The
number at the end matches one or multiple numbers (e.g., 1 or 2+3).
Secondly, we extract the PI-RADS scores by searching for text that matches the following structure:
[PI-RADS] (separators) [number 1-5]
Where the optional separators include v2 category and :. The dash between PI
and `RADS' is optional. The T2W, DWI and DCE scores are extracted analogous to the
PI-RADS score, while also allowing joint extraction:
T2W/DWI/DCE score: [1-5]/[1-5]/[-+]
In this instance, the first number is matched with the T2W score, the second with
DWI and the + or - with DCE.
In case the report could not be split in sections per lesion, we apply strict pattern matching on the full report. During strict pattern matching we only extract T2W, DWI and DCE scores jointly, to ensure the scores are from the same lesion. The resulting PI-RADS scores are extracted from the full report and matched to the individual scores.
Example report sections with the text matching the PI-RADS, T2W, DWI and DCE scores coloured in are shown in J. S. Bosma, et. al. "Report Guided Automatic Lesion Annotation for Deep Learning Prostate Cancer Detection in bpMRI", to be submitted, Figure 2.
Output:
For each report, the PI-RADS scores are returned in the following format:
[
    (1, {'T2W': '3', 'DWI': '5', 'DCE': '+', 'tot': 5}),
    (2, {'T2W': '2', 'DWI': '2', 'DCE': '+', 'tot': 2})
]
Usage
The scores can be extracted using a Python script:
from report_guided_annotation import extract_pirads_scores

# read radiology report
with open("tests/reports/sample_1.txt")
    report = fp.read()

# extract PI-RADS scores from radiology report
scores = extract_pirads_scores(
    report=report
)
To combine the report reading with the report guided annotation procedure, parse the reports and save the result in the format described above:
import os
import json
from report_guided_annotation import extract_pirads_scores

path_to_reports = "tests/reports"
path_to_softmax = "tests/parse_reports_output"

num_lesions_to_retain_map = {}

for fn in os.listdir(path_to_reports):
    if not '.txt' in fn:
        print(f"Skipped {fn}, not a report?")

    # read radiology report
    with open(os.path.join(path_to_reports, fn)) as fp:
        report = fp.read()

    # extract PI-RADS scores from radiology report
    scores = extract_pirads_scores(
        report=report
    )

    # count number of PI-RADS >= 4 lesions
    pirads_scores = [int(lesion_scores['tot'])
                     for (lesion_id, lesion_scores) in scores
                     if lesion_scores['tot'] is not None]
    num_pirads_45 = sum([score >= 4 for score in pirads_scores])

    # store number of clinically significant report findings
    softmax_fn = fn.replace(".txt", ".nii.gz")
    num_lesions_to_retain_map[softmax_fn] = num_pirads_45

# save number of lesion candidates to retain
with open(os.path.join(path_to_softmax, "num_lesions_to_retain_map.json"), "w") as fp:
    json.dump(num_lesions_to_retain_map, fp, indent=4)


Download files
Download the file for your platform. If you're not sure which to choose, learn more about installing packages.
Source Distribution
Built Distribution
Filter files by name, interpreter, ABI, and platform.
If you're not sure about the file name format, learn more about wheel file names.
Copy a direct link to the current filters
File details
Details for the file report_guided_annotation-0.3.4.tar.gz.
File metadata
- Download URL: report_guided_annotation-0.3.4.tar.gz
- Upload date:
- Size: 22.4 kB
- Tags: Source
- Uploaded using Trusted Publishing? No
- Uploaded via: twine/6.0.1 CPython/3.10.12
File hashes
| Algorithm | Hash digest | |
|---|---|---|
| SHA256 |
bb48b6dd865b2c6c64f1fca7d675d7f57e9bff01f90362a3b28087563e5a5578
|
|
| MD5 |
76521e2c6e01f53b45f5f61cdf5723d1
|
|
| BLAKE2b-256 |
2e9e4368cdc32c124a4777dbc3aa91e1abb4379fefe4a60744e53b5bf41be0f7
|
File details
Details for the file report_guided_annotation-0.3.4-py3-none-any.whl.
File metadata
- Download URL: report_guided_annotation-0.3.4-py3-none-any.whl
- Upload date:
- Size: 20.1 kB
- Tags: Python 3
- Uploaded using Trusted Publishing? No
- Uploaded via: twine/6.0.1 CPython/3.10.12
File hashes
| Algorithm | Hash digest | |
|---|---|---|
| SHA256 |
21d569c1fcbdc72355526b178bf868ed71b6ee1adc993728558d21e7ab3c2c63
|
|
| MD5 |
33de30327ad258d5ed3b5788d03e9045
|
|
| BLAKE2b-256 |
d081b9a4b23f2999c7735c0f647bd05ec24441b67facfb879a295b1c26d17284
|


