
resmed-sd-monitor
Turn a ResMed CPAP/APAP SD card into a therapy-monitoring report.



Quick start · What it does · vs OSCAR · Commands · Reading the output · Disclaimer
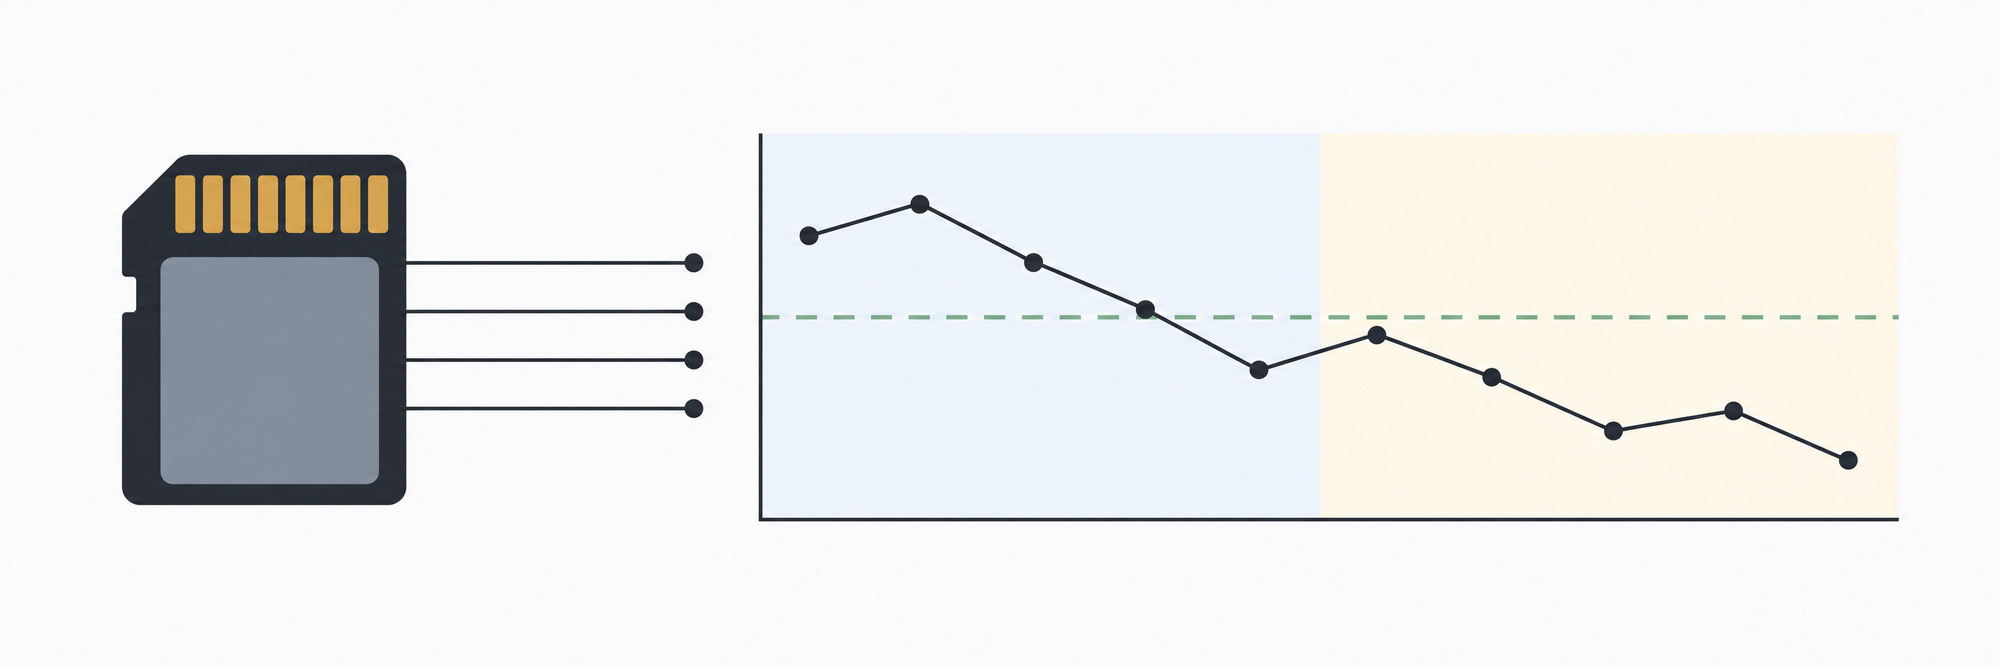
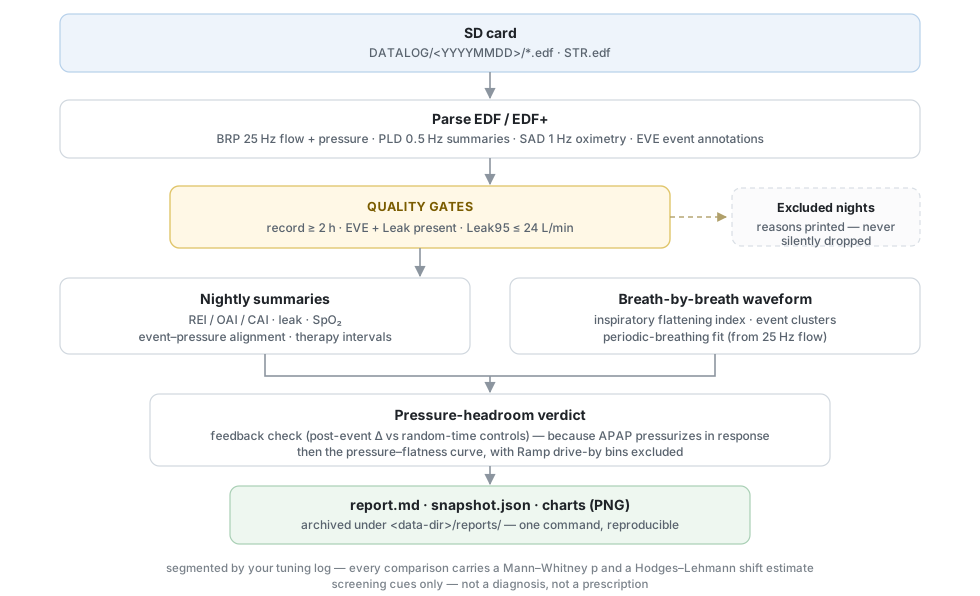
resmed-sd-monitor reads the EDF files a ResMed AirSense 10, AirSense 11 or AirCurve
already writes to its SD card, and prints a therapy-monitoring report you can take to a
sleep clinician: efficacy trends split by your own prescription-change log, per-breath
flow analysis, and a worked answer to "would more pressure help?"
Everything runs locally and offline. Nothing is uploaded anywhere.
Not a medical device. It turns machine-recorded estimates into screening cues and review prompts. It cannot diagnose sleep apnea, decide your pressure settings, or replace a sleep physician. See the full disclaimer.
How it works
What it does
Efficacy, segmented by your own prescription history
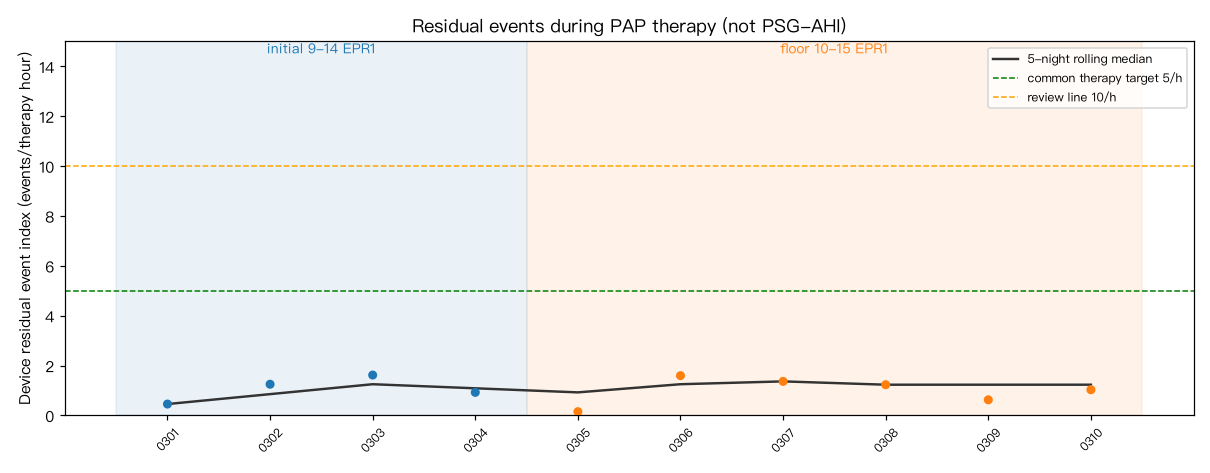
Keep a small tuning_log.json of every settings change. Each report splits the nights
into segments and compares them with Mann–Whitney + Hodges–Lehmann statistics. When
p ≥ 0.05 it prints "no clear difference detected; equivalence not proven" rather
than "no difference".
Pressure headroom
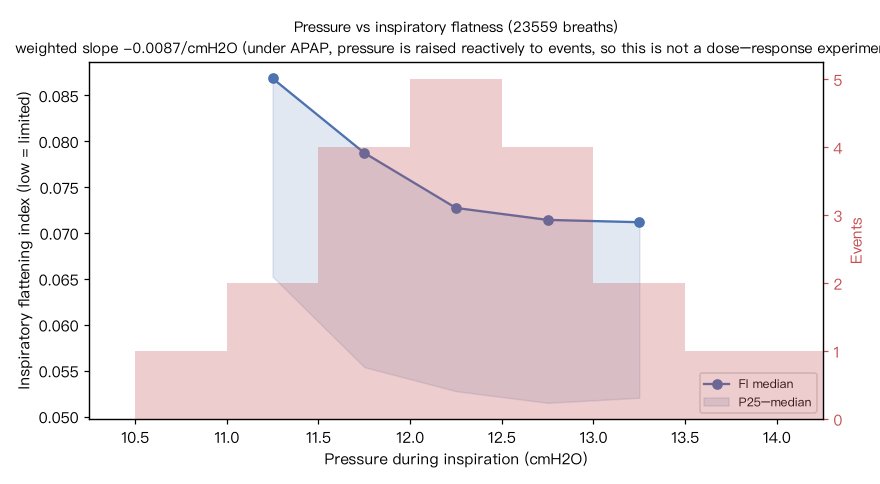
The hard question in APAP titration is whether there is room for more pressure. Two confounders make naive answers wrong, and both are handled explicitly:
- APAP raises pressure in response to events. So "many events happened at high pressure" is the echo of a feedback loop, not a sign that pressure fails. The tool runs a feedback check (post-event pressure change vs random-time controls) before any pressure metric, and prints the result.
- Ramp drive-by bins. The climb from start pressure to therapy pressure leaves hundreds of low-pressure breaths. Comparing those against fully-loaded high bins measures "ramp vs therapy" instead of a dose effect, so bins under 3 % exposure are dropped.
What is left is the clean signal: background flow limitation (inspiratory flattening) across pressure bins.
Breath-by-breath waveform layer
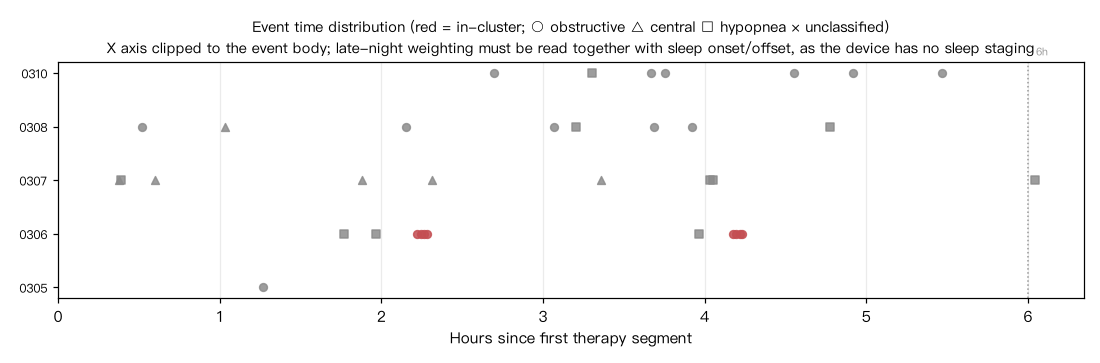
Straight from the 25 Hz flow channel: inspiratory flattening index per breath, event clustering (the positional/REM cue), periodic-breathing detection with a calibrated sine-fit, and a timeline view of when events happen.
Quality gates
Nights under 2 h, missing channels or Leak95 > 24 L/min are excluded, with the reasons printed. SpO2 coverage below 70 % yields "undetermined" rather than a fabricated T90. Every report section carries the caveats a clinician needs: the REI denominator is therapy time, there are no EEG/position/effort channels, and device events are algorithmic estimates.
Sample report excerpt (click to expand)
## 4b. Flow waveform layer (per-breath, last 5 nights)
- Feedback check: within 120 s after 36 events, pressure changed by median
  +0.67 cmH2O (56% rose above 0.5, 0% fell below -0.5); across 150 random-time
  controls, median +0.03, 3% rose. The device does pressurize reactively to
  events, so any "high pressure <-> many events" co-occurrence is that
  feedback echoing back. It is not evidence that pressure is ineffective.
- Periodic-breathing fit: 1/5 nights reach the threshold (corr²>=0.1);
  dominant period 46 s. Periodic ventilatory instability needs manual waveform
  review. The device has no EEG/effort channels, so Cheyne-Stokes or TECSA
  cannot be declared from this.
- Pressure–flatness curve: therapy pressure range 11.0–13.5 cmH2O (5 bins,
  Ramp drive-by low bins excluded): FI median at 11.0 bin 0.087 → at 13.0 bin
  0.071; weighted slope -0.0087/cmH2O.
Full sample: examples/demo/sample_report/
Quick start
pip install "resmed-sd-monitor[charts]"
Copy the DATALOG directory and STR.edf off the SD card (an ezShare WiFi SD adapter
works too), then run against the copy:
resmed-sd-monitor --data-dir /path/to/sdcard-copy --report
No card handy? The repo ships a generator for a deterministic synthetic 10-night dataset:
git clone https://github.com/CaufieldZ/resmed-sd-monitor
python resmed-sd-monitor/examples/generate_demo_data.py /tmp/demo
resmed-sd-monitor --data-dir /tmp/demo --report
How it compares
| Tool | What it is | Where this one differs |
|---|---|---|
| OSCAR | The standard open-source CPAP analysis viewer, derived from SleepyHead. Interactive charts, zoom down to a single breath. | OSCAR shows you the data; this writes the report. Segment statistics, printed quality gates and a pressure-headroom verdict, no GUI. The two pair well: browse a night in OSCAR, run this for the write-up. |
| SleepHQ, CPAP Insights | Hosted web services. Upload your card, get dashboards and sharing. | Local and offline. No account, no upload, no subscription. |
| SleepyHead | OSCAR's predecessor, unmaintained since OSCAR forked from it. | Not a viewer replacement either way. |
If you already use OSCAR, nothing here asks you to stop.
Commands
| Command | What you get |
|---|---|
--report |
Full monitoring report: quality gates, segmented trends + statistics, clinical review cues, waveform layer, charts (md + json snapshot + png archived to <data-dir>/reports/) |
--wave [N] |
Waveform deep-dive over the last N nights: flattening index, clusters, periodic breathing, pressure–flatness curve, feedback check |
--pressure |
Descriptive event-pressure association (the older, coarser view) |
<YYYYMMDD> |
One night's detail: event list with the pressure at each event's onset |
--settings |
Current prescription parsed from STR.edf |
| (none) | Summary table of all nights |
--csv |
Same table as CSV (21 columns) for spreadsheets |
resmed-sd-monitor-maskoff |
Mask-off timing audit: was early mask removal event-driven or not |
Options: --data-dir (or $RSDM_DATA_DIR / legacy $CPAP_DATA_DIR), --lang en|zh|ja.
Reading the output
Start with docs/interpretation-guide.md. The short version:
| Question | Where to look | The trap |
|---|---|---|
| Is therapy working? | 5-night rolling median, segment statistics | Single nights swing 1–10 events/h, so never read one night |
| Would more pressure help? | Pressure–flatness curve; ceiling dwell time | "Events at high pressure" is APAP's own feedback echoing back |
| Positional / REM-related? | Event clustering; time-of-night distribution | The device records no position and no sleep stage, so these are cues only |
| Central events emerging? | CAI trend after pressure/EPR changes | Rising CAI on more pressure is a TECSA flag, not a tuning detail |
| Mask coming off early? | resmed-sd-monitor-maskoff |
One short session means tolerance; fragmented means arousal-driven |
Data format reference and quirks (STR.edf hand-parsing, EDF+ annotations, multi-segment nights): docs/data-format.md. The tuning log schema: docs/tuning-log.md.
Languages
English (base), 简体中文 and 日本語 ship with the repo. Output, reports and chart labels
all switch via --lang or locale detection. The Japanese table is machine-assisted and
awaits native review. Adding a locale takes one small file: see
docs/translating.md.
Installation
Python ≥ 3.10. Core dependencies: numpy, scipy, edfio. Charts (matplotlib) are
optional; without them reports still generate, minus images.
pip install resmed-sd-monitor            # core
pip install resmed-sd-monitor[charts]    # + matplotlib
From a clone, for development:
git clone https://github.com/CaufieldZ/resmed-sd-monitor
cd resmed-sd-monitor
pip install -e .[dev]                    # + pytest, for the test suite (106 tests)
Project layout
src/resmed_sd_monitor/
  monitor.py      the analysis engine + CLI (report / wave / pressure / detail / settings)
  maskoff.py      mask-off timing audit
  i18n/           en / zh / ja string tables (+ parity tests)
examples/
  generate_demo_data.py   deterministic synthetic dataset generator
  demo/sample_report/     committed sample output (regenerate with CI check)
docs/             interpretation guide · data format · tuning log · translating
Contributing
Bug reports and PRs welcome, especially: additional ResMed device generations tested, locale tables, and stricter parsers for edge-case EDF quirks. Medical-safety wording changes are taken seriously; the non-diagnostic boundaries in the output are deliberate and won't be loosened.
pytest -q && ruff check src tests examples
Disclaimer
This software is provided for informational and educational purposes only. It is not a medical device and has not been reviewed by any regulatory authority. Nothing it outputs is a diagnosis, a treatment recommendation, or a prescription. Device-derived metrics (event indices, pressures, oximetry) are algorithmic estimates with known blind spots (leak, wakefulness, absent sleep staging). Always involve a qualified sleep physician in therapy decisions. In an emergency, seek immediate medical care.
ResMed, AirSense, AirCurve and AutoSet are trademarks of ResMed Ltd. This is an independent, unaffiliated hobby project that only reads data those machines already write to SD cards.
License
1 maintainer

Metadata
1 maintainer
Release files for resmed-sd-monitor 0.1.0
For a detailed explanation of source distributions (sdists) and built distributions (wheels), please see the package formats documentation.
Source distribution (sdist)
| File | Size | Uploaded | |
|---|---|---|---|
| resmed_sd_monitor-0.1.0.tar.gz | 90.2 kB | Details |
Built distribution (wheel)
| File | Interpreter | ABI | Platform | Reset |
|---|---|---|---|---|
| resmed_sd_monitor-0.1.0-py3-none-any.whl | Python 3 | none | any | Details |
Total release size: 169.7 kB
Release files / resmed_sd_monitor-0.1.0.tar.gz
| Download URL | resmed_sd_monitor-0.1.0.tar.gz |
|---|---|
| Size | 90.2 kB |
| Tags | Source |
|
SHA-256 checksum How to use checksums |
347411d8f8eb1e5f9b7b15d4a325bba8d4887e400ce935c77b7593940ad8ebfd
|
|
BLAKE2b-256 checksum How to use checksums |
e3169764315332ebb5efb9c709f00e16687b3f479a29c000cb119ddbb9525960
|
| Upload date | |
|
Uploaded using Trusted Publishing? What is trusted publishing? |
Yes |
| Uploaded via |
twine/7.0.0 CPython/3.13.14
|
Provenance
Provenance describes where a file came from. On PyPI, provenance is shared via attestations, which provide a verifiable record of the build or publishing details. View details, limitations and caveats.


PyPI Publish Attestation
PyPI verified that this artifact, at this checksum, originated from the publisher listed below.
Signed by GitHub Actions, verified by PyPI on Sep 18, 2026.
Transparency logRelease files / resmed_sd_monitor-0.1.0-py3-none-any.whl
| Download URL | resmed_sd_monitor-0.1.0-py3-none-any.whl |
|---|---|
| Size | 79.4 kB |
| Tags | Python 3 |
|
SHA-256 checksum How to use checksums |
964e209e46ae4b14a13129d90a90d9ae5b47fa2cf2cdce2f3dcc5b372f87880d
|
|
BLAKE2b-256 checksum How to use checksums |
8d1e50d36b30edfe0740de84aaff2d2e2c110154355468f1a6bf0fd067d91c1a
|
| Upload date | |
|
Uploaded using Trusted Publishing? What is trusted publishing? |
Yes |
| Uploaded via |
twine/7.0.0 CPython/3.13.14
|
Provenance
Provenance describes where a file came from. On PyPI, provenance is shared via attestations, which provide a verifiable record of the build or publishing details. View details, limitations and caveats.
PyPI Publish Attestation
PyPI verified that this artifact, at this checksum, originated from the publisher listed below.
Signed by GitHub Actions, verified by PyPI on Sep 18, 2026.
Transparency log












