High-Performance ML Training, Scoring & Evaluation (Polars + GPU-Ready)

Project description


Installation
# Most up-to-date
pip install git+https://github.com/AdrianAntico/RetroFit.git#egg=retrofit

# From pypi
pip install retrofit==0.3.0
📦 RetroFit
High-Performance ML Training, Scoring & Evaluation (Polars + GPU-Ready)
Table of Contents
RetroFit is a fast, production-oriented machine learning framework designed for training, scoring, and evaluating models.
Built from the ground up with Polars, GPU acceleration, and a scalable evaluation engine, RetroFit provides a unified interface for:
- 🧪 Model data creation & preprocessing (Polars-first)
- 🚀 Fast training with automatic CPU/GPU switching
- 📊 Unified scoring engine with inverse-transformation support
- 📈 Full evaluation suite for regression, binary, and multiclass
- 🎯 Calibration plots & tables
- 📉 ROC, PR, and PR-ROC curves (QuickEcharts visuals)
- 🔧 Automatic label encoding for classification/multiclass
- 🔄 Target variable transformations
RetroFit is designed for data scientists who want speed, modern tooling, and high-quality diagnostics without boilerplate.
🔥 Key Features
⚙️ 1. Polars-Native Modeling Pipeline
RetroFit uses Polars internally for:
- Numeric & categorical handling
- Efficient grouping and slicing
- Scored-data postprocessing
- Evaluation data wrangling
- Data preparation for CatBoost/XGBoost/LightGBM
Everything is vectorized whenever possible.
🎯 2. Target Transformations (Regression)
RetroFit supports:
"none""log"(auto detects ≤0 and applies min-shift)"sqrt""standardize"
Transformation is applied automatically in create_model_data() and reversed in score().
User could also apply themselves before running create_model_data() and after running score().
⚡ 3. GPU-Ready Training
Enable GPU training with:
model = RetroFit(Algorithm="catboost", TargetType="regression", GPU=True)
RetroFit automatically:
- Switches tree construction method
- Adjusts booster settings
- Removes CPU-only parameters
- Ensures full CatBoost/XGBoost/LightGBM compatibility
📊 4. Unified Scoring Engine
model.score(DataName="test")
Or score external data:
model.score(NewData=df)
Outputs a Polars DataFrame with:
- Predictions (
Predict_target) - Probabilities (
p1,class_k) - Inverse-transformed regression predictions
🧮 5. Full Evaluation Suite
Regression Metrics
- R²
- MAE / MedianAE
- MAPE
- MSE / RMSE
- MSLE (auto-disabled if invalid)
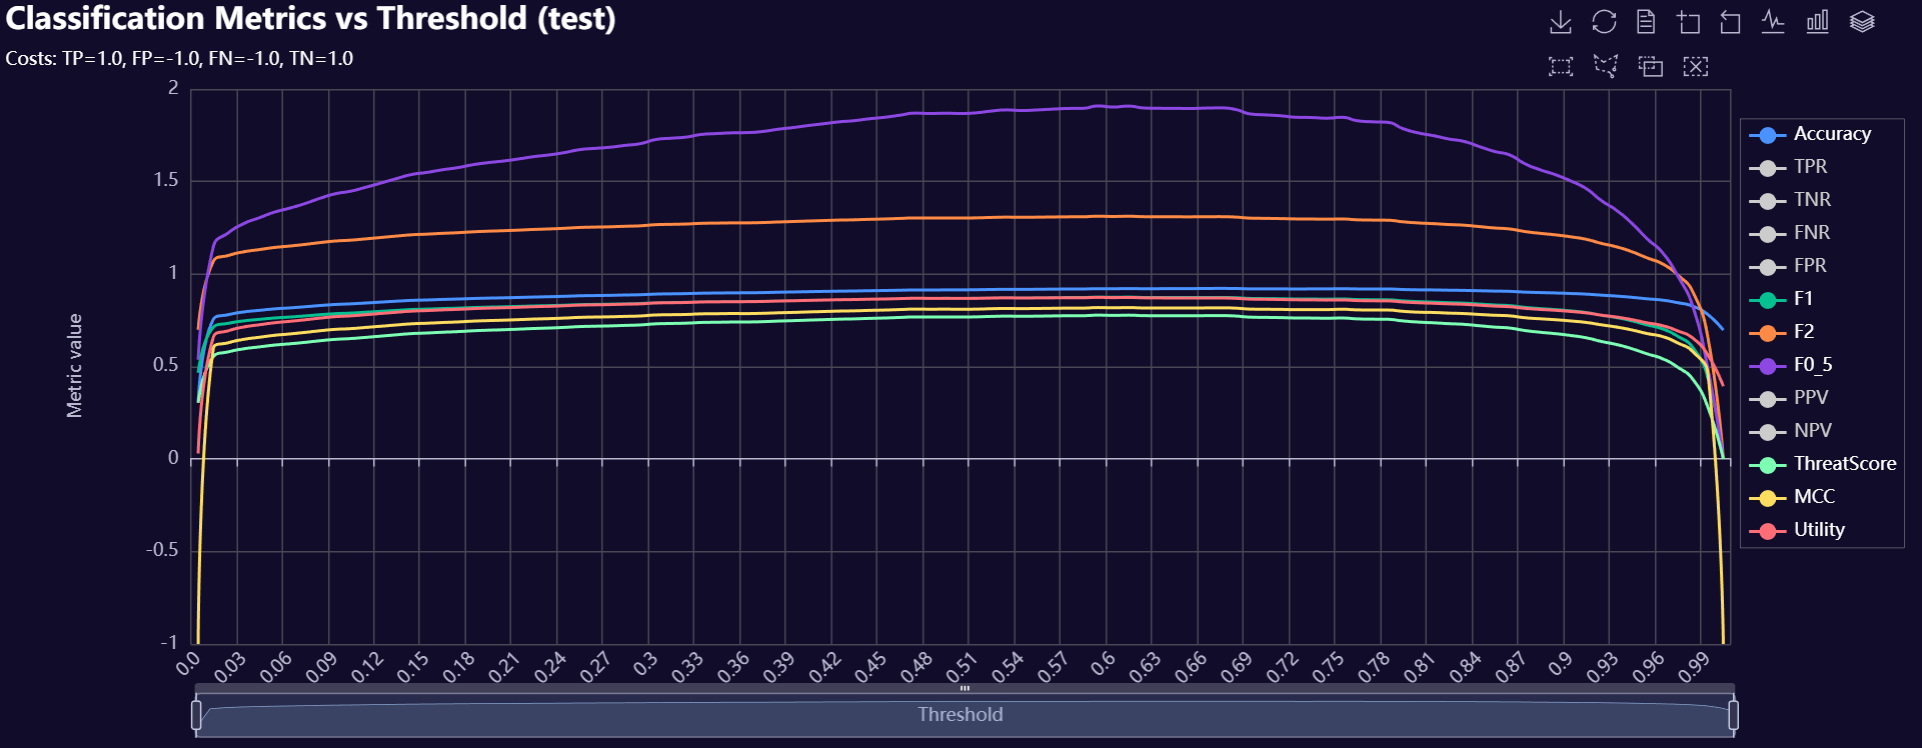
Binary Classification
- Accuracy, Recall, Precision
- TPR, FPR, TNR, FNR
- F1, F0.5, F2
- MCC
- Threat score
- Utility (custom cost matrix)
- Full 101-point threshold curve
Multiclass Classification
- Overall: Accuracy, macro/micro/weighted F1
- One-vs-all threshold evaluation
- Uses label decoder to restore original class names
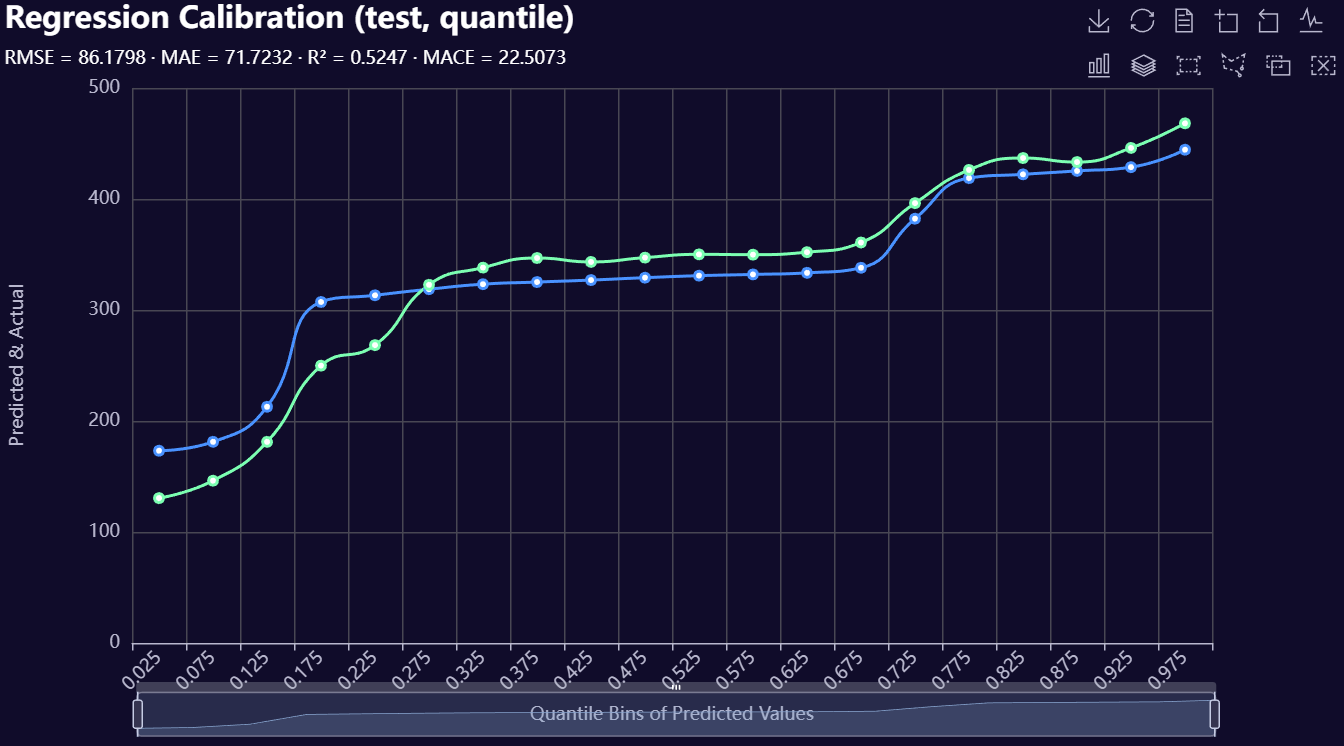
🎛️ 6. Calibration Tables & Plot
Regression + Classification calibration:
- Equal-width or quantile binning
- MACE, RMSE, MAE, R²
- Per-group calibration
- QuickEcharts visualization
- Metadata: timestamp, model name, grouping vars
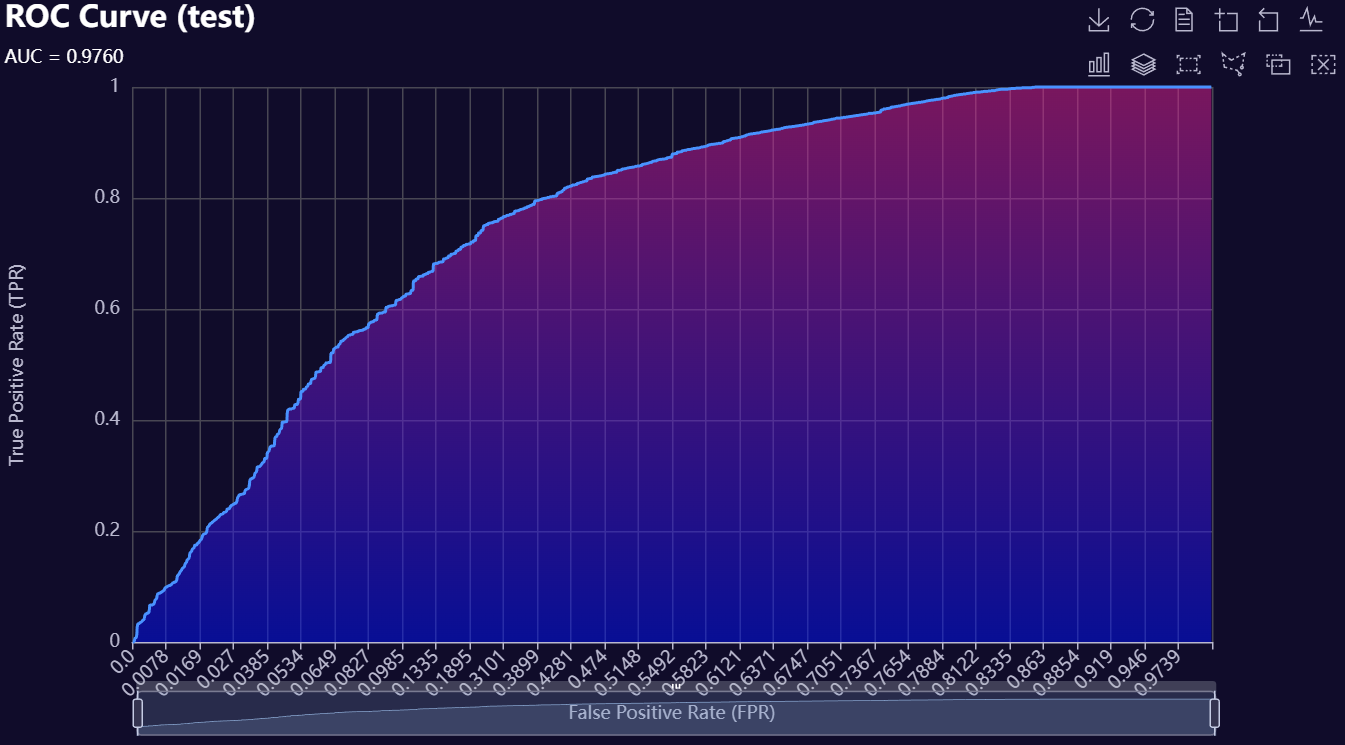
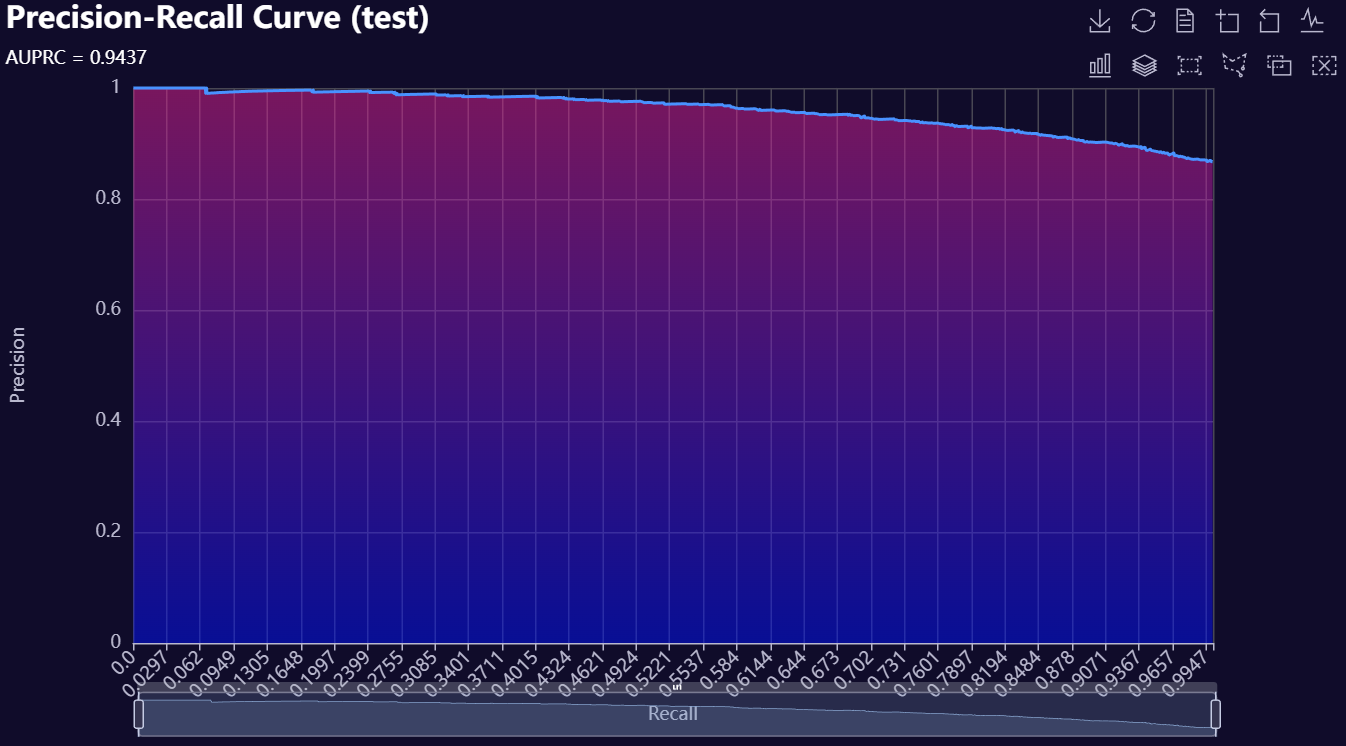
📈 7. ROC / PR / PR-ROC Curves and Regression versions
RetroFit generates:
- ROC
- Precision-Recall
- AUC and Average Precision
- Metrics vs Threshold curves (Accuracy, F1, TPR, FPR, Utility, etc.)
- Interactive QuickEcharts plots with gradient fills
🎨 8. QuickEcharts Visuals
All plots are powered by QuickEcharts:
- Line / Area plots
- Gradient fills
- Auto subtitles with metrics
- HTML export
- Themes: 'chalk', 'dark', 'essos', 'halloween', 'infographic', 'light', 'macarons', 'purple-passion', 'roma', 'romantic', 'shine', 'vintage', 'walden', 'westeros', 'white', 'wonderland'
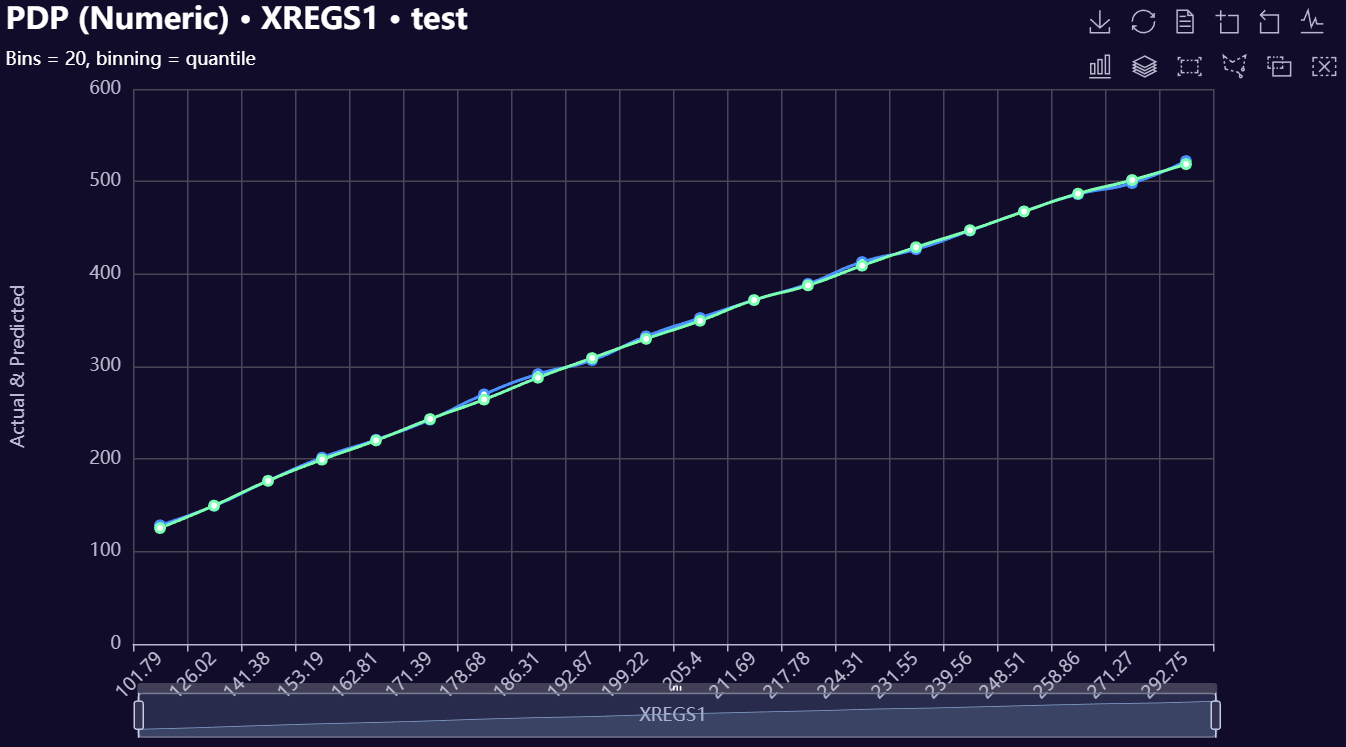
9. 🔍 Partial Dependence Plots (PDP)
RetroFit includes full PDP support for both numeric and categorical features to help explain model behavior.
✅ Numeric PDP
- Automated binning (quantile or equal-width)
- Mean actual vs mean predicted across bins
- String-safe axis handling for QuickEcharts
- Clean Line-chart visualization
- Supports internal scored data or external df input
- Returns both the PDP table and plot object
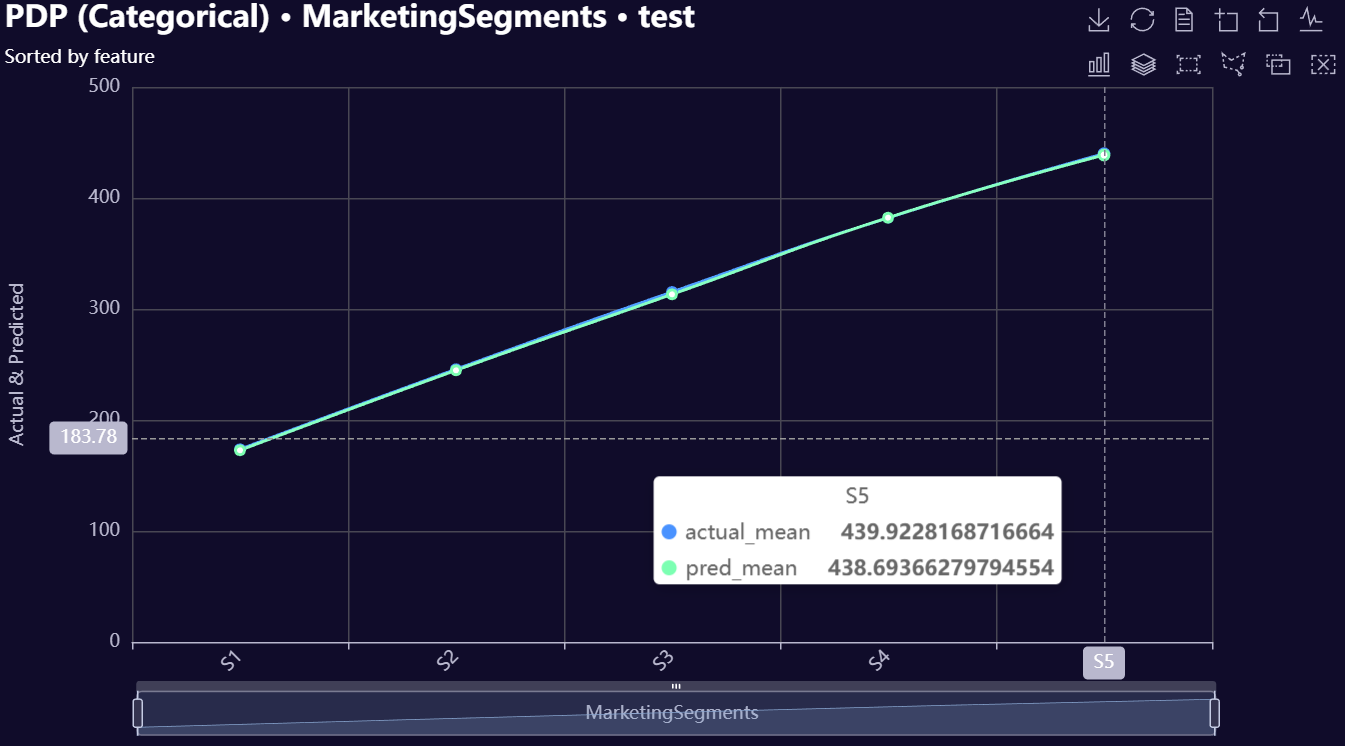
✅ Categorical PDP
- Per-category partial dependence table
- Mean actual vs mean predicted for each category
- Optional sorting (feature order, actual mean, predicted mean)
- Line-based visualization using QuickEcharts
- Works with internal or external data
- Returns both table and plot object
📑 10. Model Insights Reports
RetroFit can generate fully self-contained HTML Model Insights Reports for both regression and classification models.
Reports include:
- Data summary and feature overview
- Core metrics table (sortable & paginated)
- Calibration tables and plots
- Classification-specific diagnostics:
- ROC curve
- Precision–Recall curve
- Metrics vs Threshold plot
- Feature importance
- Interaction importance (CatBoost)
- Partial Dependence Plots
- SHAP summary and dependence plots (tree-based models)
Reports are designed to be:
- Analyst-friendly
- Shareable (single HTML file)
- Consistent with RetroFit’s evaluation engine
- Safe for production diagnostics
Code Examples
1. Supervised Learning Examples
Below are runnable examples for all supported algorithms.
Each section includes regression, binary classification, and multiclass examples.
CatBoost Examples
Regression Training
# Setup environment
import os
import polars as pl
from PolarsFE import datasets
from QuickEcharts import Charts
from retrofit import MachineLearning as ml
from retrofit import utils
# Load some data
df = utils.make_retrofit_demo_data(
n_rows=50_000,
n_segments=5,
seed=42,
)
# Get TrainData, ValidationData, and TestData
DataSets = datasets.partition_random(
data=df,
num_partitions=3,
seed=42,
percentages=[0.7, 0.2, 0.1]
)
# Initialize RetroFit
model = ml.RetroFit(TargetType="regression", Algorithm="catboost")
# Create algo-specific model data
model.create_model_data(
TrainData=DataSets[0],
ValidationData=DataSets[1],
TestData=DataSets[2],
TargetColumnName="Leads",
NumericColumnNames=['XREGS1', 'XREGS2', 'XREGS3'],
CategoricalColumnNames=['MarketingSegments', 'MarketingSegments2', 'MarketingSegments3'],
TextColumnNames=None,
WeightColumnName=None,
Threads=-1
)
# Print default parameter settings
model.print_algo_args()
# Update algo args for GPU
model.update_model_parameters(
task_type='GPU',
sampling_frequency=None,
rsm=1.0,
iterations = 200
)
# Train Model
model.train()
# Score train, validation, and test; store internally
model.score()
# Build regression report
path = model.build_model_insights_report(
output_path="regression_report.html",
theme="neon",
)
# Inspect scored data
model.ScoredData["train"]
model.ScoredData["validation"]
model.ScoredData["test"]
# Evaluate scored data
global_eval = model.evaluate(
DataName="test"
)
# Per segment
segment_eval = model.evaluate(
DataName="test",
ByVariables="MarketingSegments"
)
# Get variable importance
imp = model.compute_feature_importance()
# Get interaction importance
interact = model.compute_catboost_interaction_importance()
# Model Calibration Tables
cal = model.build_regression_calibration_table(
DataName="test",
binning="quantile"
)
# Store plot in working directory
model.plot_regression_calibration(
DataName="test",
n_bins=20,
binning="quantile",
plot_name=f"{os.getcwd()}/my_calibration_plot"
)
# Actual vs Predicted Scatterplot
model.plot_regression_scatter(
DataName="test",
SampleSize=15000,
plot_name=f"{os.getcwd()}/my_scatter_plot",
Theme="dark"
)
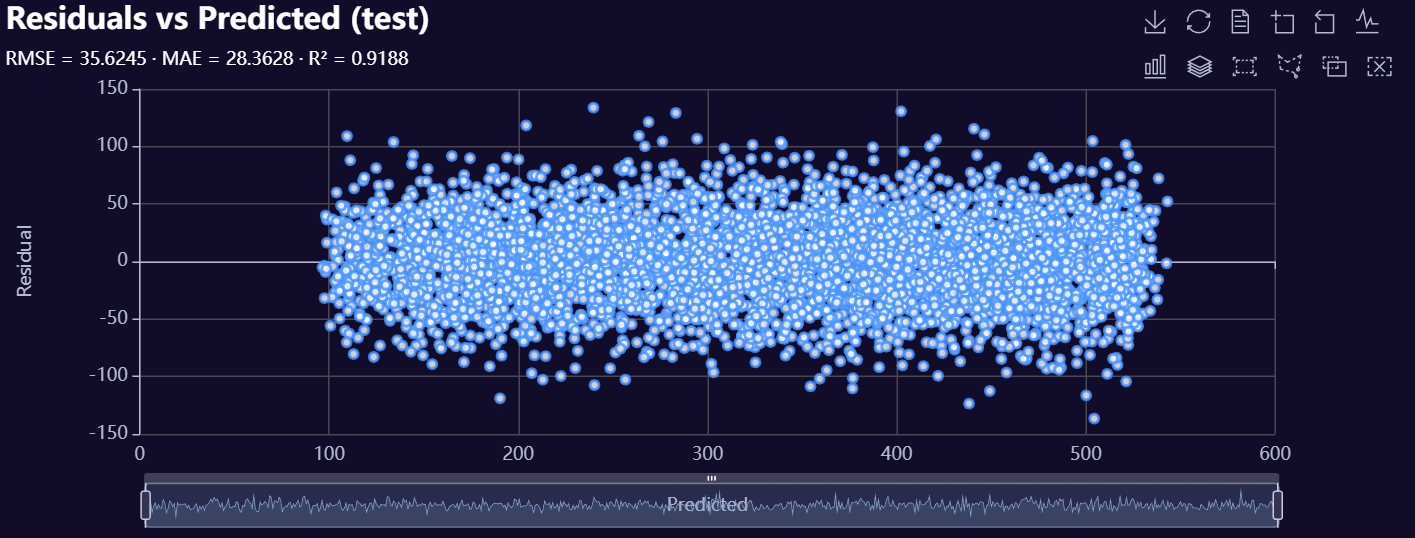
# Residuals vs Predicted Values
model.plot_regression_residuals_vs_predicted(
DataName="test",
SampleSize=15000,
plot_name=f"{os.getcwd()}/my_residuals_plot",
Theme="dark"
)
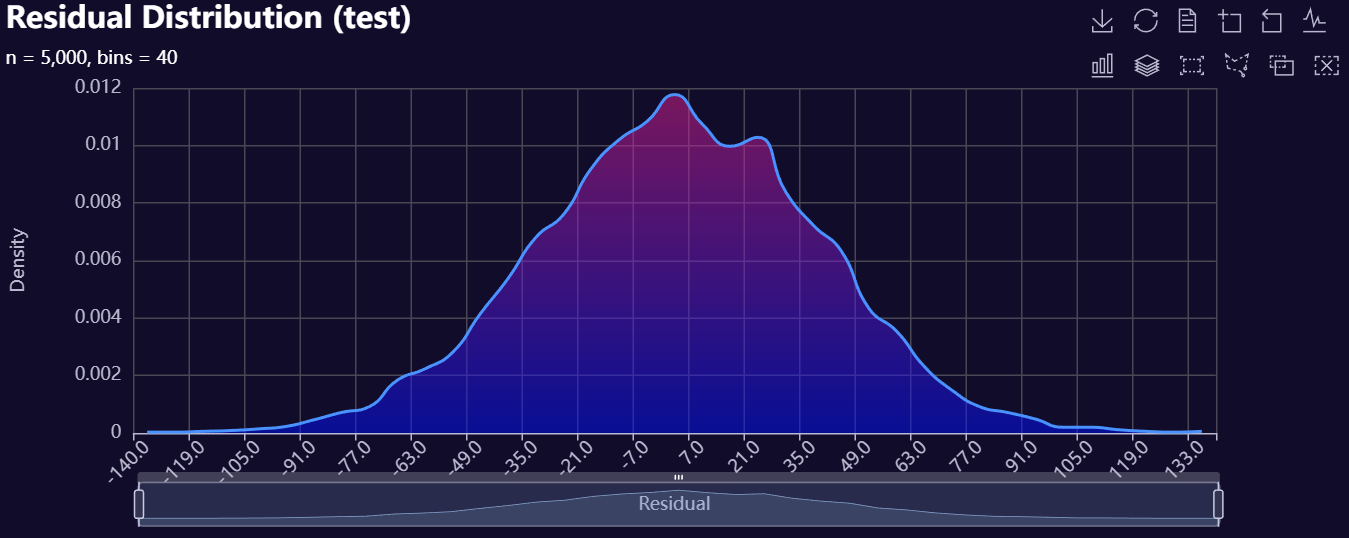
# Residual Distribution
model.plot_regression_residual_distribution(
DataName="test",
n_bins=40,
plot_name=f"{os.getcwd()}/my_density_plot",
Theme="dark",
)
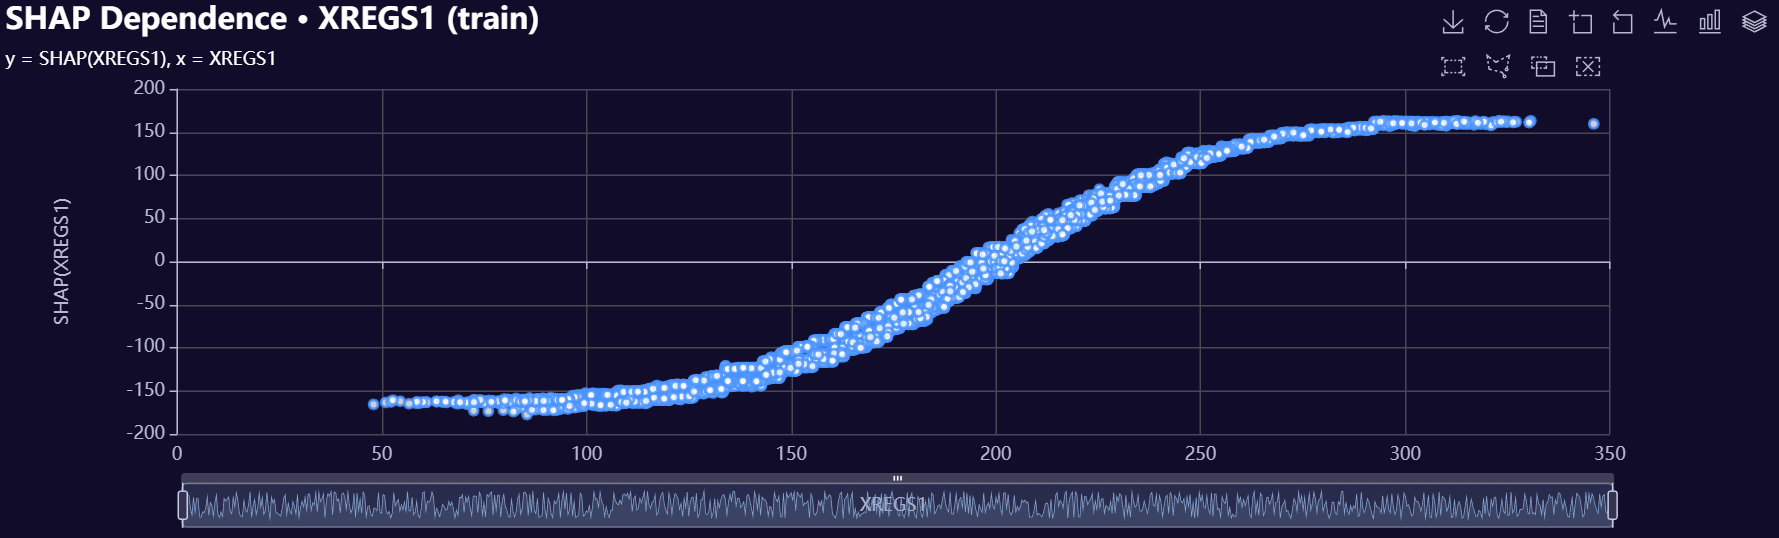
# Get shap values
shap_train = model.compute_shap_values(split="train", attach=True)
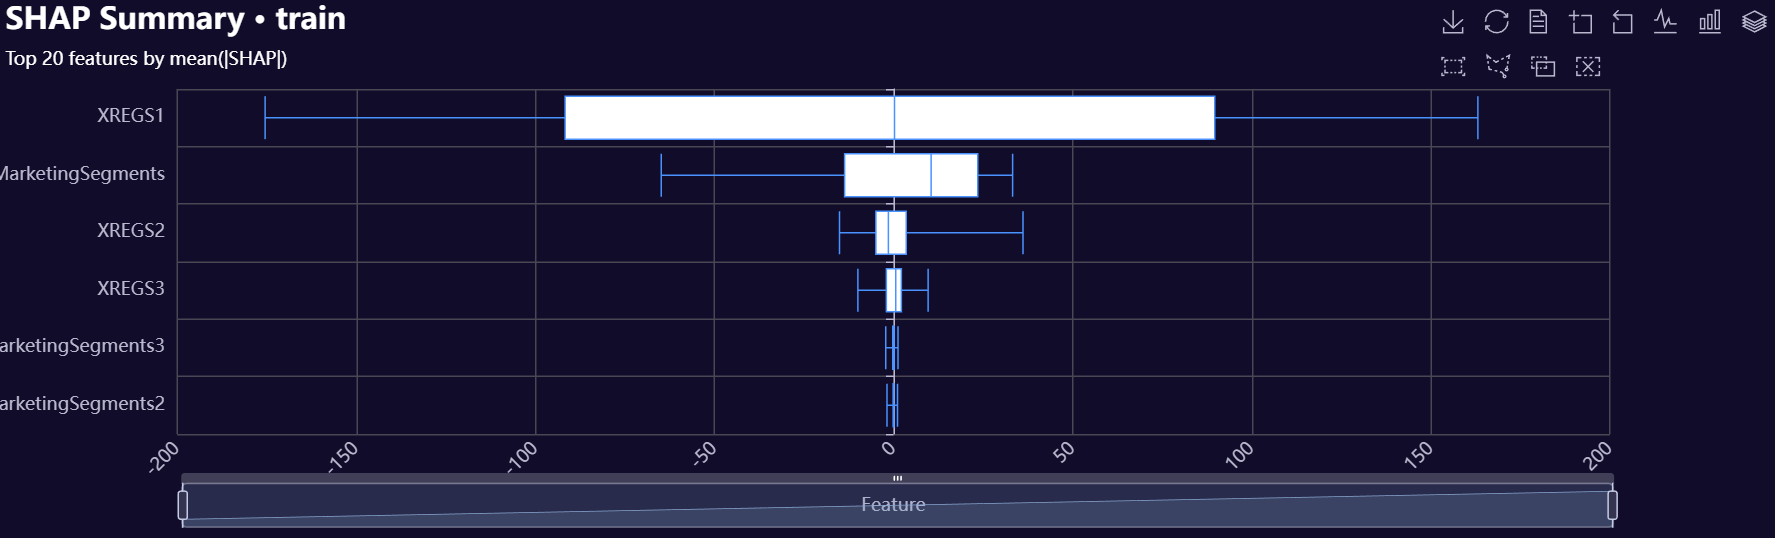
# Shap Boxplot
shap_summary = model.plot_shap_summary(
split="train",
shap_attached=shap_train,
prefix="shap_",
top_n=20,
max_samples=10_000,
plot_name=f"{os.getcwd()}/my_shap_boxplot",
Theme="dark",
)
# Create shap dependence plot
out = model.plot_shap_dependence(
feature="XREGS1",
split="train",
plot_name=f"{os.getcwd()}/my_shap_pdp",
)
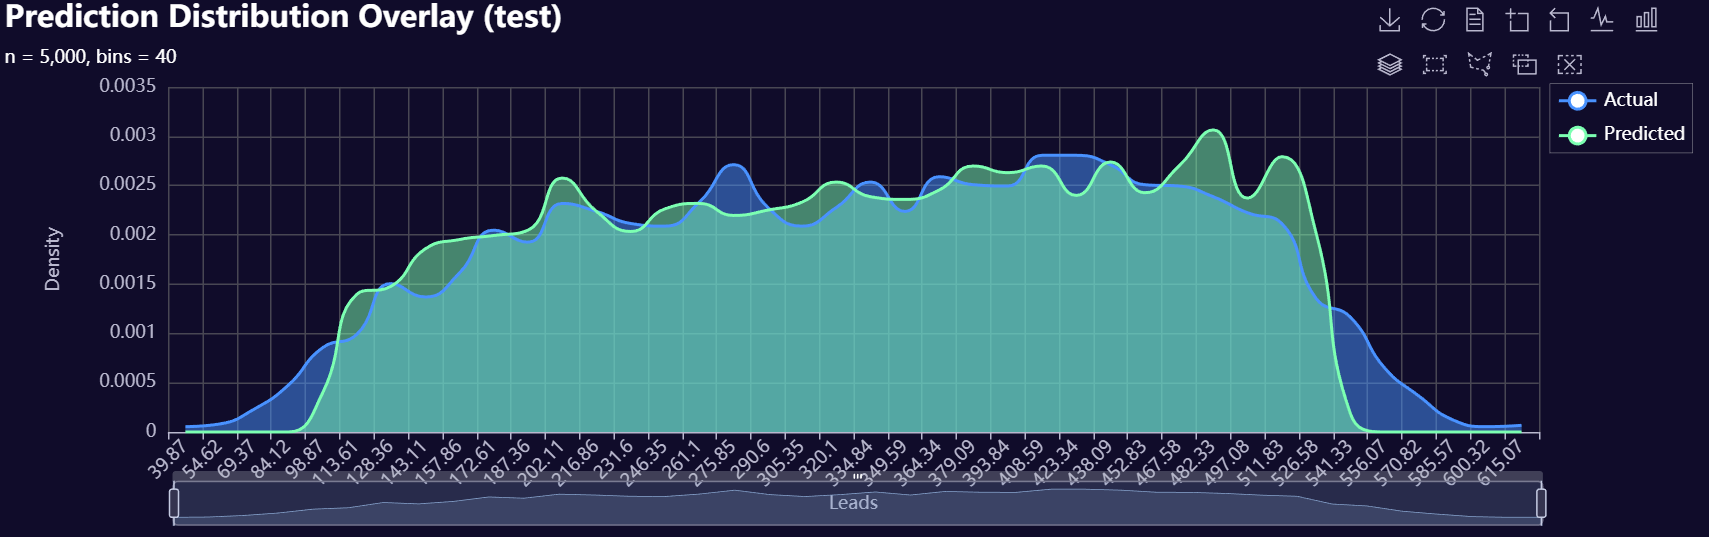
# Actual vs Predicted Distribution Overlay
resid_dist_ = model.plot_prediction_distribution(
DataName="test",
n_bins=40,
plot_name=f"{os.getcwd()}/my_overlay_plot",
)
# Numeric Partial Dependence plot
model.plot_pdp_numeric(
feature='XREGS1',
DataName="test",
plot_name=f"{os.getcwd()}/numeric_pdp",
)
# Categorical Partial Dependence plot
model.plot_pdp_categorical(
feature='MarketingSegments',
DataName="test",
plot_name=f"{os.getcwd()}/categorical_pdp",
)
Classification Training
# Setup environment
import os
import polars as pl
from PolarsFE import datasets
from QuickEcharts import Charts
from retrofit import MachineLearning as ml
from retrofit import utils


# Load some data
df = utils.make_retrofit_demo_data(
    n_rows=50_000,
    n_segments=5,
    seed=42,
)

# Get TrainData, ValidationData, and TestData
DataSets = datasets.partition_random(
    data=df,
    num_partitions=3,
    seed=42,
    percentages=[0.7, 0.2, 0.1]
)

# Initialize RetroFit
model = ml.RetroFit(TargetType="classification", Algorithm="catboost")

# Create algo-specific model data
model.create_model_data(
  TrainData=DataSets[0],
  ValidationData=DataSets[1],
  TestData=DataSets[2],
  TargetColumnName="Label_binary",
  NumericColumnNames=['XREGS1','XREGS2','XREGS3'],
  CategoricalColumnNames=['MarketingSegments','MarketingSegments2','MarketingSegments3'],
  TextColumnNames=None,
  WeightColumnName=None,
  Threads=-1
)

# Print default parameter settings
model.print_algo_args()

# Update algo args for GPU
model.update_model_parameters(
    task_type='GPU',
    sampling_frequency=None,
    rsm=1.0,
    iterations=200
)

# Train Model
model.train()

# Score train, validation, and test; store internally
model.score()

# Build classification report
path = model.build_model_insights_report(
    output_path="classification_report.html",
    theme="neon",
)

# Inspect scored data
model.ScoredData["train"]
model.ScoredData["validation"]
model.ScoredData["test"]

# Evaluate scored data
global_eval = model.evaluate(
    DataName="test"
)

# Per segment
segment_eval = model.evaluate(
    DataName="test",
    ByVariables="MarketingSegments"
)

# Get variable importance
imp = model.compute_feature_importance()

# Get interaction importance
interact = model.compute_catboost_interaction_importance()

# Evaluate scored data
model.plot_classification_threshold_metrics(
    DataName="test",
    CostDict=dict(tpcost=1.0, fpcost=-1.0, fncost=-1.0, tncost=1.0),
    plot_name=f"{os.getcwd()}/my_thresh_plot",
    Theme="dark"
)

# Store plot in working directory
model.plot_classification_calibration(
    DataName="test",
    n_bins=20,
    binning="quantile",
    plot_name=f"{os.getcwd()}/my_calibration_plot"
)

# ROC Plot
model.plot_classification_roc(
    DataName="test",
    plot_name=f"{os.getcwd()}/my_roc_plot",
)

# PR Plot
model.plot_classification_pr(
    DataName="test",
    plot_name=f"{os.getcwd()}/my_pr_plot"
)

# Get shap values
shap_train = model.compute_shap_values(split="train", attach=True)

# Shap Boxplot
shap_summary = model.plot_shap_summary(
    split="train",
    shap_attached=shap_train,
    prefix="shap_",
    top_n=20,
    max_samples=10_000,
    plot_name=f"{os.getcwd()}/my_shap_boxplot",
    Theme="dark",
)

# Create shap dependence plot
out = model.plot_shap_dependence(
    feature="XREGS1",
    split="train",
    plot_name=f"{os.getcwd()}/my_shap_pdp",
)

# Numeric Partial Dependence plot
model.plot_pdp_numeric(
    feature='XREGS1',
    DataName="test",
    plot_name=f"{os.getcwd()}/numeric_pdp",
)

# Categorical Partial Dependence plot
model.plot_pdp_categorical(
    feature='MarketingSegments',
    DataName="test",
    plot_name=f"{os.getcwd()}/categorical_pdp",
)
MultiClass Training
import os
import polars as pl
from PolarsFE import datasets
from QuickEcharts import Charts
from retrofit import MachineLearning as ml

# Load some data
# Generate demo data instead of reading packaged CSVs
df = utils.make_retrofit_demo_data(
    n_rows=50_000,
    n_segments=5,
    seed=42,
)

# Get TrainData, ValidationData, and TestData
DataSets = datasets.partition_random(
    data=df,
    num_partitions=3,
    seed=42,
    percentages=[0.7, 0.2, 0.1]
)

# Initialize RetroFit
model = ml.RetroFit(TargetType="multiclass", Algorithm="catboost")

# Create algo-specific model data
model.create_model_data(
  TrainData=DataSets[0],
  ValidationData=DataSets[1],
  TestData=DataSets[2],
  TargetColumnName="Label",
  NumericColumnNames=['XREGS1', 'XREGS2', 'XREGS3'],
  CategoricalColumnNames=['MarketingSegments', 'MarketingSegments2', 'MarketingSegments3'],
  TextColumnNames=None,
  WeightColumnName=None,
  Threads=-1
)

# Print default parameter settings
model.print_algo_args()

# Update algo args for GPU
model.update_model_parameters(
    task_type='GPU',
    bootstrap_type='Bayesian',
    rsm=1.0,
    iterations=200,
    subsample=None,
    sampling_frequency=None
)

# Train Model
model.train()

# Score train, validation, and test; store internally
model.score()

# Inspect scored data
model.ScoredData["train"]
model.ScoredData["validation"]
model.ScoredData["test"]

# Evaluate scored data
global_eval = model.evaluate(
    DataName="test"
)

# Per segment
segment_eval = model.evaluate(
    DataName="test",
    ByVariables="MarketingSegments"
)

# Get variable importance
imp = model.compute_feature_importance()

# Get interaction importance
interact = model.compute_catboost_interaction_importance()
XGBoost Examples
Regression Training
# Setup Environment
import os
import polars as pl
from PolarsFE import datasets, character
from QuickEcharts import Charts
from retrofit import MachineLearning as ml

# Generate demo data instead of reading packaged CSVs
df = utils.make_retrofit_demo_data(
    n_rows=50_000,
    n_segments=5,
    seed=42,
)

# Get TrainData, ValidationData, and TestData
DataSets = datasets.partition_random(
    data=df,
    num_partitions=3,
    seed=42,
    percentages=[0.7, 0.2, 0.1]
)

# Create target encodings for categorical variables
categorical_cols = ['MarketingSegments', 'MarketingSegments2', 'MarketingSegments3']
output = character.categorical_encoding(
    data=DataSets[0],
    ML_Type="regression",
    group_variables=categorical_cols,
    target_variable="Leads",
    method="target_encoding",
    scoring=False,
    keep_original_factors=False
)

# Collect data and encodings
DataSets[0] = output['data']
encodings = output['factor_components']

# Note parameter: scoring=True
DataSets[1] = character.categorical_encoding(
    data=DataSets[1],
    ML_Type="regression",
    group_variables=categorical_cols,
    target_variable="Leads",
    method="target_encoding",
    scoring=True,
    supply_factor_level_list=encodings,
    keep_original_factors=False
)

# Note parameter: scoring=True
DataSets[2] = character.categorical_encoding(
    data=DataSets[2],
    ML_Type="regression",
    group_variables=categorical_cols,
    target_variable="Leads",
    method="target_encoding",
    scoring=True,
    supply_factor_level_list=encodings,
    keep_original_factors=False
)

# Initialize RetroFit
model = ml.RetroFit(TargetType="regression", Algorithm="xgboost")

# Create algo-specific model data
model.create_model_data(
  TrainData=DataSets[0],
  ValidationData=DataSets[1],
  TestData=DataSets[2],
  TargetColumnName="Leads",
  NumericColumnNames=[
    'XREGS1',
    'XREGS2',
    'XREGS3',
    'MarketingSegments_TargetEncode',
    'MarketingSegments2_TargetEncode',
    'MarketingSegments3_TargetEncode'
  ],
  Threads=-1
)

# Print default parameter settings
model.print_algo_args()

# Update algo args
model.update_model_parameters(
    num_boost_round=200,
    num_parallel_tree=4,
    max_depth=4
)

# Train Model
model.train()

# Score train, validation, and test; store internally
model.score()

# Build regression report
path = model.build_model_insights_report(
    output_path="regression_report.html",
    theme="neon",
)

# Inspect scored data
model.ScoredData["train"]
model.ScoredData["validation"]
model.ScoredData["test"]

# Evaluate scored data
global_eval = model.evaluate(
    DataName="test"
)

# Per segment
segment_eval = model.evaluate(
    DataName="test",
    ByVariables="MarketingSegments_TargetEncode"
)

# Get variable importance
imp = model.compute_feature_importance()

# Model Calibration Tables
cal = model.build_regression_calibration_table(
    DataName="test",
    binning="quantile"
)

# Store plot in working directory
model.plot_regression_calibration(
    DataName="test",
    n_bins=20,
    binning="quantile",
    plot_name=f"{os.getcwd()}/my_calibration_plot"
)

# Get shap values
shap_train = model.compute_shap_values(split="train", attach=True)

# Shap Boxplot
shap_summary = model.plot_shap_summary(
    split="train",
    shap_attached=shap_train,
    prefix="shap_",
    top_n=20,
    max_samples=10_000,
    plot_name=f"{os.getcwd()}/my_shap_boxplot",
    Theme="dark",
)

# Create shap dependence plot
out = model.plot_shap_dependence(
    feature="XREGS1",
    split="train",
    plot_name=f"{os.getcwd()}/my_shap_pdp",
)

# Actual vs Predicted Scatterplot
model.plot_regression_scatter(
    DataName="test",
    SampleSize=15000,
    plot_name=f"{os.getcwd()}/my_scatter_plot",
    Theme="dark"
)

# Residuals vs Predicted Values
model.plot_regression_residuals_vs_predicted(
    DataName="test",
    SampleSize=15000,
    plot_name=f"{os.getcwd()}/my_residuals_plot",
    Theme="dark"
)

# Residual Distribution
model.plot_regression_residual_distribution(
    DataName="test",
    n_bins=40,
    plot_name=f"{os.getcwd()}/my_density_plot",
    Theme="dark",
)

# Actual vs Predicted Distribution Overlay
resid_dist_ = model.plot_prediction_distribution(
    DataName="test",
    n_bins=40,
    plot_name=f"{os.getcwd()}/my_overlay_plot",
)

# Numeric Partial Dependence plot
model.plot_pdp_numeric(
    feature='XREGS1',
    DataName="test",
    plot_name=f"{os.getcwd()}/numeric_pdp",
)

# Categorical Partial Dependence plot
model.plot_pdp_categorical(
    feature='MarketingSegments',
    DataName="test",
    plot_name=f"{os.getcwd()}/categorical_pdp",
)
Classification Training
# Setup Environment
import os
import polars as pl
from PolarsFE import datasets, character
from QuickEcharts import Charts
from retrofit import MachineLearning as ml

# Generate demo data instead of reading packaged CSVs
df = utils.make_retrofit_demo_data(
    n_rows=50_000,
    n_segments=5,
    seed=42,
)

# Turn Label into a binary target variable
df = df.with_columns(
    pl.when(pl.col("XREGS1") > 200).then(1)
      .otherwise(0)
      .alias("Label")
)

# Get TrainData, ValidationData, and TestData
DataSets = datasets.partition_random(
    data=df,
    num_partitions=3,
    seed=42,
    percentages=[0.7, 0.2, 0.1]
)

# Create target encodings for categorical variables
categorical_cols = ['MarketingSegments', 'MarketingSegments2', 'MarketingSegments3']
output = character.categorical_encoding(
    data=DataSets[0],
    ML_Type="classification",
    group_variables=categorical_cols,
    target_variable="Leads",
    method="target_encoding",
    scoring=False,
    keep_original_factors=False
)

# Collect data and encodings
DataSets[0] = output['data']
encodings = output['factor_components']

# Note parameter: scoring=True
DataSets[1] = character.categorical_encoding(
    data=DataSets[1],
    ML_Type="classification",
    group_variables=categorical_cols,
    target_variable="Leads",
    method="target_encoding",
    scoring=True,
    supply_factor_level_list=encodings,
    keep_original_factors=False
)

# Note parameter: scoring=True
DataSets[2] = character.categorical_encoding(
    data=DataSets[2],
    ML_Type="classification",
    group_variables=categorical_cols,
    target_variable="Label",
    method="target_encoding",
    scoring=True,
    supply_factor_level_list=encodings,
    keep_original_factors=False
)

# Initialize RetroFit
model = ml.RetroFit(TargetType="classification", Algorithm="xgboost")

# Create algo-specific model data
model.create_model_data(
  TrainData=DataSets[0],
  ValidationData=DataSets[1],
  TestData=DataSets[2],
  TargetColumnName="Label",
  NumericColumnNames=[
    'XREGS1',
    'XREGS2',
    'XREGS3',
    'MarketingSegments_TargetEncode',
    'MarketingSegments2_TargetEncode',
    'MarketingSegments3_TargetEncode'
  ],
  Threads=-1
)

# Print default parameter settings
model.print_algo_args()

# Update algo args
model.update_model_parameters(
    num_boost_round=200,
    num_parallel_tree=4,
    max_depth=4
)

# Train Model
model.train()

# Score train, validation, and test; store internally
model.score()

# Build classification report
path = model.build_model_insights_report(
    output_path="classification_report.html",
    theme="neon",
)

# Inspect scored data
model.ScoredData["train"]
model.ScoredData["validation"]
model.ScoredData["test"]

# Evaluate scored data
global_eval = model.evaluate(
    DataName="test"
)

# Per segment
segment_eval = model.evaluate(
    DataName="test",
    ByVariables="MarketingSegments_TargetEncode"
)

# Get variable importance
imp = model.compute_feature_importance()

# Evaluate scored data
model.plot_classification_threshold_metrics(
    DataName="test",
    CostDict=dict(tpcost=1.0, fpcost=-1.0, fncost=-1.0, tncost=1.0),
    plot_name=f"{os.getcwd()}/my_thresh_plot",
    Theme="dark"
)

# Store plot in working directory
model.plot_classification_calibration(
    DataName="test",
    n_bins=20,
    binning="quantile",
    plot_name=f"{os.getcwd()}/my_calibration_plot"
)

# ROC Plot
model.plot_classification_roc(
    DataName="test",
    plot_name=f"{os.getcwd()}/my_roc_plot",
)

# PR Plot
model.plot_classification_pr(
    DataName="test",
    plot_name=f"{os.getcwd()}/my_pr_plot"
)

# Get shap values
shap_train = model.compute_shap_values(split="train", attach=True)

# Shap Boxplot
shap_summary = model.plot_shap_summary(
    split="train",
    shap_attached=shap_train,
    prefix="shap_",
    top_n=20,
    max_samples=10_000,
    plot_name=f"{os.getcwd()}/my_shap_boxplot",
    Theme="dark",
)

# Create shap dependence plot
out = model.plot_shap_dependence(
    feature="XREGS1",
    split="train",
    plot_name=f"{os.getcwd()}/my_shap_pdp",
)

# Numeric Partial Dependence plot
model.plot_pdp_numeric(
    feature='XREGS1',
    DataName="test",
    plot_name=f"{os.getcwd()}/numeric_pdp",
)

# Categorical Partial Dependence plot
model.plot_pdp_categorical(
    feature='MarketingSegments',
    DataName="test",
    plot_name=f"{os.getcwd()}/categorical_pdp",
)
MultiClass Training
# Setup Environment
import os
import polars as pl
from PolarsFE import datasets, character
from QuickEcharts import Charts
from retrofit import MachineLearning as ml

# Generate demo data instead of reading packaged CSVs
df = utils.make_retrofit_demo_data(
    n_rows=50_000,
    n_segments=5,
    seed=42,
)

# Get TrainData, ValidationData, and TestData
DataSets = datasets.partition_random(
    data=df,
    num_partitions=3,
    seed=42,
    percentages=[0.7, 0.2, 0.1]
)

# Create target encodings for categorical variables
categorical_cols = ['MarketingSegments', 'MarketingSegments2', 'MarketingSegments3']
output = character.categorical_encoding(
    data=DataSets[0],
    ML_Type="multiclass",
    group_variables=categorical_cols,
    target_variable="Leads",
    method="target_encoding",
    scoring=False,
    keep_original_factors=False
)

# Collect data and encodings
DataSets[0] = output['data']
encodings = output['factor_components']

# Note parameter: scoring=True
DataSets[1] = character.categorical_encoding(
    data=DataSets[1],
    ML_Type="multiclass",
    group_variables=categorical_cols,
    target_variable="Leads",
    method="target_encoding",
    scoring=True,
    supply_factor_level_list=encodings,
    keep_original_factors=False
)

# Note parameter: scoring=True
DataSets[2] = character.categorical_encoding(
    data=DataSets[2],
    ML_Type="multiclass",
    group_variables=categorical_cols,
    target_variable="Label",
    method="target_encoding",
    scoring=True,
    supply_factor_level_list=encodings,
    keep_original_factors=False
)

# Initialize RetroFit
model = ml.RetroFit(TargetType="multiclass", Algorithm="xgboost")

# Model Variables
drop_cols = ['CalendarDateColumn', 'Label']
features = [c for c in DataSets[2].columns if c not in drop_cols]

# Create algo-specific model data
model.create_model_data(
  TrainData=DataSets[0],
  ValidationData=DataSets[1],
  TestData=DataSets[2],
  TargetColumnName="Label",
  NumericColumnNames=features,
  Threads=-1
)

# Print default parameter settings
model.print_algo_args()

# Update algo args
model.update_model_parameters(
    num_boost_round=200,
    num_parallel_tree=4,
    max_depth=4
)

# Train Model
model.train()

# Score train, validation, and test; store internally
model.score()

# Inspect scored data
model.ScoredData["train"]
model.ScoredData["validation"]
model.ScoredData["test"]

# Evaluate scored data
global_eval = model.evaluate(
    DataName="test"
)

# Get variable importance
imp = model.compute_feature_importance()
LightGBM Examples
Regression Training
# Setup Environment
import os
import polars as pl
from PolarsFE import datasets, character
from QuickEcharts import Charts
from retrofit import MachineLearning as ml

# Generate demo data instead of reading packaged CSVs
df = utils.make_retrofit_demo_data(
    n_rows=50_000,
    n_segments=5,
    seed=42,
)

# Get TrainData, ValidationData, and TestData
DataSets = datasets.partition_random(
    data=df,
    num_partitions=3,
    seed=42,
    percentages=[0.7, 0.2, 0.1]
)

# Create target encodings for categorical variables
categorical_cols = ['MarketingSegments', 'MarketingSegments2', 'MarketingSegments3']
output = character.categorical_encoding(
    data=DataSets[0],
    ML_Type="regression",
    group_variables=categorical_cols,
    target_variable="Leads",
    method="target_encoding",
    scoring=False,
    keep_original_factors=False
)

# Collect data and encodings
DataSets[0] = output['data']
encodings = output['factor_components']

# Note parameter: scoring=True
DataSets[1] = character.categorical_encoding(
    data=DataSets[1],
    ML_Type="regression",
    group_variables=categorical_cols,
    target_variable="Leads",
    method="target_encoding",
    scoring=True,
    supply_factor_level_list=encodings,
    keep_original_factors=False
)

# Note parameter: scoring=True
DataSets[2] = character.categorical_encoding(
    data=DataSets[2],
    ML_Type="regression",
    group_variables=categorical_cols,
    target_variable="Leads",
    method="target_encoding",
    scoring=True,
    supply_factor_level_list=encodings,
    keep_original_factors=False
)

# Initialize RetroFit
model = ml.RetroFit(TargetType="regression", Algorithm="lightgbm")

# Create algo-specific model data
model.create_model_data(
  TrainData=DataSets[0],
  ValidationData=DataSets[1],
  TestData=DataSets[2],
  TargetColumnName="Leads",
  NumericColumnNames=[
    'XREGS1',
    'XREGS2',
    'XREGS3',
    'MarketingSegments_TargetEncode',
    'MarketingSegments2_TargetEncode',
    'MarketingSegments3_TargetEncode'
  ],
  Threads=-1
)

# Print default parameter settings
model.print_algo_args()

# Update algo args
model.update_model_parameters(
    num_iterations=200,
    max_depth=6,
    min_data_in_leaf=2
)

# Train Model
model.train()

# Score train, validation, and test; store internally
model.score()

# Build regression report
path = model.build_model_insights_report(
    output_path="regression_report.html",
    theme="neon",
)

# Inspect scored data
model.ScoredData["train"]
model.ScoredData["validation"]
model.ScoredData["test"]

# Evaluate scored data
global_eval = model.evaluate(
    DataName="test"
)

# Per segment
segment_eval = model.evaluate(
    DataName="test",
    ByVariables="MarketingSegments_TargetEncode"
)

# Get variable importance
imp = model.compute_feature_importance()

# Model Calibration Tables
cal = model.build_regression_calibration_table(
    DataName="test",
    binning="quantile"
)
# Store plot in working directory
model.plot_regression_calibration(
    DataName="test",
    n_bins=20,
    binning="quantile",
    plot_name=f"{os.getcwd()}/my_calibration_plot"
)

# Get shap values
shap_train = model.compute_shap_values(split="train", attach=True)

# Shap Boxplot
shap_summary = model.plot_shap_summary(
    split="train",
    shap_attached=shap_train,
    prefix="shap_",
    top_n=20,
    max_samples=10_000,
    plot_name=f"{os.getcwd()}/my_shap_boxplot",
    Theme="dark",
)

# Create shap dependence plot
out = model.plot_shap_dependence(
    feature="XREGS1",
    split="train",
    plot_name=f"{os.getcwd()}/my_shap_pdp",
)

# Actual vs Predicted Scatterplot
model.plot_regression_scatter(
    DataName="test",
    SampleSize=15000,
    plot_name=f"{os.getcwd()}/my_scatter_plot",
    Theme="dark"
)

# Residuals vs Predicted Values
model.plot_regression_residuals_vs_predicted(
    DataName="test",
    SampleSize=15000,
    plot_name=f"{os.getcwd()}/my_residuals_plot",
    Theme="dark"
)

# Residual Distribution
model.plot_regression_residual_distribution(
    DataName="test",
    n_bins=40,
    plot_name=f"{os.getcwd()}/my_density_plot",
    Theme="dark",
)

# Actual vs Predicted Distribution Overlay
resid_dist_ = model.plot_prediction_distribution(
    DataName="test",
    n_bins=40,
    plot_name=f"{os.getcwd()}/my_overlay_plot",
)

# Numeric Partial Dependence plot
model.plot_pdp_numeric(
    feature='XREGS1',
    DataName="test",
    plot_name=f"{os.getcwd()}/numeric_pdp",
)

# Categorical Partial Dependence plot
model.plot_pdp_categorical(
    feature='MarketingSegments',
    DataName="test",
    plot_name=f"{os.getcwd()}/categorical_pdp",
)
Classification Training
# Setup Environment
import os
import polars as pl
from PolarsFE import datasets, character
from QuickEcharts import Charts
from retrofit import MachineLearning as ml

# Generate demo data instead of reading packaged CSVs
df = utils.make_retrofit_demo_data(
    n_rows=50_000,
    n_segments=5,
    seed=42,
)

# Turn Label into a binary target variable
df = df.with_columns(
    pl.when(pl.col("XREGS1") > 200).then(1)
      .otherwise(0)
      .alias("Label")
)

# Get TrainData, ValidationData, and TestData
DataSets = datasets.partition_random(
    data=df,
    num_partitions=3,
    seed=42,
    percentages=[0.7, 0.2, 0.1]
)

# Create target encodings for categorical variables
categorical_cols = ['MarketingSegments', 'MarketingSegments2', 'MarketingSegments3']
output = character.categorical_encoding(
    data=DataSets[0],
    ML_Type="classification",
    group_variables=categorical_cols,
    target_variable="Leads",
    method="target_encoding",
    scoring=False,
    keep_original_factors=False
)

# Collect data and encodings
DataSets[0] = output['data']
encodings = output['factor_components']

# Note parameter: scoring=True
DataSets[1] = character.categorical_encoding(
    data=DataSets[1],
    ML_Type="classification",
    group_variables=categorical_cols,
    target_variable="Leads",
    method="target_encoding",
    scoring=True,
    supply_factor_level_list=encodings,
    keep_original_factors=False
)

# Note parameter: scoring=True
DataSets[2] = character.categorical_encoding(
    data=DataSets[2],
    ML_Type="classification",
    group_variables=categorical_cols,
    target_variable="Label",
    method="target_encoding",
    scoring=True,
    supply_factor_level_list=encodings,
    keep_original_factors=False
)

# Initialize RetroFit
model = ml.RetroFit(TargetType="classification", Algorithm="lightgbm")

# Create algo-specific model data
model.create_model_data(
  TrainData=DataSets[0],
  ValidationData=DataSets[1],
  TestData=DataSets[2],
  TargetColumnName="Label",
  NumericColumnNames=[
    'XREGS1',
    'XREGS2',
    'XREGS3',
    'MarketingSegments_TargetEncode',
    'MarketingSegments2_TargetEncode',
    'MarketingSegments3_TargetEncode'
  ],
  Threads=-1
)

# Print default parameter settings
model.print_algo_args()

# Update algo args
model.update_model_parameters(
    num_iterations=200,
    max_depth=6,
    min_data_in_leaf=2
)

# Train Model
model.train()

# Score train, validation, and test; store internally
model.score()

# Build classification report
path = model.build_model_insights_report(
    output_path="classification_report.html",
    theme="neon",
)

# Inspect scored data
model.ScoredData["train"]
model.ScoredData["validation"]
model.ScoredData["test"]

# Evaluate scored data
global_eval = model.evaluate(
    DataName="test"
)

# Per segment
segment_eval = model.evaluate(
    DataName="test",
    ByVariables="MarketingSegments_TargetEncode"
)

# Get variable importance
imp = model.compute_feature_importance()

# Evaluate scored data
model.plot_classification_threshold_metrics(
    DataName="test",
    CostDict=dict(tpcost=1.0, fpcost=-1.0, fncost=-1.0, tncost=1.0),
    plot_name=f"{os.getcwd()}/my_thresh_plot",
    Theme="dark"
)

# Store plot in working directory
model.plot_classification_calibration(
    DataName="test",
    n_bins=20,
    binning="quantile",
    plot_name=f"{os.getcwd()}/my_calibration_plot"
)

# ROC Plot
model.plot_classification_roc(
    DataName="test",
    plot_name=f"{os.getcwd()}/my_roc_plot",
)

# PR Plot
model.plot_classification_pr(
    DataName="test",
    plot_name=f"{os.getcwd()}/my_pr_plot"
)

# Get shap values
shap_train = model.compute_shap_values(split="train", attach=True)

# Shap Boxplot
shap_summary = model.plot_shap_summary(
    split="train",
    shap_attached=shap_train,
    prefix="shap_",
    top_n=20,
    max_samples=10_000,
    plot_name=f"{os.getcwd()}/my_shap_boxplot",
    Theme="dark",
)

# Create shap dependence plot
out = model.plot_shap_dependence(
    feature="XREGS1",
    split="train",
    plot_name=f"{os.getcwd()}/my_shap_pdp",
)

# Numeric Partial Dependence plot
model.plot_pdp_numeric(
    feature='XREGS1',
    DataName="test",
    plot_name=f"{os.getcwd()}/numeric_pdp",
)

# Categorical Partial Dependence plot
model.plot_pdp_categorical(
    feature='MarketingSegments',
    DataName="test",
    plot_name=f"{os.getcwd()}/categorical_pdp",
)
MultiClass Training
# Setup Environment
import os
import polars as pl
from PolarsFE import datasets, character
from QuickEcharts import Charts
from retrofit import MachineLearning as ml

# Generate demo data instead of reading packaged CSVs
df = utils.make_retrofit_demo_data(
    n_rows=50_000,
    n_segments=5,
    seed=42,
)

# Get TrainData, ValidationData, and TestData
DataSets = datasets.partition_random(
    data=df,
    num_partitions=3,
    seed=42,
    percentages=[0.7, 0.2, 0.1]
)

# Create target encodings for categorical variables
categorical_cols = ['MarketingSegments', 'MarketingSegments2', 'MarketingSegments3']
output = character.categorical_encoding(
    data=DataSets[0],
    ML_Type="multiclass",
    group_variables=categorical_cols,
    target_variable="Leads",
    method="target_encoding",
    scoring=False,
    keep_original_factors=False
)

# Collect data and encodings
DataSets[0] = output['data']
encodings = output['factor_components']

# Note parameter: scoring=True
DataSets[1] = character.categorical_encoding(
    data=DataSets[1],
    ML_Type="multiclass",
    group_variables=categorical_cols,
    target_variable="Leads",
    method="target_encoding",
    scoring=True,
    supply_factor_level_list=encodings,
    keep_original_factors=False
)

# Note parameter: scoring=True
DataSets[2] = character.categorical_encoding(
    data=DataSets[2],
    ML_Type="multiclass",
    group_variables=categorical_cols,
    target_variable="Label",
    method="target_encoding",
    scoring=True,
    supply_factor_level_list=encodings,
    keep_original_factors=False
)

# Initialize RetroFit
model = ml.RetroFit(TargetType="multiclass", Algorithm="lightgbm")

# Model Variables
drop_cols = ['CalendarDateColumn', 'Label']
features = [c for c in DataSets[2].columns if c not in drop_cols]

# Create algo-specific model data
model.create_model_data(
  TrainData=DataSets[0],
  ValidationData=DataSets[1],
  TestData=DataSets[2],
  TargetColumnName="Label",
  NumericColumnNames=features,
  Threads=-1
)

# Print default parameter settings
model.print_algo_args()

# Update algo args
model.update_model_parameters(
    num_iterations=200,
    max_depth=6,
    min_data_in_leaf=2
)

# Train Model
model.train()

# Score train, validation, and test; store internally
model.score()

# Inspect scored data
model.ScoredData["train"]
model.ScoredData["validation"]
model.ScoredData["test"]

# Evaluate scored data
global_eval = model.evaluate(
    DataName="test"
)

# Get variable importance
imp = model.compute_feature_importance()
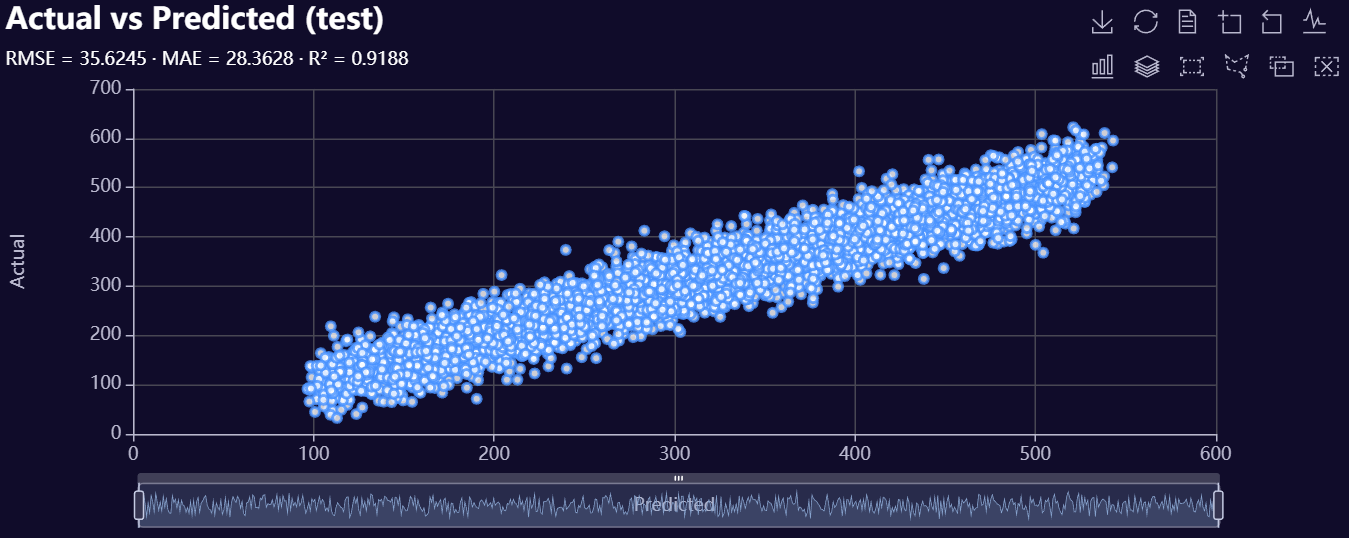
2. Model Evaluation Visuals
Below is a gallery of example evaluation plots produced by RetroFit.
Click to expand gallery
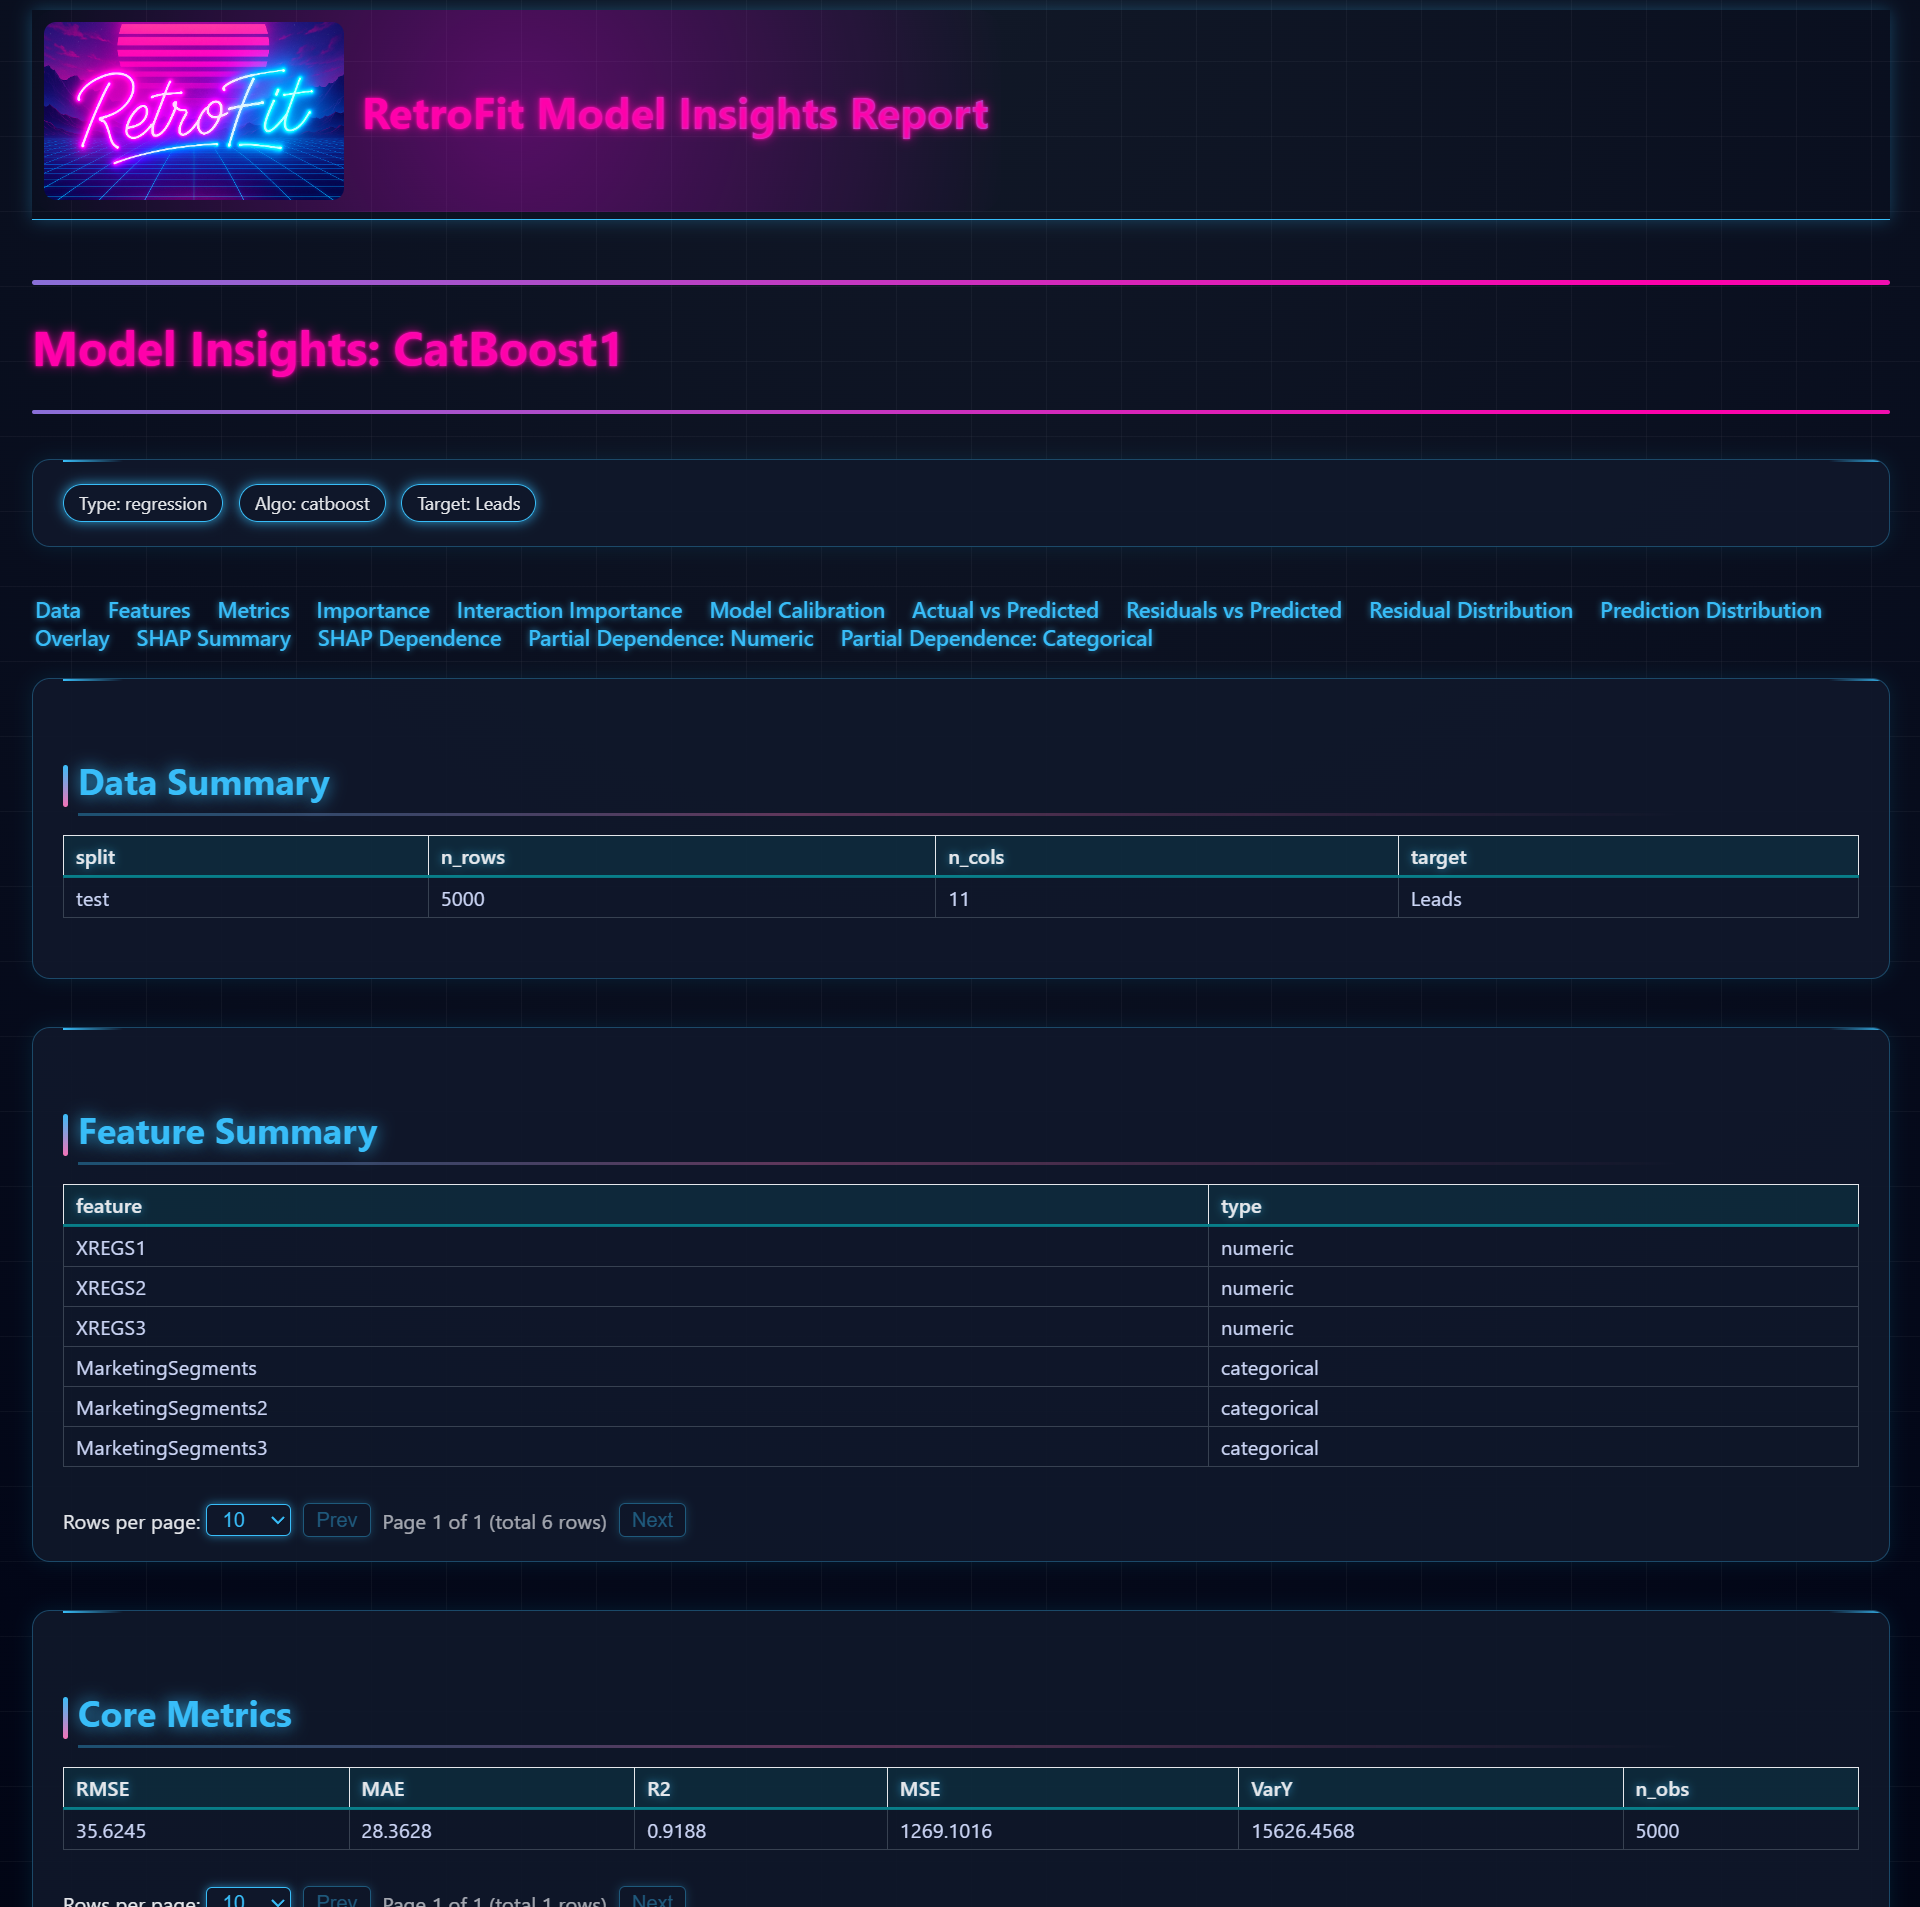
3. Model Insights Reports
Below is a gallery of example insights report outputs produced by RetroFit.
Click to expand gallery
Release history Release notifications | RSS feed


Download files
Download the file for your platform. If you're not sure which to choose, learn more about installing packages.
Source Distribution
Built Distribution
Filter files by name, interpreter, ABI, and platform.
If you're not sure about the file name format, learn more about wheel file names.
Copy a direct link to the current filters
File details
Details for the file retrofit-0.3.1.tar.gz.
File metadata
- Download URL: retrofit-0.3.1.tar.gz
- Upload date:
- Size: 4.4 MB
- Tags: Source
- Uploaded using Trusted Publishing? No
- Uploaded via: twine/6.2.0 CPython/3.11.11
File hashes
| Algorithm | Hash digest | |
|---|---|---|
| SHA256 |
183f9f9a5a156fd835f3fc0416dbbe822a7987c7cdce8a9fbdae36a99c0e073a
|
|
| MD5 |
bc20a350cde5911c6ac977d7de132694
|
|
| BLAKE2b-256 |
e8f7182e04424a0e3a9d5b639e66ed02530d21906579de48e82202b2897e0bf7
|
File details
Details for the file retrofit-0.3.1-py3-none-any.whl.
File metadata
- Download URL: retrofit-0.3.1-py3-none-any.whl
- Upload date:
- Size: 4.4 MB
- Tags: Python 3
- Uploaded using Trusted Publishing? No
- Uploaded via: twine/6.2.0 CPython/3.11.11
File hashes
| Algorithm | Hash digest | |
|---|---|---|
| SHA256 |
a42b0be2b795f953be0d8a6de9fe07803b8c3f89dc651b59d3d5699862faee47
|
|
| MD5 |
243030eb9bbb575dc135bb87e1833df4
|
|
| BLAKE2b-256 |
ff559305c948917c4fbef86d169aa3ea5a769ab30df0665926ece17b11cef072
|


