
RFE-cross-validation



Recursive Feature Elimination run inside every cross-validation fold — so you can see not just how many features to keep, but which ones, and how stable that choice is.
Motivation
scikit-learn gives you two related but incomplete tools:
RFECVcross-validates the number of features to keep, but doesn't tell you how stable each individual feature's importance is.RFEranks the features, but on a single fit — with no notion of variability.
rfe_cv fills the gap: it runs RFE separately in each CV fold and aggregates
the per-fold rankings. A feature that is consistently ranked first across folds
is a robust choice; one whose rank swings wildly is not. That fold-to-fold
variability is what the shaded band communicates.
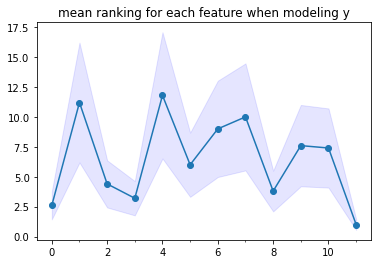
Figure: mean RFE rank across folds for each feature (1 = most important). The band shows the fold-to-fold variability of the rank.
How it works
- Ranking (Figure 1). For each CV fold, fit
RFEand record the ranking of every feature. Aggregate across folds into a mean rank (± a band). - Scoring (Figure 2). Order features by mean rank, then evaluate a
cross-validated
scoringmetric using the top n features, for n from 1 up tomax_features. This is the classic "score vs. number of features" curve, but built from the cross-validated ranking.
Install
pip install rfe-cv
Requires Python ≥ 3.9, plus numpy, pandas, scipy, matplotlib and scikit-learn (≥ 1.0), which pip installs for you.
Quick start
import pandas as pd
from sklearn.ensemble import RandomForestRegressor
from rfe_cv import rfe_cv

# df has feature columns plus a target column 'y'
features = ['x0', 'x1', 'x2', 'x3']

res = rfe_cv(df, features, 'y', RandomForestRegressor(),
             cv=5, scoring='r2')

res['rank_mean']          # mean RFE rank per feature (1 = best)
res['rank_std']           # rank std across folds
res['scores_mean']        # CV score using the n best features
res['selected_features']  # feature names selected at each step
res['fig1'], res['fig2']  # the two matplotlib figures
See example.py
for regression, classification, comparing two models on the same axes, and
max_features.
Parameters
| Parameter | Default | Description |
|---|---|---|
df |
— | pandas DataFrame with the feature and target columns. |
vars_x |
— | list of feature column names. |
var_y |
— | target column name (str) or names (list). |
estimator |
— | any sklearn estimator exposing coef_ or feature_importances_ (required by RFE). |
cv |
5 |
number of folds or a cross-validation splitter. |
max_features |
None |
highest number of best features in the score curve (default: all). |
scoring |
'accuracy' |
sklearn scoring metric; must match the estimator (regression vs. classification). |
std_scaling |
False |
standard-scale features; fitted inside each fold (no leakage). |
band |
'sem' |
what the shaded band shows — see below. |
figs |
None |
[fig1, fig2] to overlay onto existing figures. |
show |
True |
draw the legend and call plt.show(). |
figsize |
(8, 4) |
size of newly created figures. |
model_label |
None |
legend label for this model. |
verbose |
False |
print the feature subset evaluated at each step. |
Returns a dict with keys features, rank_mean, rank_std, scores_mean,
scores_std, selected_features, fig1, fig2.
The shaded band (band)
Both figures draw a band around each curve, built from the standard deviation across folds. What that band means is your choice — and switching costs nothing extra, since the std is already computed:
band |
Band represents | Half-width |
|---|---|---|
'sem' (default) |
Student-t confidence interval of the mean | t · s / √n |
'std' |
raw fold-to-fold dispersion | s |
'none' |
no band | — |
⚠️ With few folds, the std estimate
sis itself noisy — its relative error is about1 / √(2(n−1)), roughly 35% atcv=5. Read narrow bands with caution; increasingcvis the cheapest way to tighten them reliably.
Comparing models on the same figures
Pass the figures from the first call into the next, and keep show=False until
the final model:
res = rfe_cv(df, features, 'y', model_a, model_label='A', show=False)
rfe_cv(df, features, 'y', model_b, model_label='B',
       figs=[res['fig1'], res['fig2']], show=True)
Development
git clone https://github.com/attilalr/RFE-cross-validation.git
cd RFE-cross-validation
python -m venv .venv && source .venv/bin/activate
pip install -e ".[dev]"
pytest
Releases are built and uploaded by the publish GitHub Actions workflow using
PyPI Trusted Publishing — no API tokens are stored in the repository. Publishing
a GitHub release uploads to PyPI; running the workflow manually with
target: testpypi uploads to TestPyPI.
Roadmap
- Separate module file and example script
- Return structured results (a dict)
- Figure parameters (
figsize, overlay viafigs) - English-only comments
- Return figures instead of only plotting
- Input type checks
- Consistent, leak-free scaling between selection and scoring (Pipeline)
- Choice of what the band represents (
band) - Packaged and published on PyPI
- Richer example / notebook walkthrough
1 maintainer

Metadata
1 maintainer
Release files for rfe-cv 0.1.0
For a detailed explanation of source distributions (sdists) and built distributions (wheels), please see the package formats documentation.
Source distribution (sdist)
| File | Size | Uploaded | |
|---|---|---|---|
| rfe_cv-0.1.0.tar.gz | 13.6 kB | Details |
Built distribution (wheel)
| File | Interpreter | ABI | Platform | Reset |
|---|---|---|---|---|
| rfe_cv-0.1.0-py3-none-any.whl | Python 3 | none | any | Details |
Total release size: 22.8 kB
Release files / rfe_cv-0.1.0.tar.gz
| Download URL | rfe_cv-0.1.0.tar.gz |
|---|---|
| Size | 13.6 kB |
| Tags | Source |
|
SHA-256 checksum How to use checksums |
5e619d748eac5c7f2d2caf788cbeb68151c767067ac874b11fbb7a6d65a69771
|
|
BLAKE2b-256 checksum How to use checksums |
c0365f748259d7895781d214021ca069f730fd3abd15530ba6e4b58c7fb4604a
|
| Upload date | |
|
Uploaded using Trusted Publishing? What is trusted publishing? |
Yes |
| Uploaded via |
twine/7.0.0 CPython/3.13.14
|
Provenance
Provenance describes where a file came from. On PyPI, provenance is shared via attestations, which provide a verifiable record of the build or publishing details. View details, limitations and caveats.


PyPI Publish Attestation
PyPI verified that this artifact, at this checksum, originated from the publisher listed below.
Signed by GitHub Actions, verified by PyPI on Aug 11, 2026.
Transparency logRelease files / rfe_cv-0.1.0-py3-none-any.whl
| Download URL | rfe_cv-0.1.0-py3-none-any.whl |
|---|---|
| Size | 9.2 kB |
| Tags | Python 3 |
|
SHA-256 checksum How to use checksums |
923588e5a95fb0215341090d5b15a2747e6b7db8166faaae56f9b1a4ce1a07c3
|
|
BLAKE2b-256 checksum How to use checksums |
9641dc76e089949e4c4bbb293b31008119dffc6e2407113f76c447daa9d02dfb
|
| Upload date | |
|
Uploaded using Trusted Publishing? What is trusted publishing? |
Yes |
| Uploaded via |
twine/7.0.0 CPython/3.13.14
|
Provenance
Provenance describes where a file came from. On PyPI, provenance is shared via attestations, which provide a verifiable record of the build or publishing details. View details, limitations and caveats.
PyPI Publish Attestation
PyPI verified that this artifact, at this checksum, originated from the publisher listed below.
Signed by GitHub Actions, verified by PyPI on Aug 11, 2026.
Transparency log












