Ridgeline plots for plotnine

Project description
ridgenine


Ridgeline plots for plotnine, inspired by the ggridges package for ggplot2.
Ridgeline plots display the distribution of a continuous variable across multiple categories as a series of overlapping density curves — useful for comparing many distributions at once in a compact, readable layout.
Installation
pip
pip install ridgenine
uv
uv add ridgenine
Quick start
from plotnine import ggplot, aes
from ridgenine import geom_density_ridges, theme_ridges

(
    ggplot(df, aes("value", "category"))
    + geom_density_ridges()
    + theme_ridges()
)
Examples
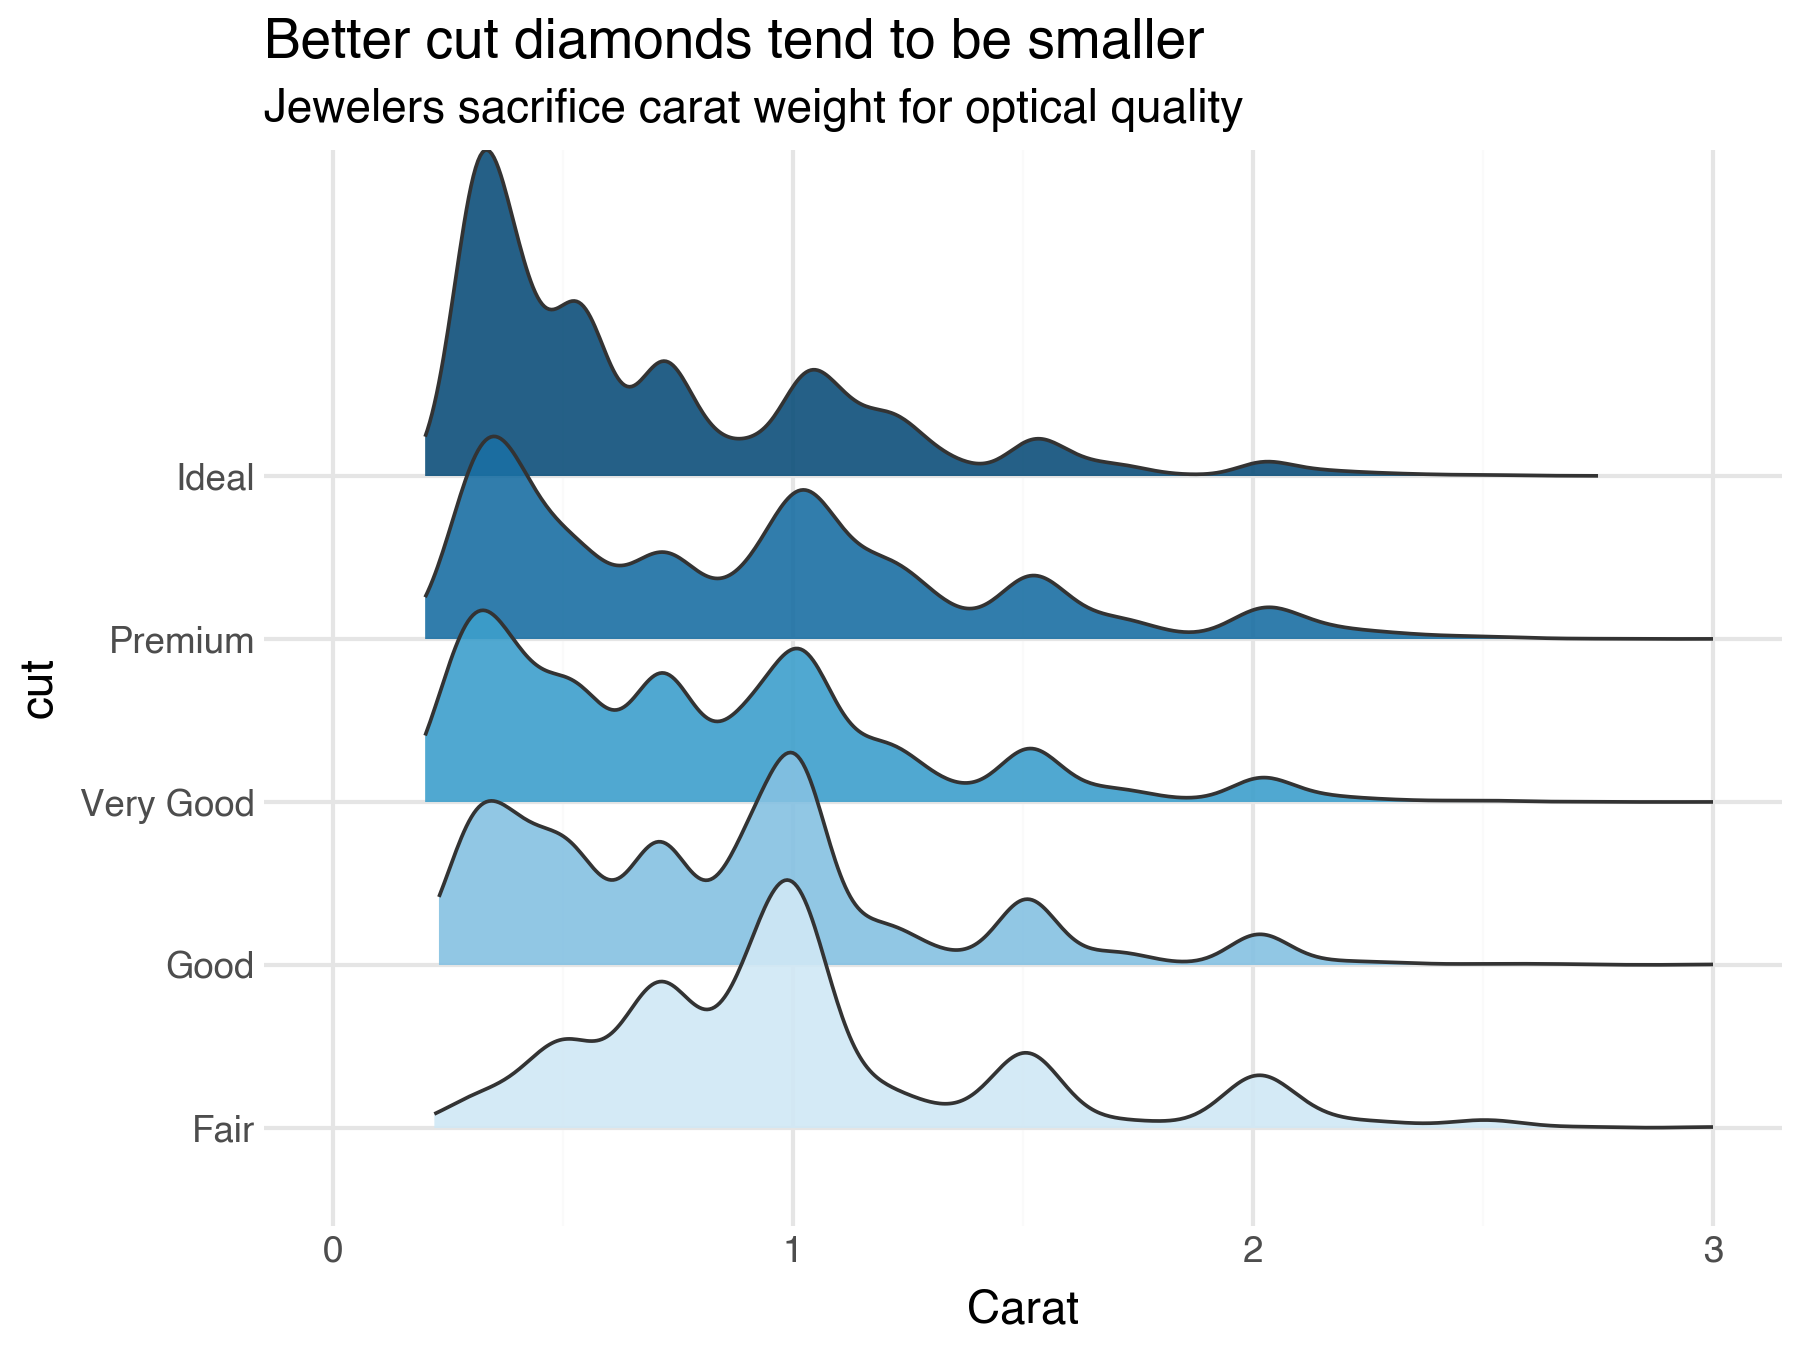
Density ridges
geom_density_ridges estimates a kernel density for each category and draws
it as a filled ridge. The scale parameter controls overlap: scale=1 means
the tallest ridge exactly reaches the next category's baseline; values above 1
cause overlap, values below 1 leave gaps. Pair with theme_ridges() for a
clean, purpose-built look.
Here, a sequential fill palette reinforces the ordering — darker blue means higher cut quality — revealing that better-cut diamonds tend to be smaller.
import pandas as pd
from plotnine import ggplot, aes, scale_fill_manual, scale_x_continuous
from plotnine.data import diamonds
from ridgenine import geom_density_ridges

cut_order = ["Fair", "Good", "Very Good", "Premium", "Ideal"]
diamonds["cut"] = pd.Categorical(diamonds["cut"], categories=cut_order, ordered=True)

(
    ggplot(diamonds, aes("carat", "cut", fill="cut"))
    + geom_density_ridges(scale=2.0, alpha=0.9, trim=True)
    + scale_fill_manual(values=["#d0e8f5", "#85c1e2", "#3d9fcc", "#1a6fa3", "#0d4f7a"])
    + scale_x_continuous(limits=(0, 3))
)
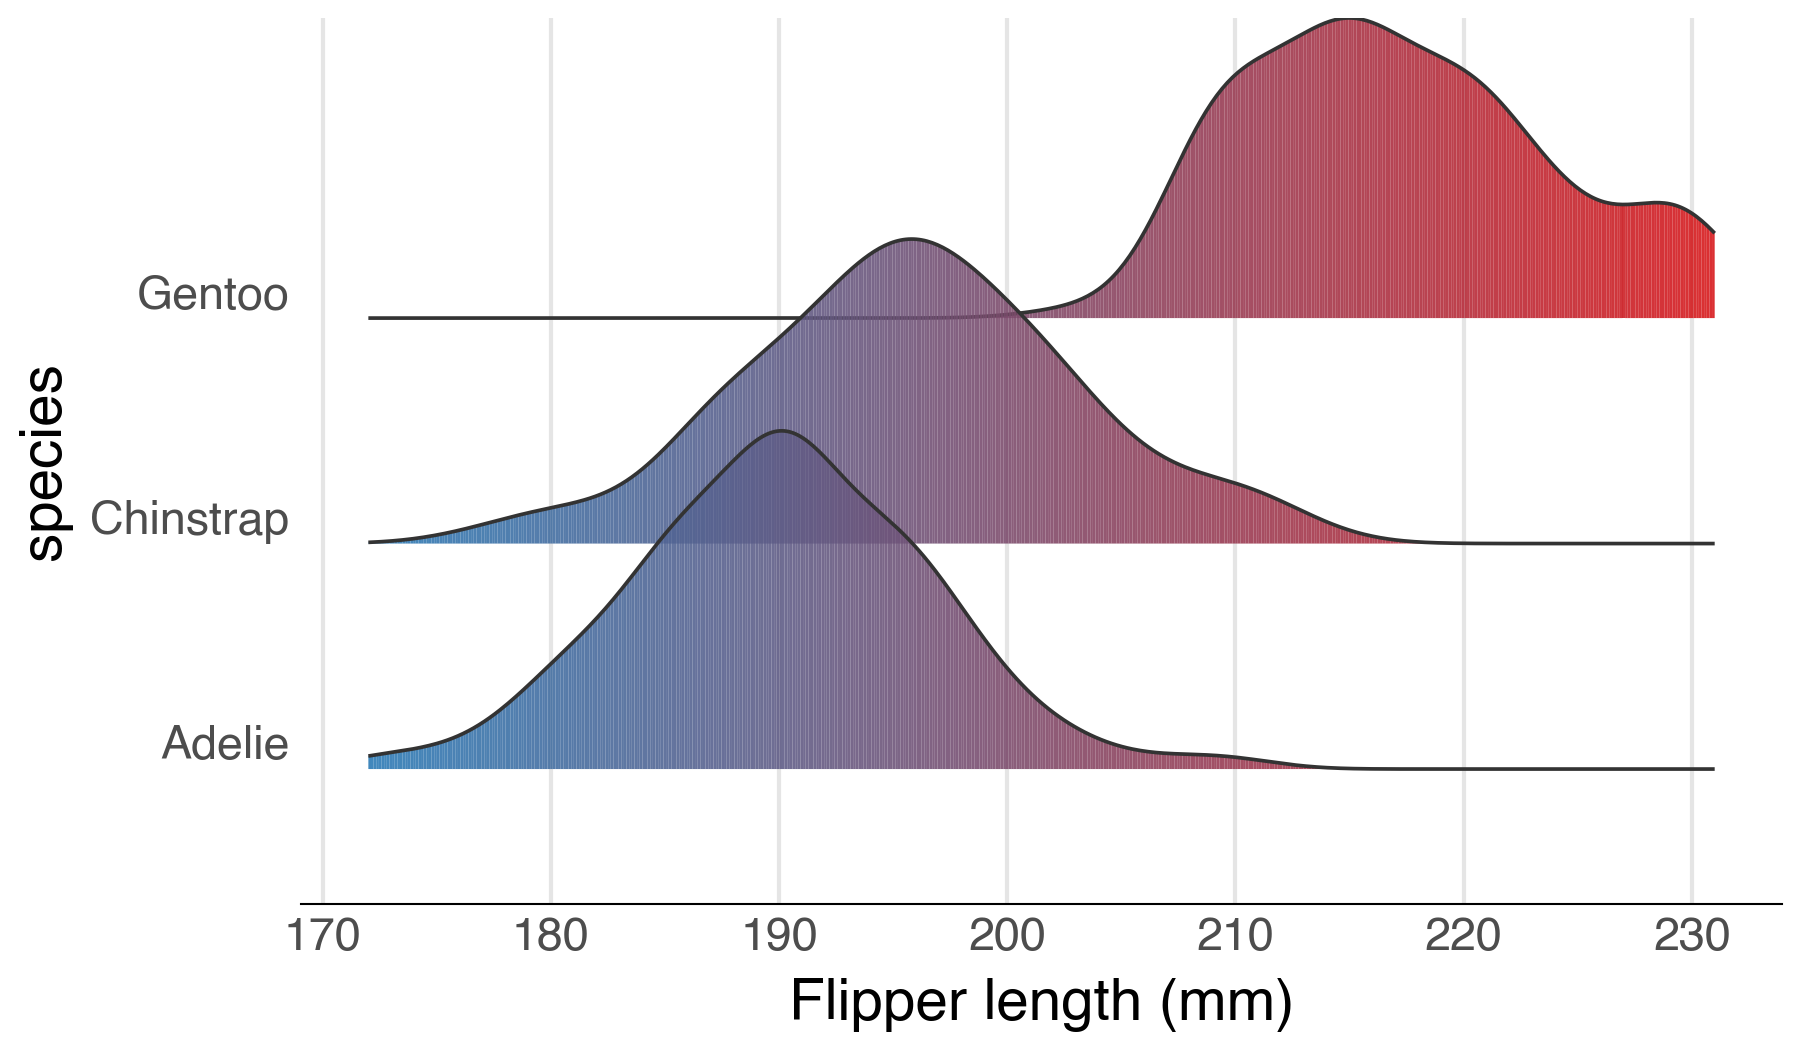
Gradient fills
geom_density_ridges_gradient allows the fill colour to vary continuously
along each ridge. By default, fill is mapped to x position. Pair it with a
continuous colour scale for smooth gradients, or map fill to
after_stat("quantile") for discrete quantile bands.
from plotnine import ggplot, aes, scale_fill_gradient
from plotnine.data import penguins
from plotnine.mapping.evaluation import after_stat
from ridgenine import geom_density_ridges_gradient

(
    ggplot(penguins.dropna(), aes("flipper_length_mm", "species", fill=after_stat("x")))
    + geom_density_ridges_gradient(scale=1.5)
    + scale_fill_gradient(low="#2c7bb6", high="#d7191c")
)
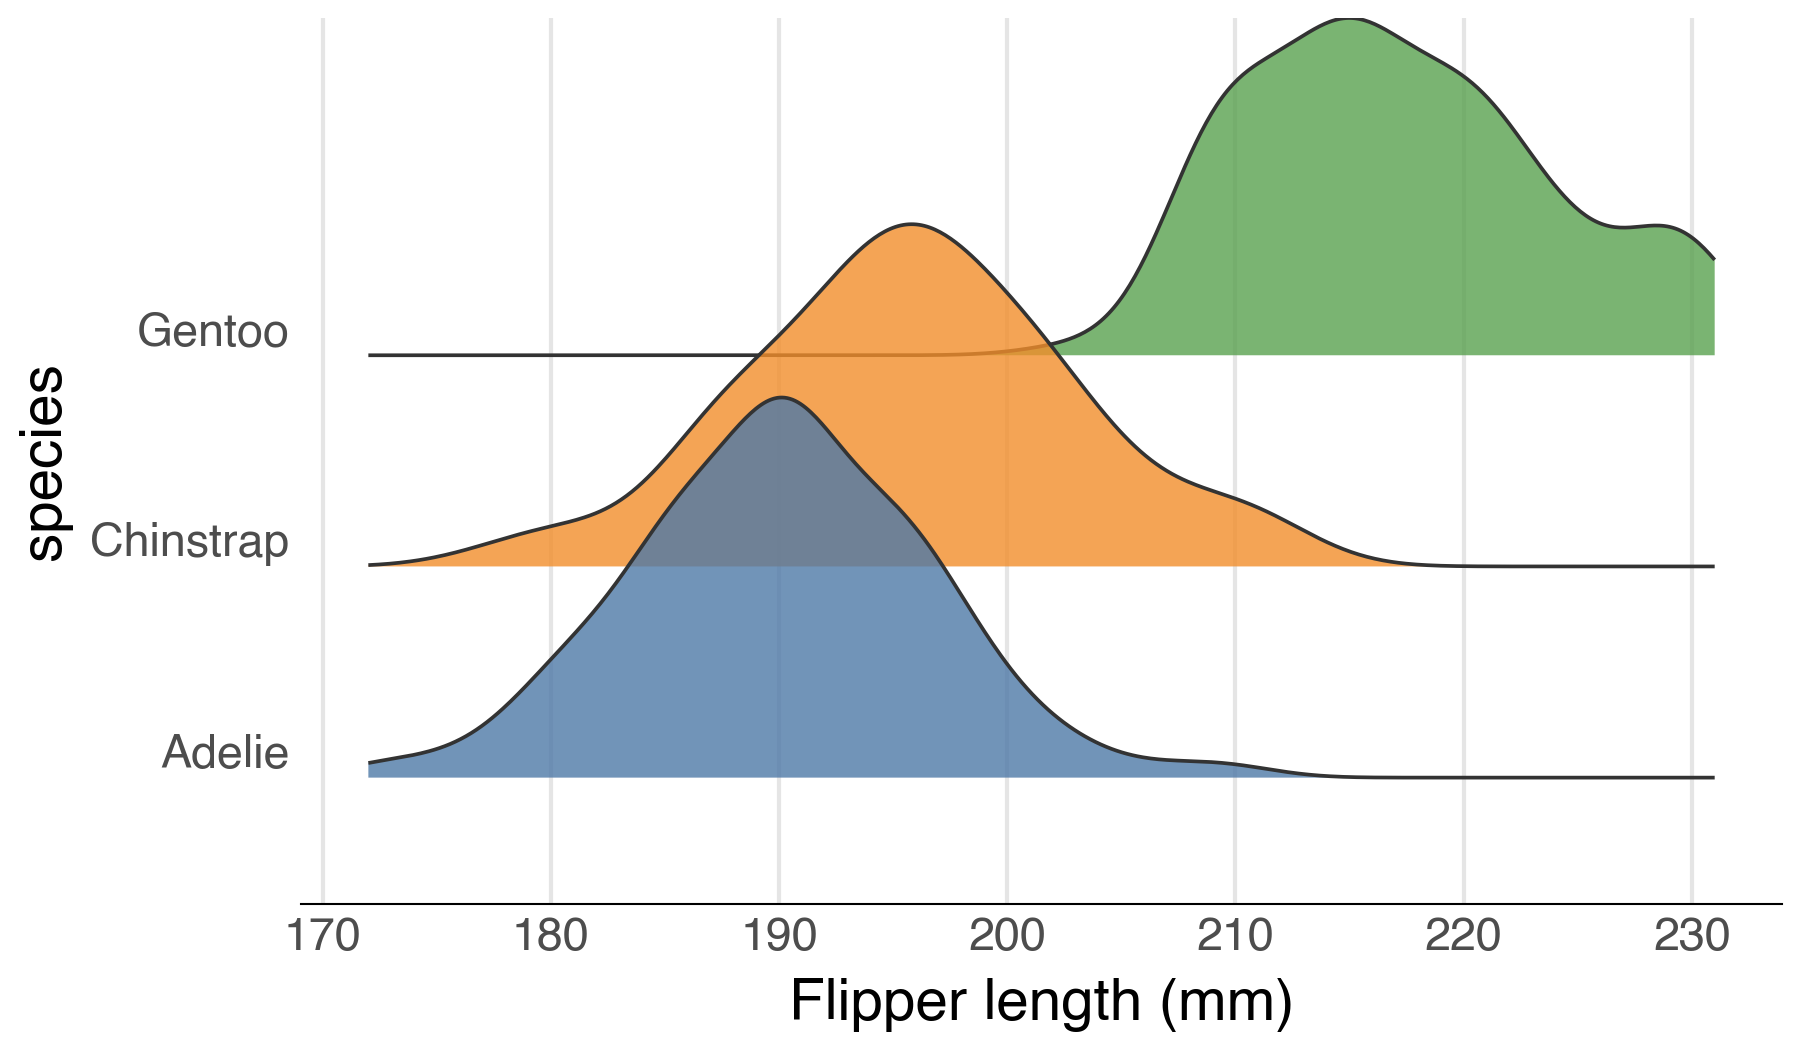
Quantile lines
Draw vertical lines at quantile boundaries within each ridge using
quantile_lines=True. By default, lines are drawn at the 25th, 50th,
and 75th percentiles. Use quantiles to customise the cut points.
from plotnine import ggplot, aes, scale_fill_manual
from plotnine.data import penguins
from ridgenine import geom_density_ridges

(
    ggplot(penguins.dropna(), aes("flipper_length_mm", "species", fill="species"))
    + geom_density_ridges(scale=1.5, alpha=0.7, quantile_lines=True)
    + scale_fill_manual(values=["#4E79A7", "#F28E2B", "#59A14F"])
)
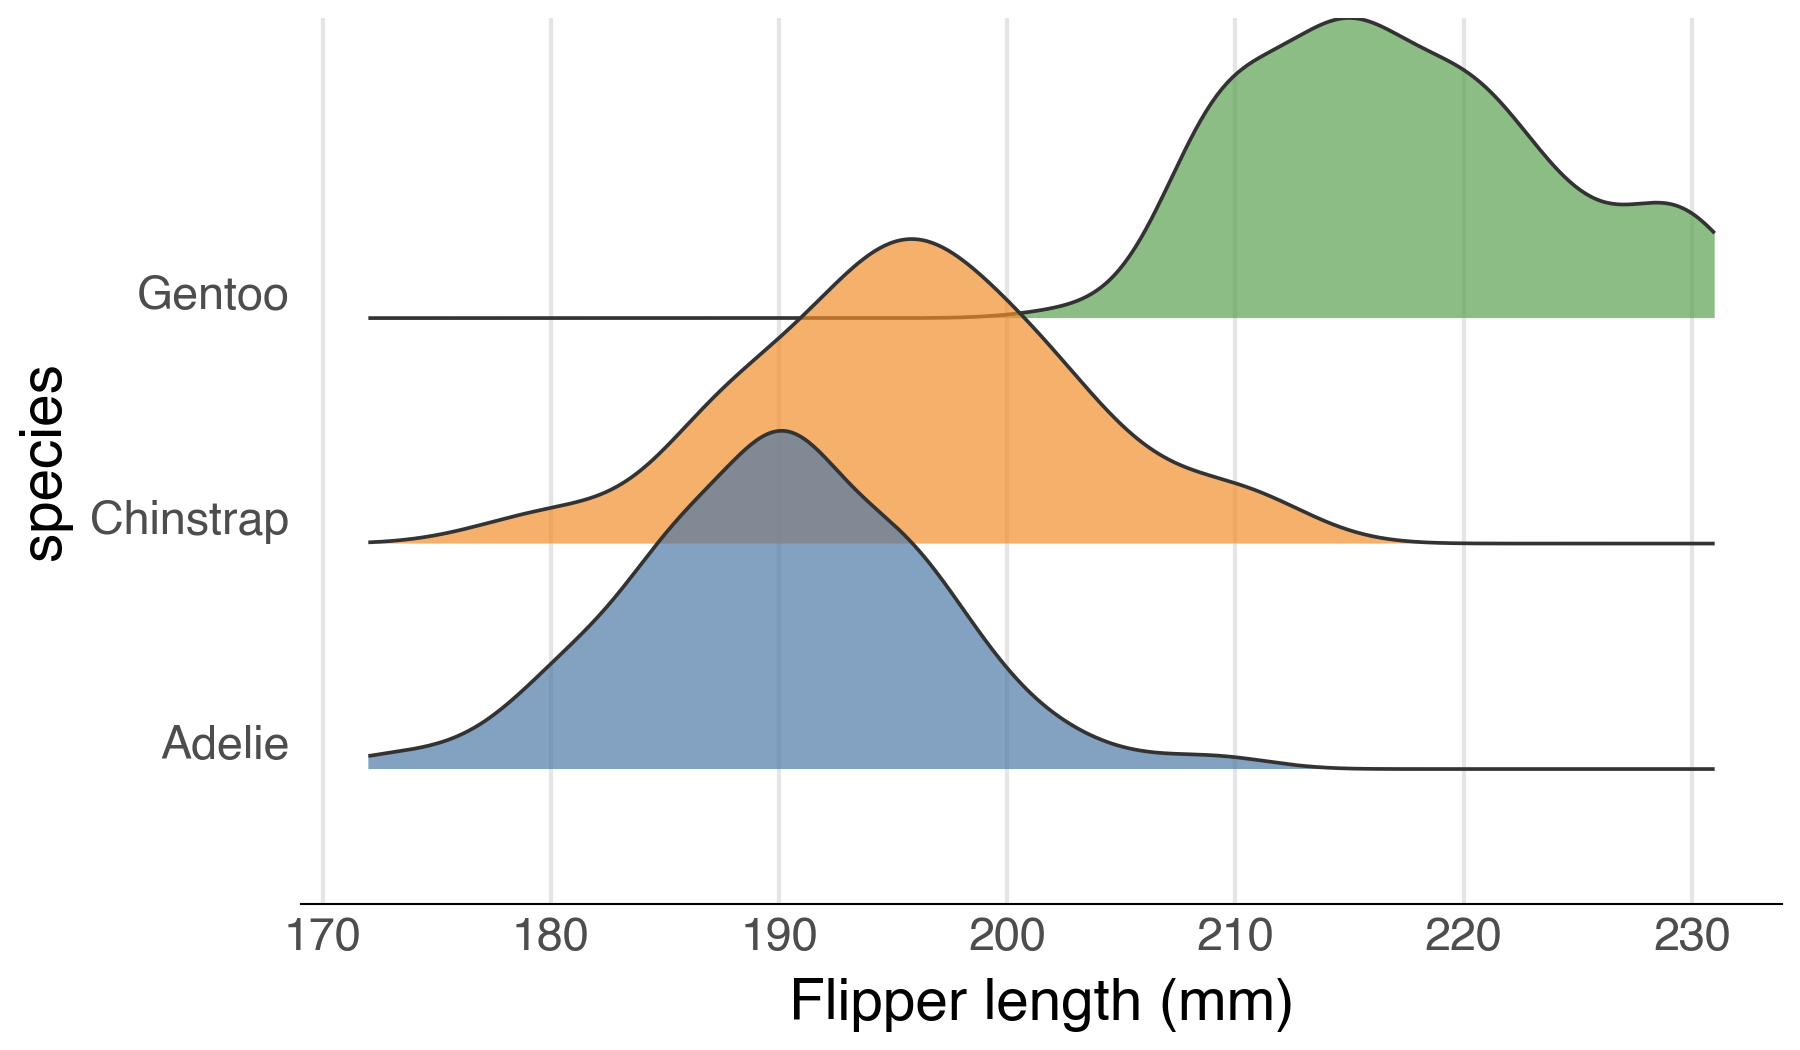
Jittered points
Show the raw data points scattered within each ridge envelope using
jittered_points=True. Point appearance is controlled with point_size,
point_alpha, point_color, and point_shape.
from plotnine import ggplot, aes, scale_fill_manual
from plotnine.data import penguins
from ridgenine import geom_density_ridges

(
    ggplot(penguins.dropna(), aes("flipper_length_mm", "species", fill="species"))
    + geom_density_ridges(
        scale=1.5, alpha=0.6,
        jittered_points=True, point_size=0.5, point_alpha=0.4,
    )
    + scale_fill_manual(values=["#4E79A7", "#F28E2B", "#59A14F"])
)

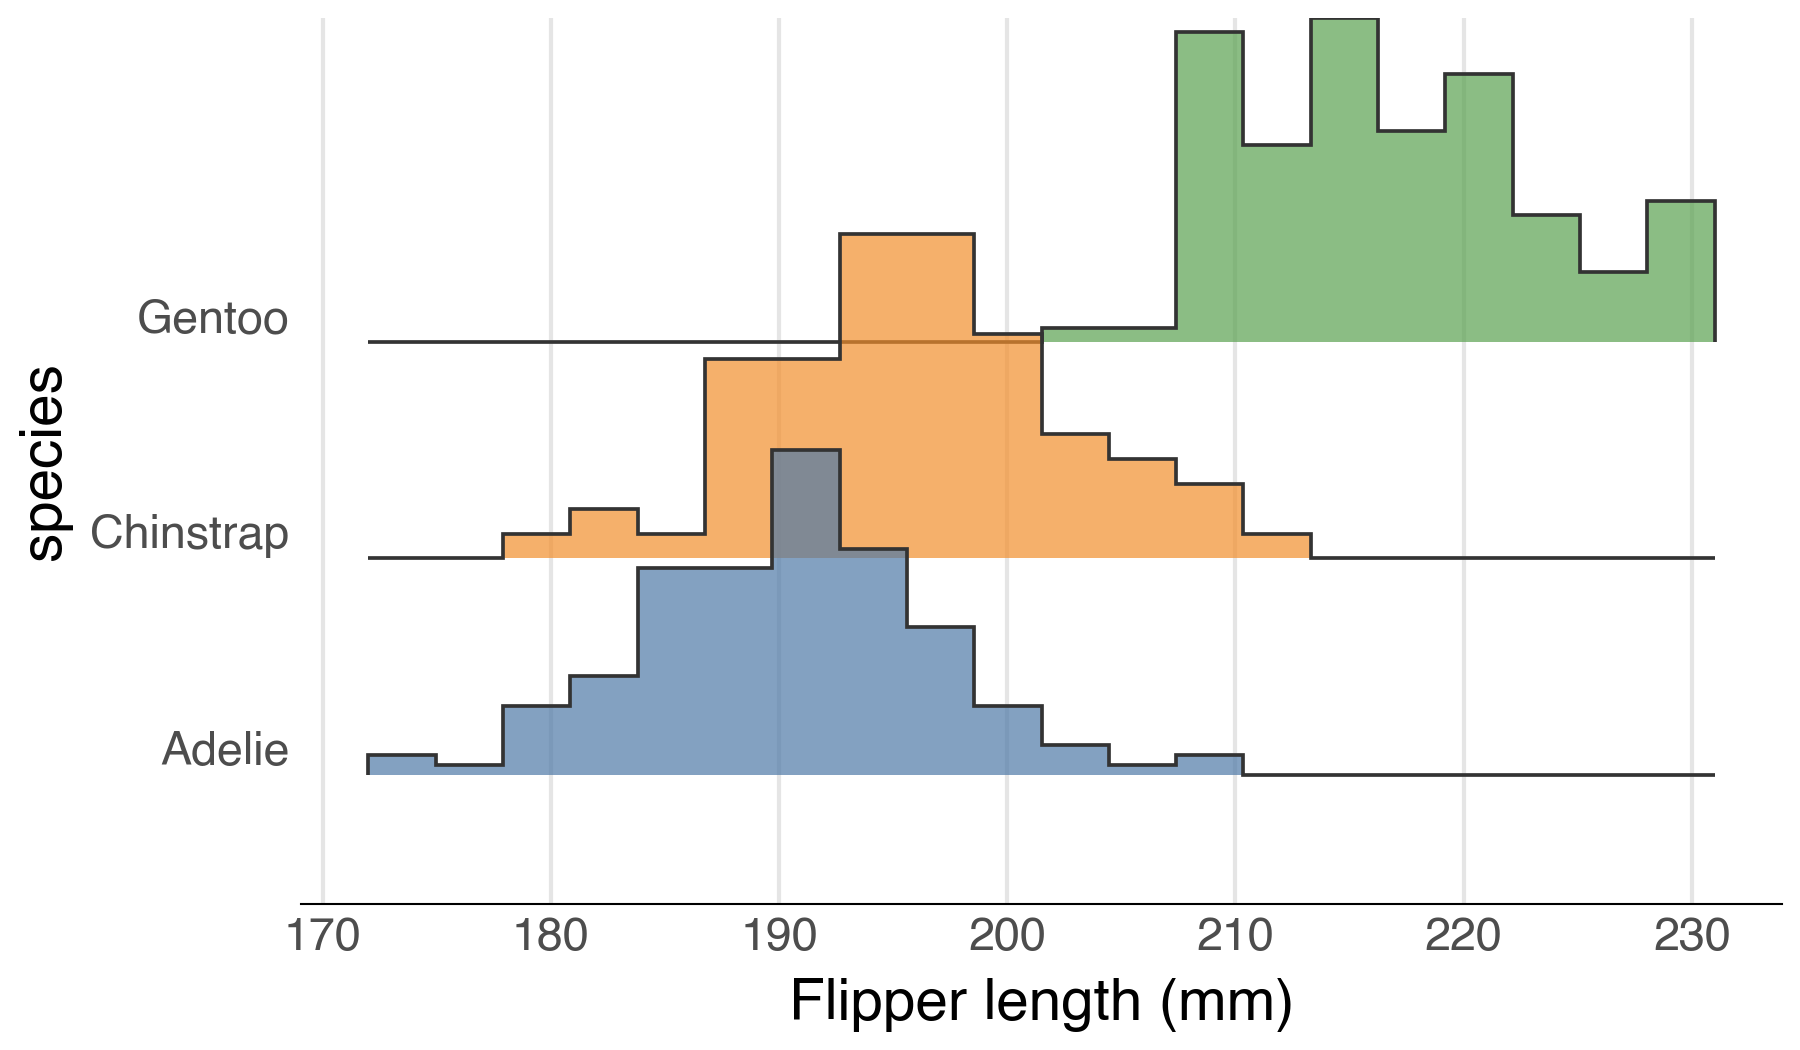
Histogram ridges
Use stat_binline with geom_ridgeline for histogram-style stepped
ridgelines instead of smooth KDE curves.
from plotnine import ggplot, aes, scale_fill_manual
from plotnine.data import penguins
from ridgenine import geom_ridgeline

(
    ggplot(penguins.dropna(), aes("flipper_length_mm", "species", fill="species"))
    + geom_ridgeline(stat="binline", bins=20, scale=1.5, alpha=0.7)
    + scale_fill_manual(values=["#4E79A7", "#F28E2B", "#59A14F"])
)
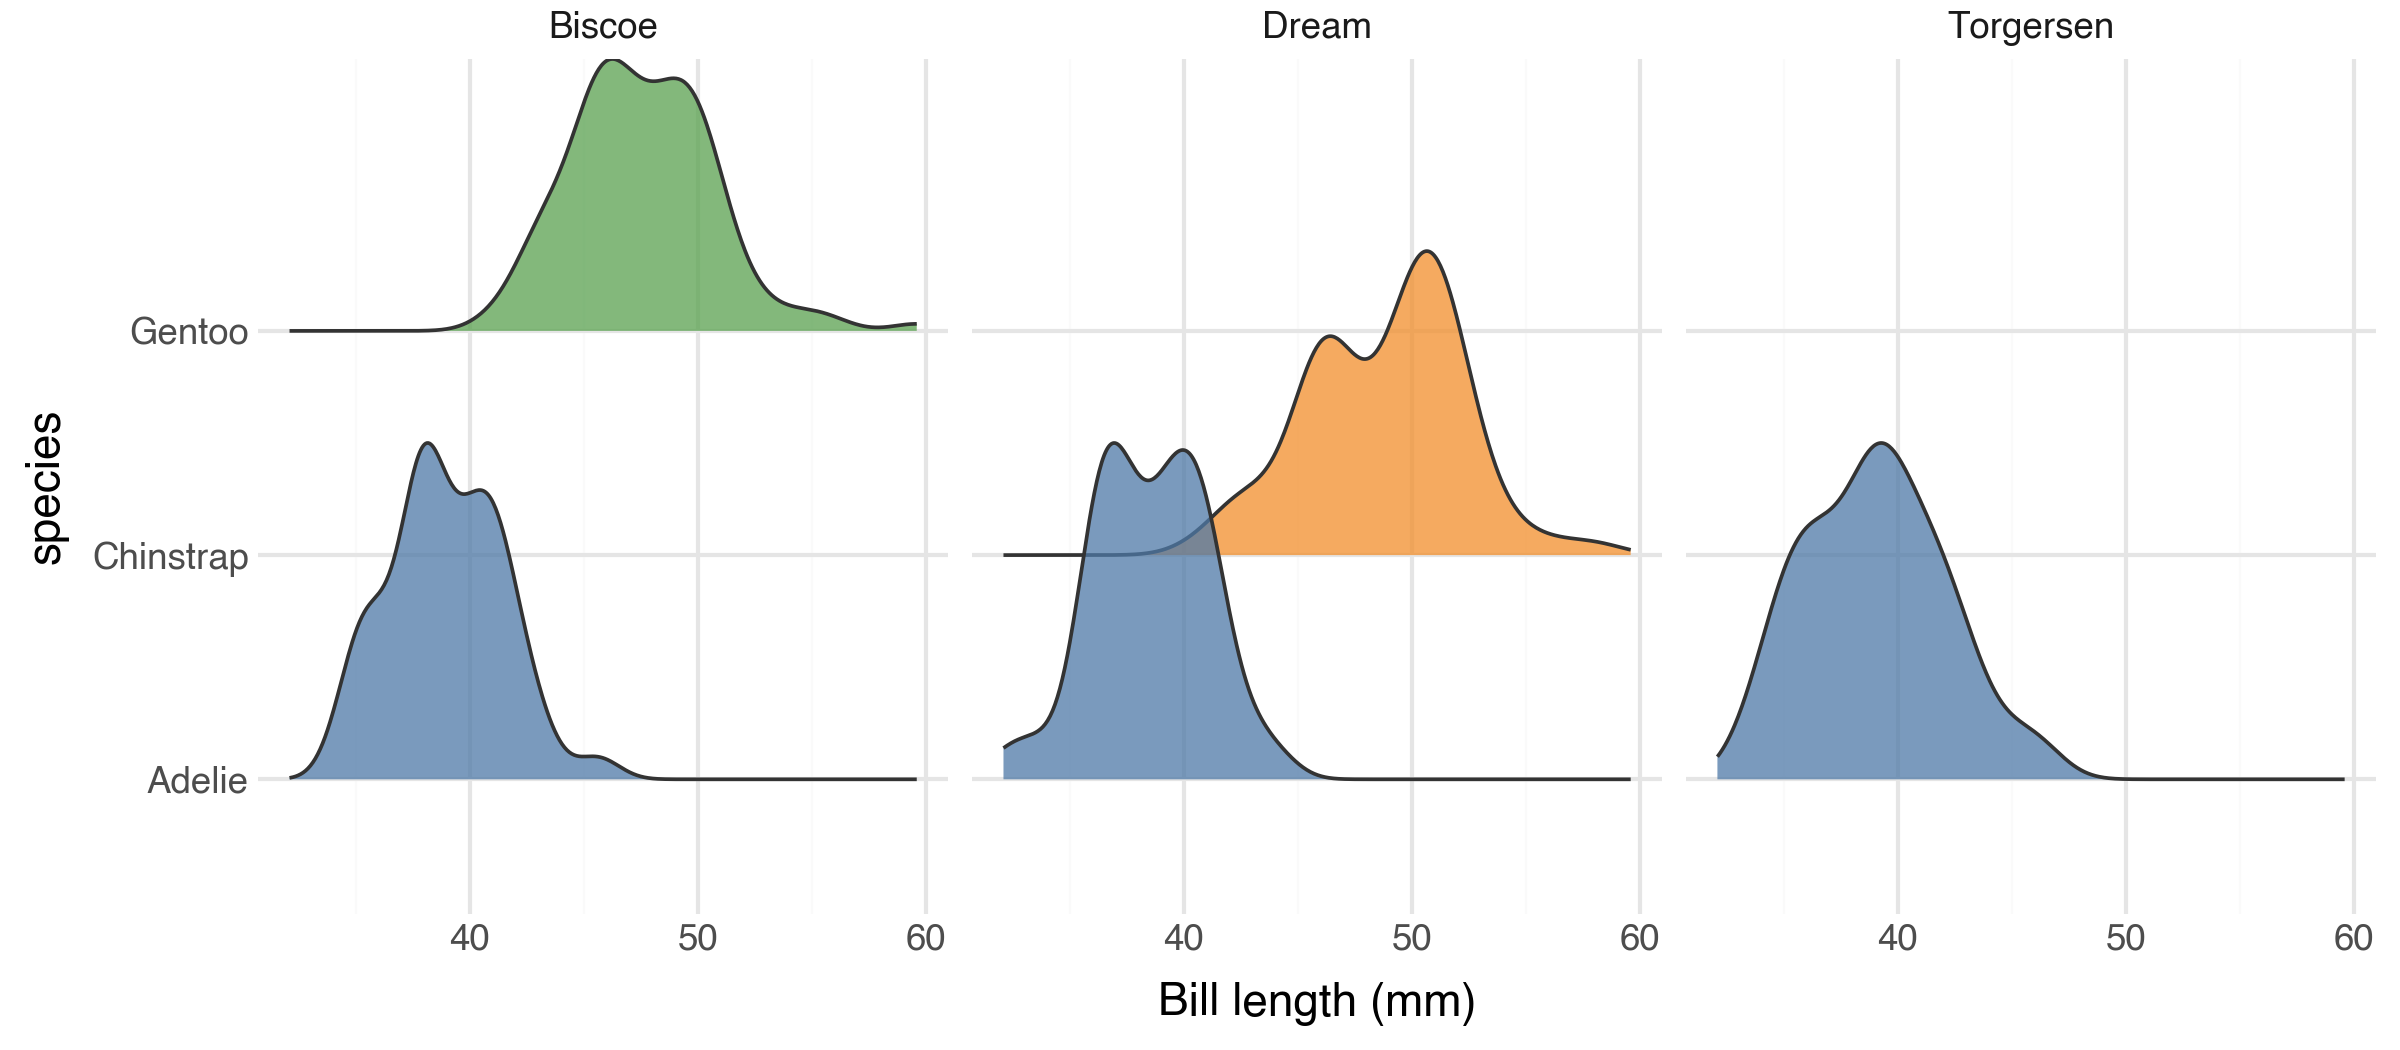
Faceting
geom_density_ridges composes naturally with the rest of plotnine's grammar,
including facet_wrap and facet_grid.
from plotnine import ggplot, aes, facet_wrap, scale_fill_manual
from plotnine.data import penguins
from ridgenine import geom_density_ridges

(
    ggplot(penguins.dropna(), aes("bill_length_mm", "species", fill="species"))
    + geom_density_ridges(scale=1.5, alpha=0.75)
    + scale_fill_manual(values=["#4E79A7", "#F28E2B", "#59A14F"])
    + facet_wrap("island")
)
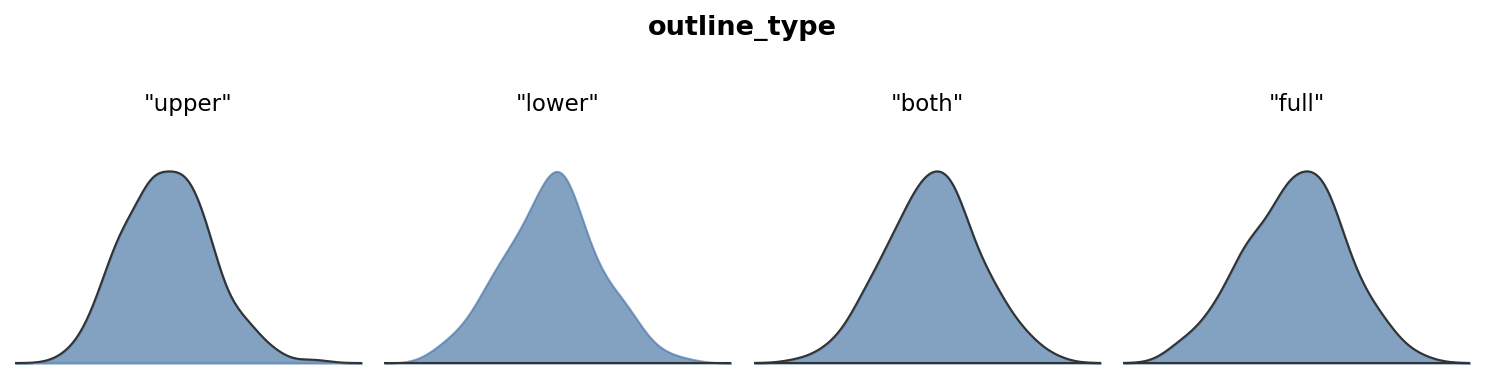
Outline types
The outline_type parameter controls which boundary of the ridge is stroked.
From left to right: "upper" (default), "lower", "both", "full".
API
geom_density_ridges
The primary geom. Computes a KDE for each y category and draws it as a
filled ridge.
| Parameter | Default | Description |
|---|---|---|
scale |
1.0 |
Ridge height multiplier. Values > 1 cause overlap. |
rel_min_height |
0 |
Clip density tails below this fraction of the panel-wide peak to the baseline. E.g. 0.01 removes the bottom 1% of each ridge's tails. |
panel_scaling |
True |
If True, normalise heights per panel. If False, normalise globally so ridge heights are comparable across facets. |
quantile_lines |
False |
If True, draw vertical lines at quantile boundaries within each ridge. |
quantiles |
None |
An integer k for k equal-probability bands, or a list of floats (e.g. [0.25, 0.5, 0.75]). Defaults to [0.25, 0.5, 0.75] when quantile_lines=True. |
jittered_points |
False |
If True, draw raw data points jittered within each ridge. |
point_shape |
"o" |
Marker shape for jittered points. |
point_size |
0.5 |
Size of jittered points. |
point_alpha |
1.0 |
Opacity of jittered points. |
point_color |
None |
Colour of jittered points. None uses the ridge outline colour. |
point_seed |
42 |
Random seed for reproducible jitter positions. |
kernel |
"gaussian" |
KDE kernel (same options as stat_density). |
bw |
"nrd0" |
Bandwidth or bandwidth method. |
adjust |
1 |
Bandwidth multiplier. |
trim |
False |
Trim density to the data range of each group. |
n |
512 |
Number of density evaluation points per group. |
gridsize |
None |
Number of equally-spaced grid points for KDE evaluation. If None, falls back to n. |
cut |
3 |
Grid extension past data range in multiples of bw. |
clip |
(-inf, inf) |
Drop x values outside this range before fitting. |
bounds |
(-inf, inf) |
Domain boundaries for boundary-bias correction. |
outline_type |
"upper" |
Which boundary to stroke: "upper", "lower", "both", "full". |
The height aesthetic defaults to after_stat("ndensity") (density
normalised to [0, 1] across the whole panel). Override it to use raw density
or counts:
from plotnine.mapping.evaluation import after_stat

# Area proportional to number of observations
ggplot(df, aes("x", "y", height=after_stat("count"))) + geom_density_ridges()
geom_density_ridges_gradient
Like geom_density_ridges, but renders each ridge as a series of thin
vertical strips so that the fill colour can vary along the x-axis. Map
fill=after_stat("x") for a smooth gradient, or
fill=after_stat("quantile") for discrete quantile bands.
Accepts the same KDE and outline_type parameters as geom_density_ridges.
Does not support quantile_lines or jittered_points.
geom_ridgeline
Lower-level geom for pre-computed heights. Requires x, y, and height
aesthetics. The height value at each x point controls how far above the
category baseline the ridge extends. Accepts the same scale and
outline_type parameters as geom_density_ridges.
stat_density_ridges
The stat underlying geom_density_ridges. Can be used independently to
attach density computation to another geom. Produces density, ndensity,
count, scaled, n, and quantile columns.
stat_binline
Bins x values into a histogram and produces a step-function suitable for
geom_ridgeline. A discrete alternative to KDE.
| Parameter | Default | Description |
|---|---|---|
bins |
30 |
Number of bins. |
binwidth |
None |
Width of each bin. Overrides bins. |
center |
None |
Center of one of the bins. |
boundary |
None |
Boundary between two bins. |
breaks |
None |
Explicit bin edges. Overrides bins and binwidth. |
pad |
True |
Add zero-height points at the extremes. |
theme_ridges
A clean theme designed for ridgeline plots, analogous to ggridges::theme_ridges.
Removes horizontal grid lines (obscured by the ridges), keeps subtle vertical
guides, and uses a slightly larger base font size.
| Parameter | Default | Description |
|---|---|---|
font_size |
14 |
Base font size in points. |
line_size |
0.5 |
Thickness of axis lines and tick marks. |
grid |
True |
If False, remove vertical grid lines for a completely clean background. |
Contributing
Contributions are welcome! To get started:
# Clone the repository
git clone https://github.com/briandconnelly/ridgenine.git
cd ridgenine

# Install in development mode
uv sync

# Install pre-commit hooks
uvx pre-commit install

# Run the test suite
uv run pytest

# Lint and format
uv run ruff check src/ tests/
uv run ruff format src/ tests/
Please open an issue before starting work on large changes so we can discuss the approach. All pull requests should include tests and maintain the existing coverage threshold (95%).
Credits
ridgenine is a port of ggridges by Claus O. Wilke to the Python / plotnine ecosystem.
License
Release history Release notifications | RSS feed


Download files
Download the file for your platform. If you're not sure which to choose, learn more about installing packages.
Source Distribution
Built Distribution
Filter files by name, interpreter, ABI, and platform.
If you're not sure about the file name format, learn more about wheel file names.
Copy a direct link to the current filters
File details
Details for the file ridgenine-0.1.1.tar.gz.
File metadata
- Download URL: ridgenine-0.1.1.tar.gz
- Upload date:
- Size: 858.1 kB
- Tags: Source
- Uploaded using Trusted Publishing? No
- Uploaded via: uv/0.10.9 {"installer":{"name":"uv","version":"0.10.9","subcommand":["publish"]},"python":null,"implementation":{"name":null,"version":null},"distro":{"name":"macOS","version":null,"id":null,"libc":null},"system":{"name":null,"release":null},"cpu":null,"openssl_version":null,"setuptools_version":null,"rustc_version":null,"ci":null}
File hashes
| Algorithm | Hash digest | |
|---|---|---|
| SHA256 |
883366139f5b9993ca228195f85168d32f09399c1a351d31b6ade7488275cfb1
|
|
| MD5 |
a2fe45d211b86c14f5889433cd03d899
|
|
| BLAKE2b-256 |
18cc9c3e17df87e296d2e841e8f955d703ae6950b5de62fb4dc2a9abddb3de82
|
File details
Details for the file ridgenine-0.1.1-py3-none-any.whl.
File metadata
- Download URL: ridgenine-0.1.1-py3-none-any.whl
- Upload date:
- Size: 20.0 kB
- Tags: Python 3
- Uploaded using Trusted Publishing? No
- Uploaded via: uv/0.10.9 {"installer":{"name":"uv","version":"0.10.9","subcommand":["publish"]},"python":null,"implementation":{"name":null,"version":null},"distro":{"name":"macOS","version":null,"id":null,"libc":null},"system":{"name":null,"release":null},"cpu":null,"openssl_version":null,"setuptools_version":null,"rustc_version":null,"ci":null}
File hashes
| Algorithm | Hash digest | |
|---|---|---|
| SHA256 |
ac8ccc10b73ac5ab3dced5227523da17b82c21933e7a8fd5d818a0b61a7bc19e
|
|
| MD5 |
aec90e97b3770df8865cfcd636e6902a
|
|
| BLAKE2b-256 |
907a015e7c92c2cbe045bdf1e02bc10cb37f7310693f0f5bd5377f628be612d8
|


