A Python package to automatically extract channel centerlines and banklines from water index images of rivers
Verified details
These details have been verified by PyPIProject links
GitHub Statistics
Maintainers

Project description
rivabar

Description
rivabar is a Python package that aims to automatically extract channel centerlines and banklines from water index images of rivers.
The focus is on getting good representations of the banklines, as centerlines are not physical features and how they are exactly derived
is subjective. This is achieved in part by viewing channels as boundaries between polygons that correspond to islands or bars, as this
allows us to take advantage of algorithms developed for spatial analysis. In this view, even a single-thread channel becomes the boundary
between two land domains.
rivabar relies on the following Python packages, among others:
- networkx to work with graphs
- sknw for converting the channel skeleton into a graph
- Python Spatial Analysis Library (libpysal) to get neighborhood relations between banks / islands
- Urban Morphology Measuring Toolkit (momepy) to create clean centerline graphs
rivabar can be used to map single-thread and multithread rivers, in an almost entirely automated fashion. It requires a water mask as input
and a start (source) and end (sink) points for the channel / channel belt / delta.
The package features an object-oriented API through the River class, which provides:
- Intuitive workflow: Create a river object, process it, and access results through properties
- Interactive tools: Built-in methods for selecting start/end points and visualizing results
- State management: Automatic handling of processing state and data persistence
- Batch processing: Class methods for processing multiple scenes efficiently
- Backward compatibility: The functional API (
map_river_banksand friends) remains available
Beyond centerline/bankline extraction, rivabar also includes:
- Multi-temporal analysis: tributary detection, splitting rivers at persistent confluences, and matching segments across scenes (
find_common_confluences,match_river_segments) - Curvature–migration analysis: DTW-based migration rate measurement between scenes and pair classification (
analyze_river_pairs_filtered,analyze_segment_group,classify_pairs) - Migration prediction: calibration and forward prediction with the Howard & Knutson (1984) model, including spatially-varying erodibility (
calibrate_segment,predict_forward,calibrate_local_kl; see Sylvester et al., 2019, Geology)
The images below illustrate how rivabar extracts both centerlines and banklines from a Landsat image of the Brahmaputra River, and creates
an island neighborhood graph in addition to the centerline graph.
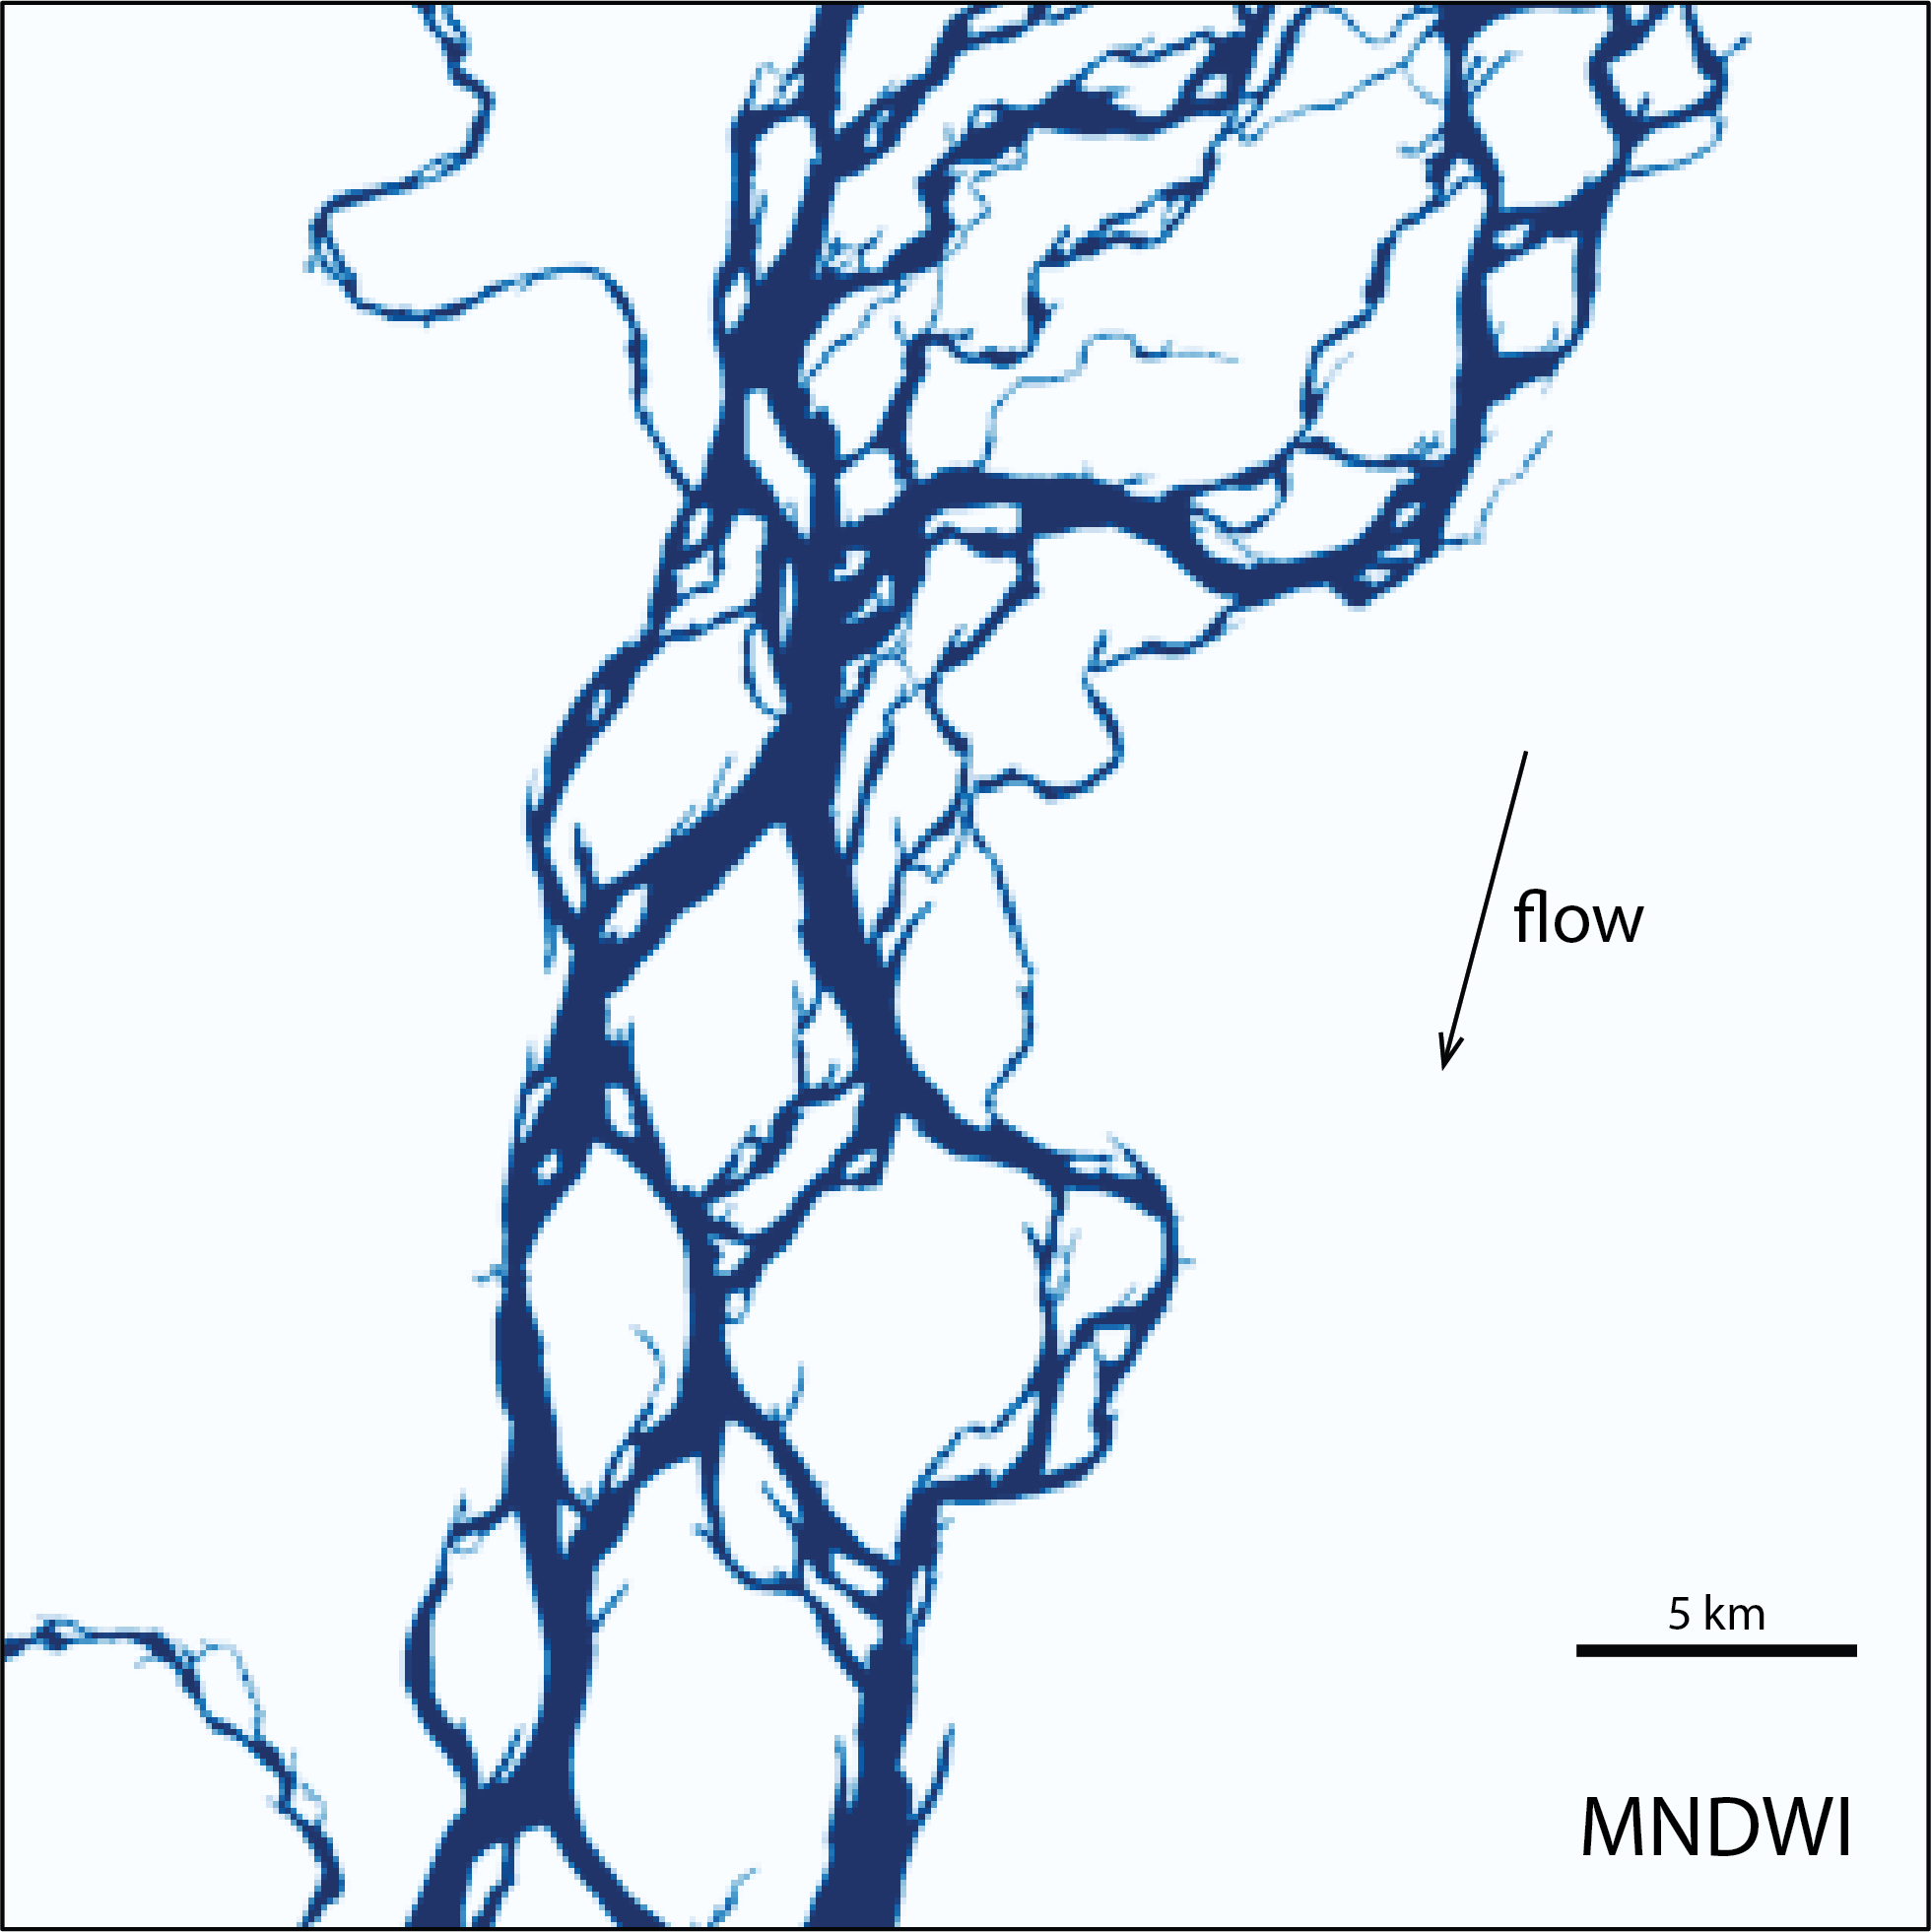
Brahmaputra River - water index
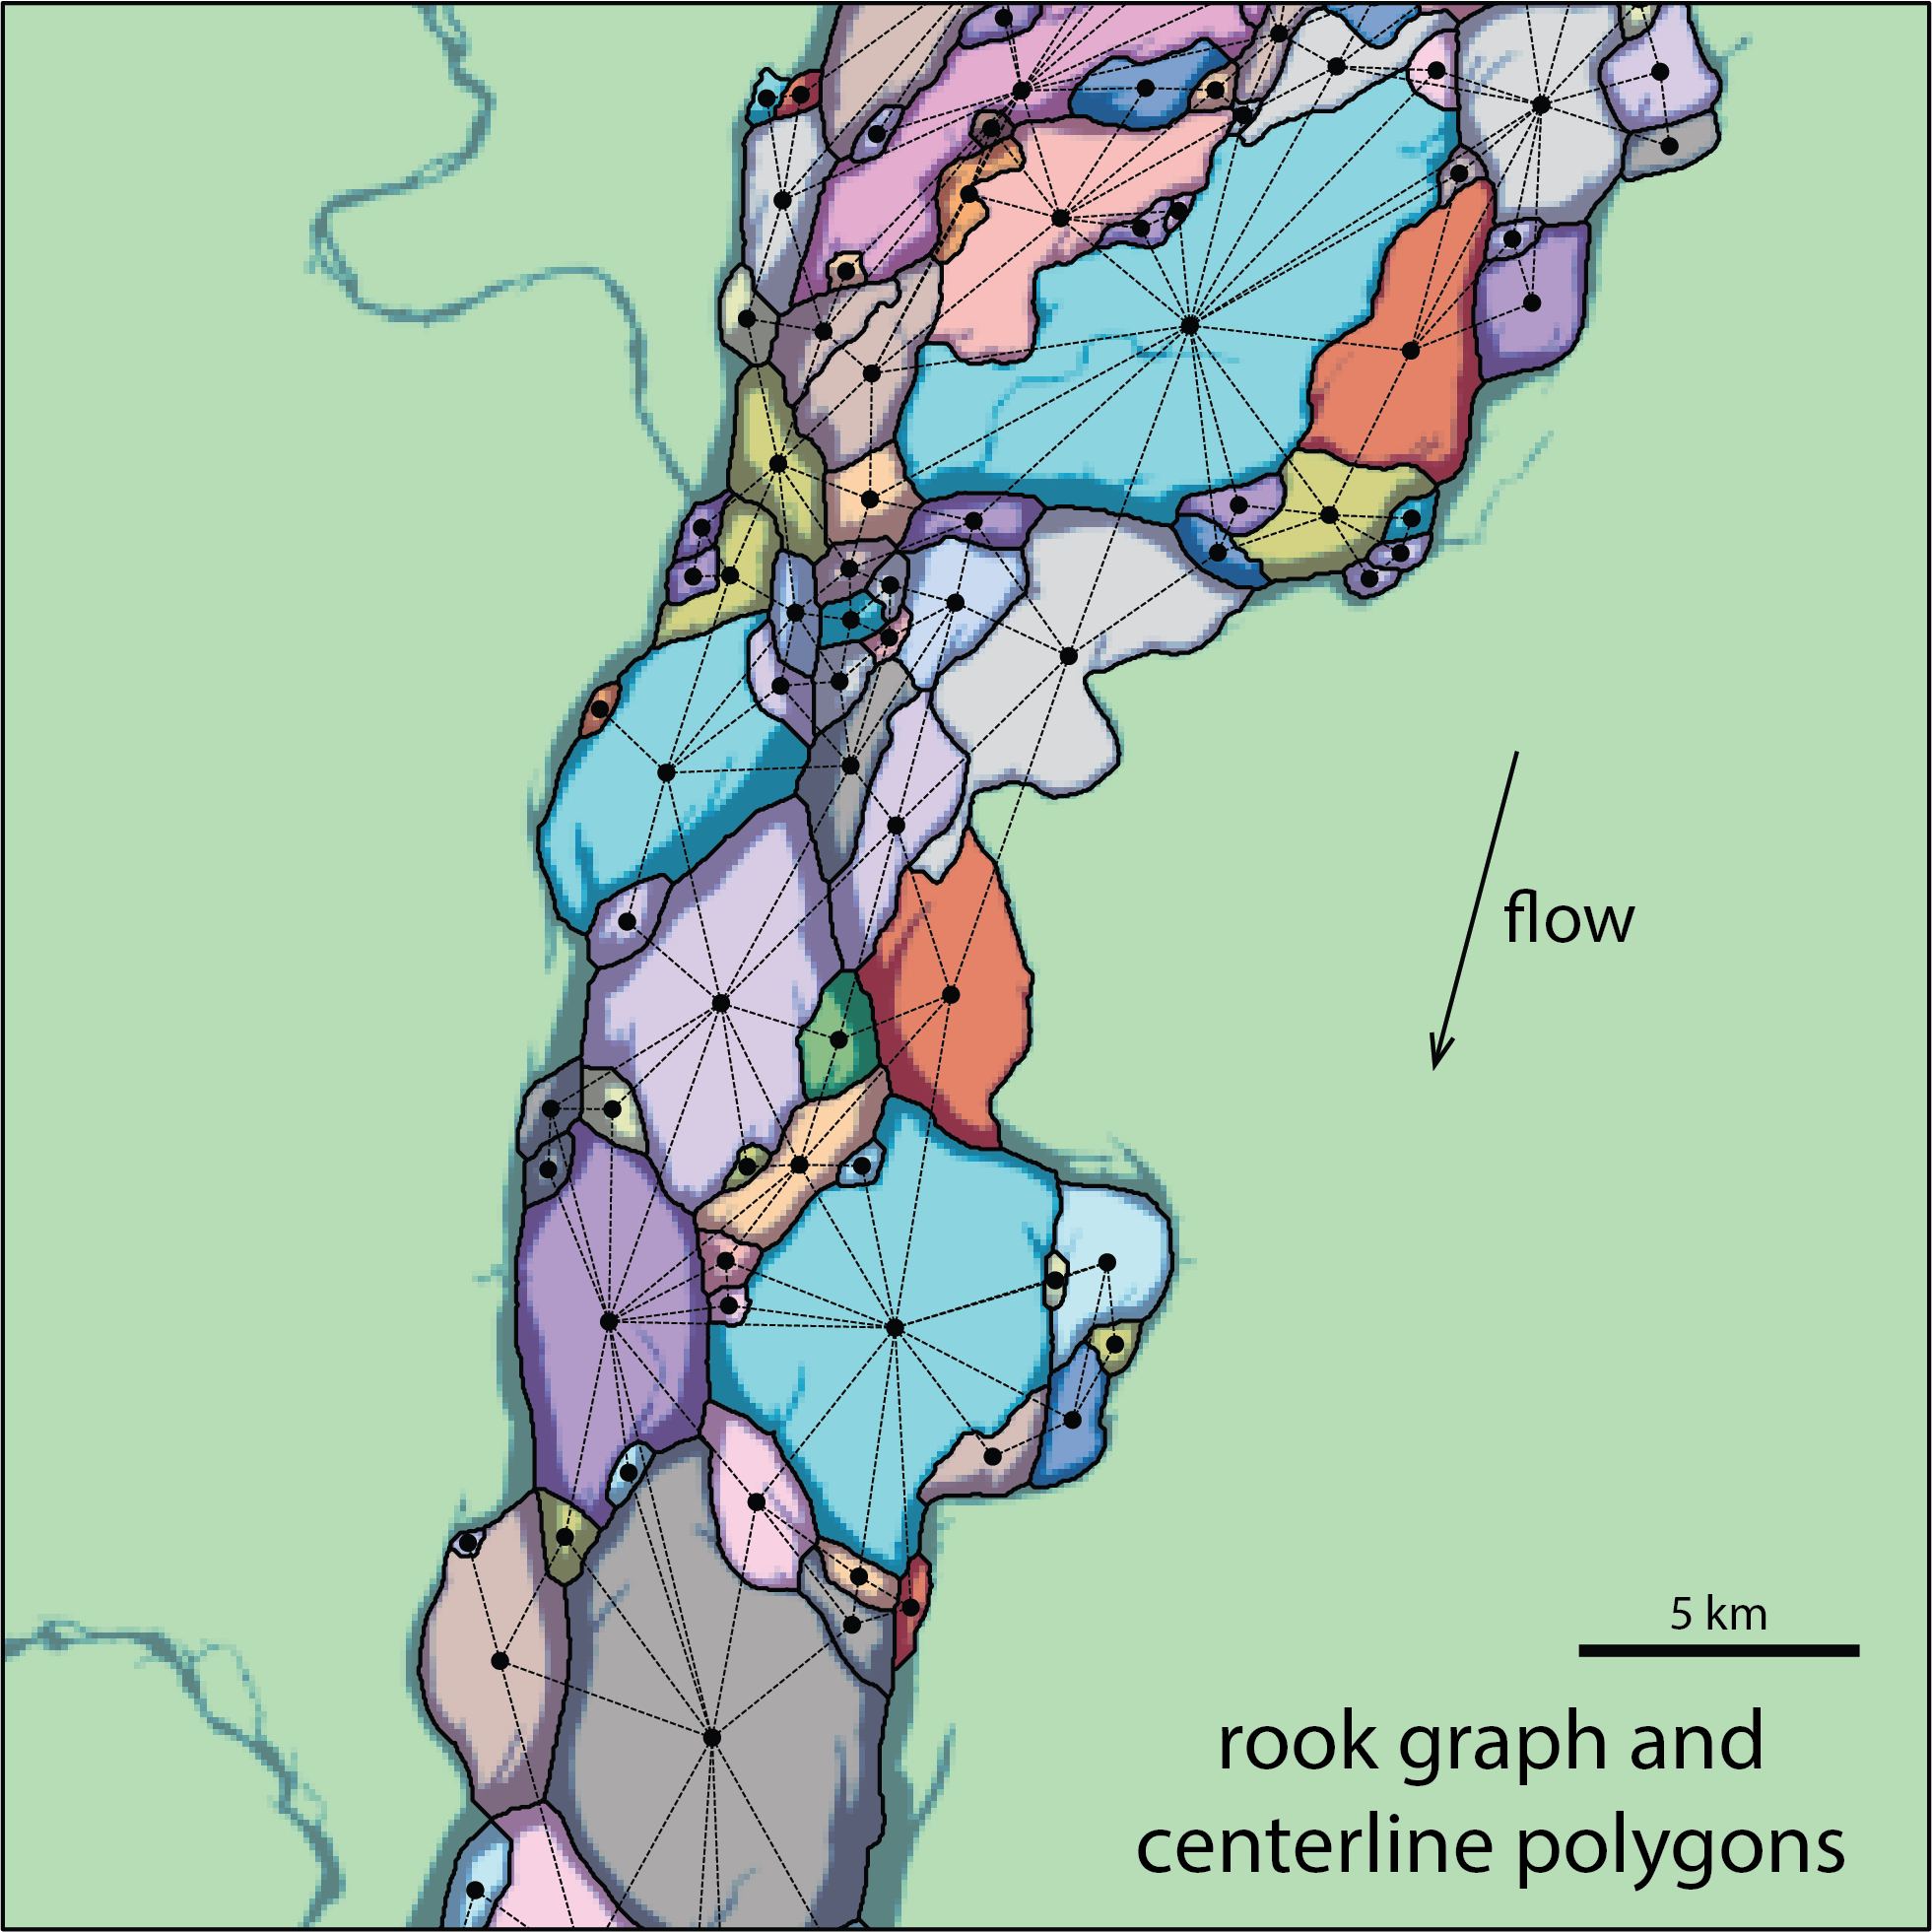
Rook graph and centerline polygons
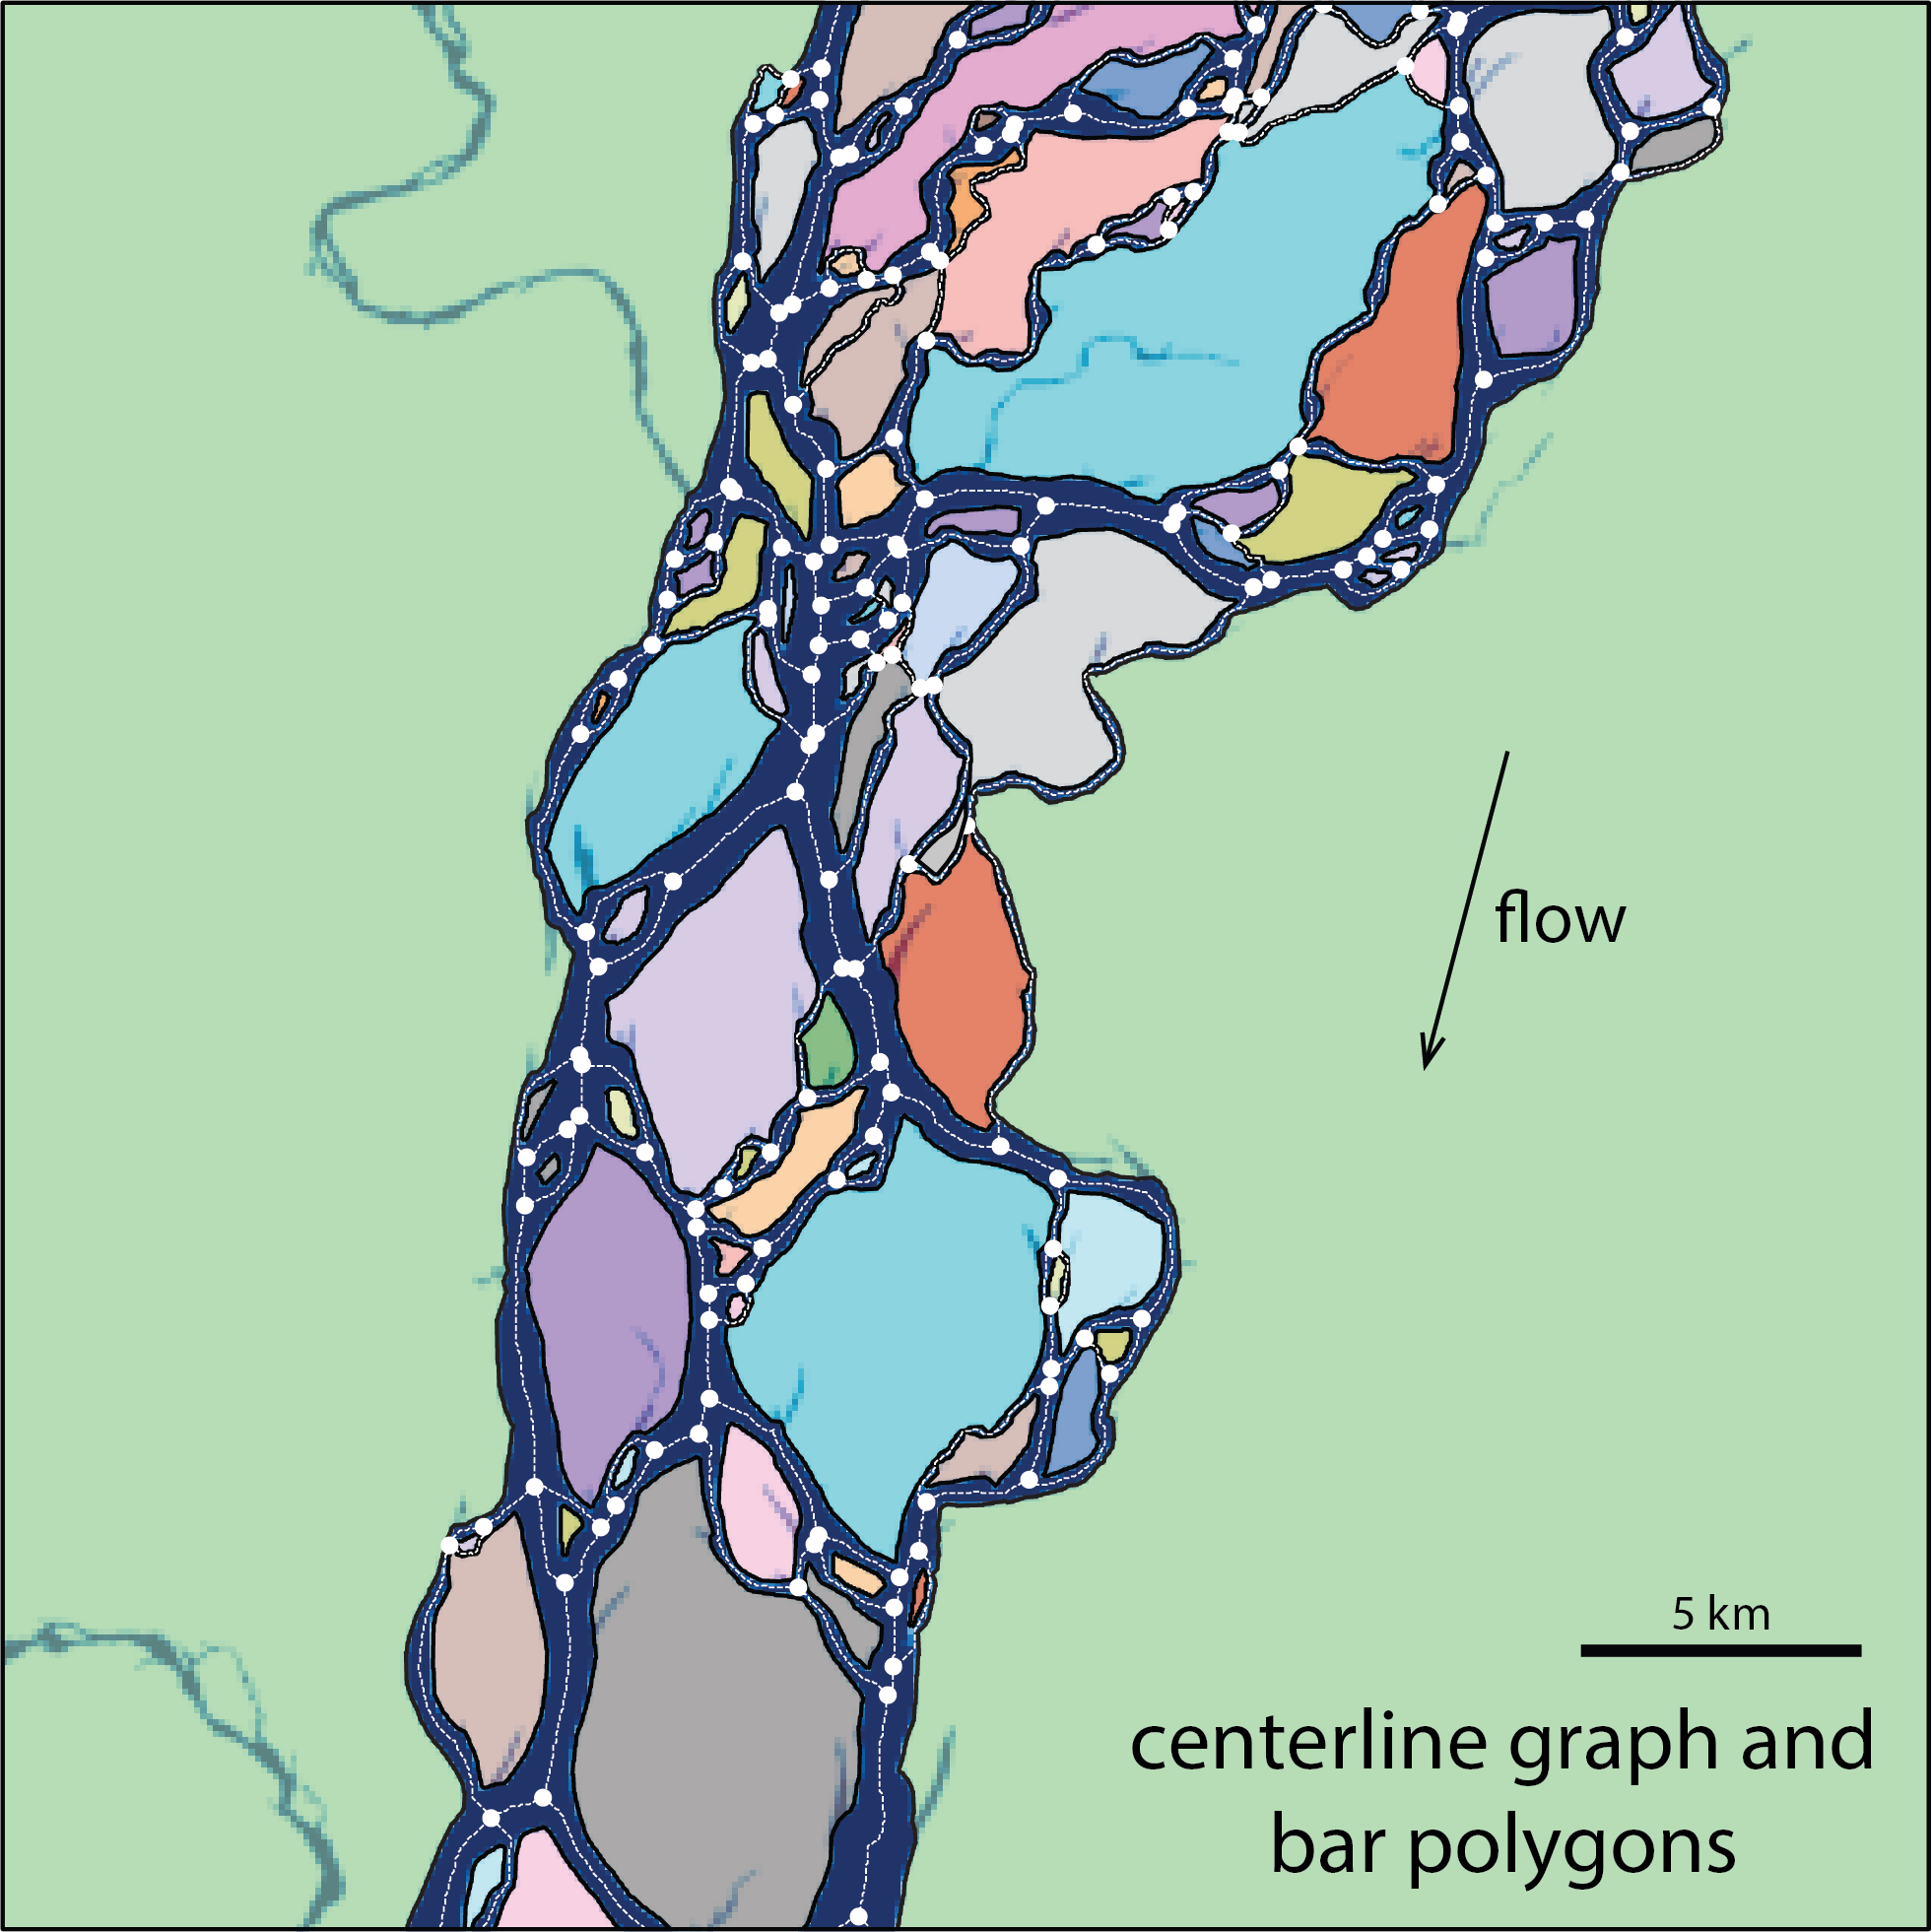
Centerline graph and bar polygons
Installation
You can install rivabar directly from PyPI:
pip install rivabar
Alternatively, you can install from source:
git clone https://github.com/zsylvester/rivabar.git
cd rivabar
pip install -e .
Getting started
rivabar now provides both an object-oriented API through the River class and the original functional API for backward compatibility.
Option 1: Object-Oriented API (Recommended)
The new River class provides a clean, intuitive interface:
import rivabar as rb

# Create a River object
river = rb.River(
    fname="LC08_L2SP_232060_20140219_20200911_02_T1_SR",
    dirname="../data/Branco/",
    file_type="multiple_tifs"
)

# Interactively select start and end points
river.get_start_end_points_interactive()

# Process the river to extract centerlines and banklines
river.map_river_banks(
    mndwi_threshold=0.0,
    ch_belt_smooth_factor=1e8,
    ch_belt_half_width=2000,
    remove_smaller_components=True,
    small_hole_threshold=64
)

# Access results through properties
centerlines = river.directed_graph
banklines = river.bankline_graph
mndwi_image = river.mndwi

# Analyze channel morphology
s, widths = river.get_channel_widths()  # along-channel distance and widths in meters
wavelength_analysis = river.analyze_wavelength_and_width()
stats = river.collect_stats()  # summary statistics dictionary

# Visualize results
river.plot_overview()

# Save results
river.save_results("my_river_analysis.pkl")
Option 2: Functional API
The functional interface remains fully supported. Its main entry point is map_river_banks; the original extract_centerline function is kept as a backward-compatible alias (same parameters, same return values).
Interactively Selecting Start/End Points
import rivabar as rb
import matplotlib.pyplot as plt

# Define input parameters
dirname = "../data/Branco/"  # Adjust path to your data
fname = "LC08_L2SP_232060_20140219_20200911_02_T1_SR" # Adjust filename/folder
file_type = "multiple_tifs" # or 'water_index' if the water mask already exists

# 1. Create the MNDWI water mask image
mndwi, left_utm_x, upper_utm_y, right_utm_x, lower_utm_y, delta_x, delta_y, dataset = rb.create_mndwi(
    dirname=dirname,
    fname=fname,
    file_type=file_type,
    mndwi_threshold=0.0, # Adjust threshold as needed
    small_hole_threshold=16,
    remove_smaller_components=True
)

# 2. Display the water mask
fig, ax = plt.subplots(figsize=(10, 10))
ax.imshow(mndwi, extent=[left_utm_x, right_utm_x, lower_utm_y, upper_utm_y], cmap='gray_r')
plt.title("Click START point, then END point")
plt.show() # Make sure the plot window appears

# 3. Get start and end points using ginput
# Click on the plot: first for the start point, then for the end point.
points = plt.ginput(n=2, timeout=-1) # timeout=-1 waits indefinitely

# Extract coordinates
start_x, start_y = points[0]
end_x, end_y = points[1]

# 4. Now you can use these coordinates in map_river_banks (see next section)
(Alternatively, the River class wraps this workflow in river.get_start_end_points_interactive().)
Centerline Extraction (Functional API)
import rivabar as rb

# Extract channel centerlines and banklines
# Define start and end points of the channel you want to extract (see previous section)
start_x, start_y = 675796.2, 98338.8 # UTM coordinates of the channel start
end_x, end_y = 628190.3, -91886.6 # UTM coordinates of the channel end
fname="LC08_L2SP_232060_20140219_20200911_02_T1_SR" # assumes that the Landsat bands are located in a folder with this name
dirname="../data/Branco/" # parent folder of the 'LC08...' folder

# Extract the channel centerline and related graphs
D_primal, G_rook, G_primal, mndwi, dataset, left_utm_x, right_utm_x, lower_utm_y, upper_utm_y, xs, ys = rb.map_river_banks(
    fname=fname,
    dirname=dirname,
    start_x=start_x,
    start_y=start_y,
    end_x=end_x,
    end_y=end_y,
    file_type='multiple_tifs',
    flip_outlier_edges=True,
    mndwi_threshold=0.0,
    ch_belt_smooth_factor=1e8,
    ch_belt_half_width=2000,
    remove_smaller_components=True,
    delete_pixels_polys=False,
    small_hole_threshold=64,
    solidity_filter=False,
    plot_D_primal=True
)

# Save the extracted centerlines and banklines as shapefiles
rb.save_shapefiles(
    dirname="output_directory",
    fname="output_prefix",
    G_rook=G_rook,
    dataset=dataset
)
rb.extract_centerline(...) accepts the same arguments and returns the same values, so older scripts keep working unchanged.
Analyzing Channel Widths and Morphology
Using the Object-Oriented API
# Create and process river (assuming you have a processed River object)
river = rb.River(
    fname="LC08_L2SP_232060_20140219_20200911_02_T1_SR",
    dirname="../data/Branco/",
    start_x=675796.2, start_y=98338.8,
    end_x=628190.3, end_y=-91886.6,
    file_type='multiple_tifs'
)

# Process the river
river.map_river_banks()

# Get channel widths along the main path
s, widths = river.get_channel_widths()

# Analyze width-wavelength relationships
wavelength_analysis = river.analyze_wavelength_and_width(
    delta_s=5,
    smoothing_factor=0.5*1e7,
    min_sinuosity=1.1,
    dx=30
)

# Plot results
river.plot_overview()

# Access individual components
centerlines = river.directed_graph
main_path = river.main_path
Using the Functional API
import matplotlib.pyplot as plt
import numpy as np

# The main path through the channel network is stored on the graph
# (assuming D_primal from the previous example)
edge_path = D_primal.graph['main_path']

# Analyze channel width - wavelength scaling
df, curv, s, loc_zero_curv, xsmooth, ysmooth = rb.analyze_width_and_wavelength(
    D_primal=D_primal,
    main_path=edge_path,
    ax=None,
    delta_s=5,
    smoothing_factor=0.5*1e7,
    min_sinuosity=1.1,
    dx=30
)

# Extract and plot channel widths along main path
xl, yl, w1l, w2l, w, s = rb.get_channel_widths_along_path(D_primal, D_primal.graph['main_path'])
plt.figure(figsize=(12, 4))
plt.plot(s, np.array(w)*30.0)
plt.xlabel('along-channel distance (m)')
plt.ylabel('channel width (m)')
plt.show()
Additional River Class Features
The River class provides many additional methods for advanced analysis:
# Batch processing multiple Landsat scenes (downloaded via Google Earth Engine)
rivers = rb.River.batch_process_landsat_scenes(
    path_number=232, row_number=60,
    start_x=675796.2, start_y=98338.8,
    end_x=628190.3, end_y=-91886.6,
    years=range(2020, 2024), max_cloud_cover=10, n_scenes_per_year=3
)

# Load and analyze saved results
river = rb.River.load_results("my_river_analysis.pkl")

# Get summary information
river.summary()

# Export to GeoDataFrames for further GIS analysis
gdfs = river.to_geopandas()

# Memory management for large datasets
river.clear_raster_data()  # Remove large raster data while keeping graphs
memory_usage = river.get_memory_usage()
For more examples and detailed usage, check out the example notebooks in the notebooks directory.
License
This project is licensed under the MIT License - see the LICENSE file for details.
Project details
Verified details
These details have been verified by PyPIProject links
GitHub Statistics
Maintainers


Download files
Download the file for your platform. If you're not sure which to choose, learn more about installing packages.
Source Distribution
Built Distribution
Filter files by name, interpreter, ABI, and platform.
If you're not sure about the file name format, learn more about wheel file names.
Copy a direct link to the current filters
File details
Details for the file rivabar-0.2.0.tar.gz.
File metadata
- Download URL: rivabar-0.2.0.tar.gz
- Upload date:
- Size: 167.3 kB
- Tags: Source
- Uploaded using Trusted Publishing? Yes
- Uploaded via: twine/6.1.0 CPython/3.13.12
File hashes
| Algorithm | Hash digest | |
|---|---|---|
| SHA256 |
c5b6da40e84ab8c94fa790229e1cde053412d0dfb351f563798d6de87f20081d
|
|
| MD5 |
545564d88c18d7aa4cb7eea2c852fecb
|
|
| BLAKE2b-256 |
a8621596e2242a9ecb2ccc80a690dc717e0204154b418b45f1a0028aee1f2b55
|
Provenance
The following attestation bundles were made for rivabar-0.2.0.tar.gz:
Publisher:
publish.yml on zsylvester/rivabar
-
Statement:
-
Statement type:
https://in-toto.io/Statement/v1 -
Predicate type:
https://docs.pypi.org/attestations/publish/v1 -
Subject name:
rivabar-0.2.0.tar.gz -
Subject digest:
c5b6da40e84ab8c94fa790229e1cde053412d0dfb351f563798d6de87f20081d - Sigstore transparency entry: 1804063641
- Sigstore integration time:
-
Permalink:
zsylvester/rivabar@3154c9f281836518758e66987eceb0066a97cff5 -
Branch / Tag:
refs/heads/main - Owner: https://github.com/zsylvester
-
Access:
public
-
Token Issuer:
https://token.actions.githubusercontent.com -
Runner Environment:
github-hosted -
Publication workflow:
publish.yml@3154c9f281836518758e66987eceb0066a97cff5 -
Trigger Event:
workflow_dispatch
-
Statement type:
File details
Details for the file rivabar-0.2.0-py3-none-any.whl.
File metadata
- Download URL: rivabar-0.2.0-py3-none-any.whl
- Upload date:
- Size: 160.8 kB
- Tags: Python 3
- Uploaded using Trusted Publishing? Yes
- Uploaded via: twine/6.1.0 CPython/3.13.12
File hashes
| Algorithm | Hash digest | |
|---|---|---|
| SHA256 |
2f5763f919b3d18400a18708b9ac1170ce3e50e4cc28ec17674422d3accbdba0
|
|
| MD5 |
08bdebc95bd417210af464f65f20f1a2
|
|
| BLAKE2b-256 |
8ee26955ab31d62f0158032d2af3d2ea40e847ba271e57e22bee9ee947401386
|
Provenance
The following attestation bundles were made for rivabar-0.2.0-py3-none-any.whl:
Publisher:
publish.yml on zsylvester/rivabar
-
Statement:
-
Statement type:
https://in-toto.io/Statement/v1 -
Predicate type:
https://docs.pypi.org/attestations/publish/v1 -
Subject name:
rivabar-0.2.0-py3-none-any.whl -
Subject digest:
2f5763f919b3d18400a18708b9ac1170ce3e50e4cc28ec17674422d3accbdba0 - Sigstore transparency entry: 1804063793
- Sigstore integration time:
-
Permalink:
zsylvester/rivabar@3154c9f281836518758e66987eceb0066a97cff5 -
Branch / Tag:
refs/heads/main - Owner: https://github.com/zsylvester
-
Access:
public
-
Token Issuer:
https://token.actions.githubusercontent.com -
Runner Environment:
github-hosted -
Publication workflow:
publish.yml@3154c9f281836518758e66987eceb0066a97cff5 -
Trigger Event:
workflow_dispatch
-
Statement type:


