RNAglib: Tools for learning on the structure of RNA using 2.5D geometric representations


Project description

rnaGlib: RNA Geometric Library

RNAglib is a Python package for studying RNA 2.5D and 3D structures. Functionality includes automated data loading, analysis,
visualization, ML model building and benchmarking.
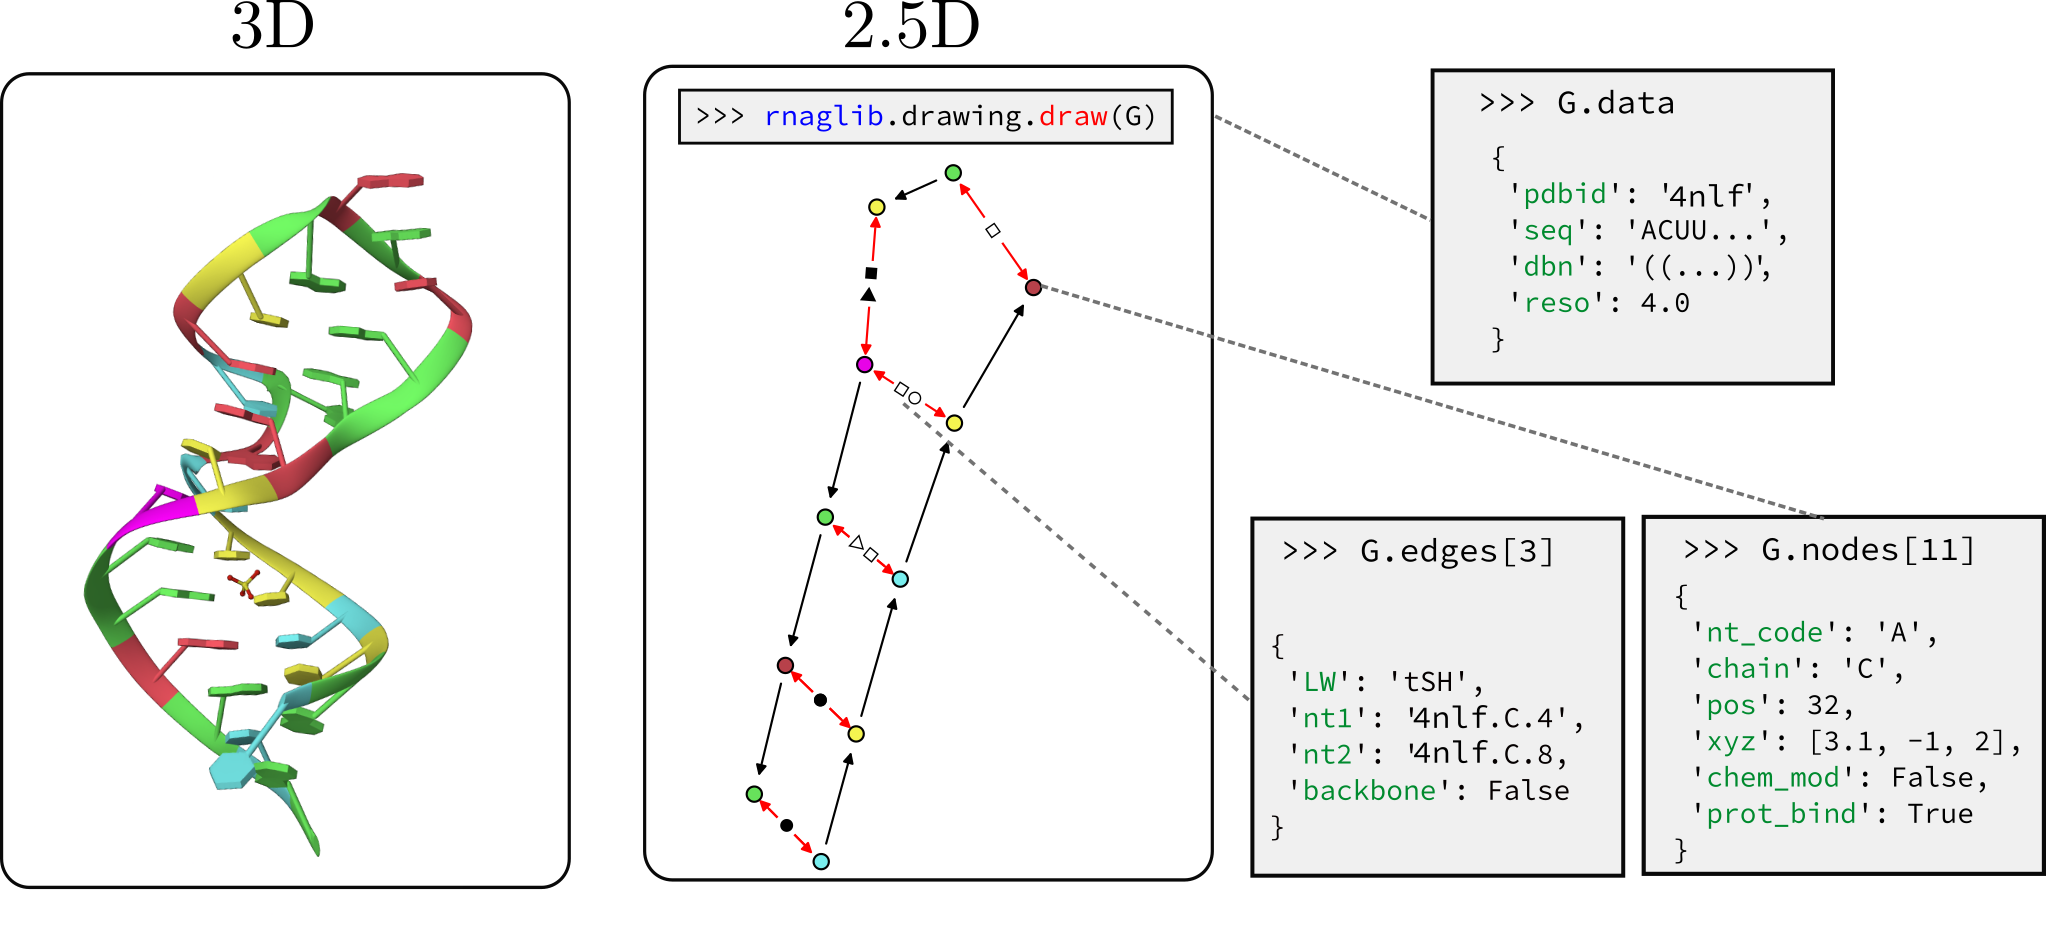
We host RNAs annotated with molecule, base pair, and nucleotide level attributes. These include, but are not limited to:
- Secondary structure (graph-level)
- Protein binding (node-level)
- Small molecule binding (node-level)
- Chemical modifications (node-level)
- 3-d coordinates(node-level)
- Leontis-westhof base pair geometry classification (edge-level)
We provide a visualization of what the graphs in this database contain.
A more detailed description of the data is presented in /RNAGlib/prepare_data/README.
Data stats
| Version | Date | Total RNAs | Total Non-Redundant | Non-redundant version | rnaglib commit |
|---|---|---|---|---|---|
| 0.0.1 | 15-02-23 | 5759 | 1176 | 3.269 | 5446ae2c |
| 0.0.0 | 20-07-21 | 3739 | 899 | 3.186 | eb25dabd |
Package Structure
/RNAGlib/prepare_data/: processes raw PDB structures and builds a database of 2.5D graphs with full structural annotation/RNAGlib/data_loading: custom PyTorch dataloader implementations/RNAGlib/models: pre-built GCN models./RNAGlib/learning: learning routines for the easiest use of the package./RNAGlib/drawing: utilities for visualizing 2.5D graphs/RNAGlib/ged: custom graph similarity functions/RNAGlib/kernels: custom local neighbourhood similarity functions
Installation
The package can be cloned and the source code used directly. We also deploy it as a pip package and recommend using this install in conda environments.
If one wants to use GPU support, one should install Pytorch and DGL with the appropriate options. Otherwise you can just skip this step and the pip installs of Pytorch and DGL will be used.
Then, one just needs to run :
pip install rnaglib
Then one can start using the packages functionalities by importing them in one's python script.
Data
To perform machine learning one needs RNA data. We provide a way of obtaining a 2.5D graph from a local PDB file
(see below). The instructions to produce the data for all RNA are presented in :doc:rnaglib.prepare_data.
However since this construction is computationally expensive at database scale, we offer pre-built databases.
We however offer three possibilities to directly access pre-built databases :
- A download script ships with the install, run :
$ rnaglib_download -h - Direct download at the address : http://rnaglib.cs.mcgill.ca/static/datasets/iguana.tar.gz
- Dynamic download : if one instantiates a dataloader and the data cannot be found, the corresponding data will be automatically downloaded and cached
Because of this last option, after installing our tool with pip, one can start learning on RNA data without extra steps.
Once the graphs are downloaded we can begin to inspect and visualize the data. Graphs can be fetched directly using
their PDBID. Since nodes represent nucleotides, the node data dictionary will include features such as nucleotide type,
position, 3D coordinates, etc. Nodes are assigned an ID in the form <pdbid.chain.position>. Using node IDs we can
access node and edge attributes as dictionary keys.
>>> from rnaglib.utils.graph_io import graph_from_pdbid
>>> G = graph_from_pdbid("4nlf")
>>> G.nodes['4nlf.A.2647']
{'index': 1, 'index_chain': 1, 'chain_name': 'A', 'nt_resnum': 2647, 'nt_name': 'U', 'nt_code': 'U',
 'nt_id': 'A.U2647', 'nt_type': 'RNA', 'dbn': '.',
 'summary': "anti,~C2'-endo,non-stack,non-pair-contact,ss-non-loop,splayed-apart",
 'alpha': None, 'beta': None, 'gamma': 48.553, 'delta': 145.549, 'epsilon': -136.82, 'zeta': 106.418,
 'epsilon_zeta': 116.762, 'bb_type': '--', 'chi': -137.612, 'glyco_bond': 'anti',
 'C5prime_xyz': [-1.821, 8.755, -0.245], 'P_xyz': [None, None, None], 'form': '.', 'ssZp': 1.669,
 'Dp': 1.751, 'splay_angle': 88.977, 'splay_distance': 13.033, 'splay_ratio': 0.702, 'eta': None,
 'theta': None, 'eta_prime': None, 'theta_prime': None, 'eta_base': None, 'theta_base': None,
 'v0': -21.744, 'v1': 36.502, 'v2': -36.488, 'v3': 24.597, 'v4': -2.014, 'amplitude': 37.908,
 'phase_angle': 164.267, 'puckering': "C2'-endo", 'sugar_class': "~C2'-endo", 'bin': 'inc',
 'cluster': '__', 'suiteness': 0.0, 'filter_rmsd': 0.1,
 'frame': {'rmsd': 0.007, 'origin': [24.09, 9.076, -5.96], 'x_axis': [0.09, 0.563, -0.822],
   'y_axis': [-0.848, -0.389, -0.359], 'z_axis': [-0.522, 0.729, 0.443], 'quaternion': [0.535, -0.509, 0.14, 0.66]},
 'sse': {'sse': None}, 'binding_protein': None, 'binding_ion': None, 'binding_small-molecule': None}
Building a 2.5D Graph from a local PDB
If you have an mmCIF containing RNA stored locally and you wish to build a 2.5D graph that can be used in RNAglib you
can use the prepare_data module. To do so, you need to have x3dna-dssr executable in your $PATH which
requires a license <http://x3dna.org>_.
>>> from rnaglib.prepare_data import cif_to_graph
>>> pdb_path = '../data/1aju.cif'
>>> graph_nx = cif_to_graph(pdb_path, return_graph=True)
This will return a networkx Graph object containing all the annotation data shown above.
Visualization
To visualize the 2.5D graphs in the format described above, we have implemented a drawing toolbox with several
functions. The easiest way to use it in your application is to call rnaglib.drawing.draw(graph, show=True).
A functioning installation of Latex is needed for correct plotting of the graphs. If no installation is detected,
the graphs will be plotted using the LaTex reduced features that ships with matplotlib.
>>> from rnaglib.drawing.rna_draw import rna_draw
>>> rna_draw(graph_nx, show=True)
Graph Edit Distance (GED)
GED is the gold standard of graph comparisons. We have put our ged implementation as a part of networkx, and offer in
rnaglib/ged the weighting scheme we propose to compare 2.5D graphs. One can call rnaglib.ged.ged() on two graphs to
compare them. However, due to the exponential complexity of the comparison, the maximum size of the graphs should be
around ten nodes, making it more suited for comparing graphlets or subgraphs.
>>> from rnaglib.ged.ged_nx import graph_edit_distance
>>> from rnaglib.utils.graph_io import graph_from_pdbid
>>> G = graph_from_pdbid("4nlf")
>>> graph_edit_distance(G, G)
0.0
Building Machine Learning Models
Finally we come to the end goal of this package : performing machine learning on RNA data represented as 2.5D graphs.
To provide the user with a hands on tutorial, we offer two example learning pipelines in :doc:rnaglib.examples.
If one has run the pip installation, just run :
    $ rnaglib_first
    $ rnaglib_second
You should see data getting downloaded and networks being trained. The first example is a basic supervised model training to predict protein binding nucleotides. The second one starts by an unsupervised phase that pretrains the network and then performs this supervised training in a principled way, suitable for benchmarking its performance. This simple code was used to produce the benchmark values presented in the paper.
Associated Repositories:
References
- Leontis, N. B., & Zirbel, C. L. (2012). Nonredundant 3D Structure Datasets for RNA Knowledge Extraction and Benchmarking. In RNA 3D Structure Analysis and Prediction N. Leontis & E. Westhof (Eds.), (Vol. 27, pp. 281–298). Springer Berlin Heidelberg. doi:10.1007/978-3-642-25740-7_13
Release history Release notifications | RSS feed


Download files
Download the file for your platform. If you're not sure which to choose, learn more about installing packages.
Source Distribution
Built Distribution
Filter files by name, interpreter, ABI, and platform.
If you're not sure about the file name format, learn more about wheel file names.
Copy a direct link to the current filters
File details
Details for the file rnaglib-2.0.0.tar.gz.
File metadata
- Download URL: rnaglib-2.0.0.tar.gz
- Upload date:
- Size: 126.8 kB
- Tags: Source
- Uploaded using Trusted Publishing? No
- Uploaded via: twine/3.7.1 importlib_metadata/4.11.3 pkginfo/1.8.3 requests/2.28.1 requests-toolbelt/0.9.1 tqdm/4.64.1 CPython/3.8.13
File hashes
| Algorithm | Hash digest | |
|---|---|---|
| SHA256 |
a3edf1c88e984f580d5f73535ce2f47895de352ba190b9f65fa2d7df0c16d56a
|
|
| MD5 |
99192c55d3316a24b0585c547a8728ae
|
|
| BLAKE2b-256 |
5fe95fc4a056a08b619c3ee40c387a391b06091476574ba7d90c3c1b8a5177db
|
File details
Details for the file rnaglib-2.0.0-py3-none-any.whl.
File metadata
- Download URL: rnaglib-2.0.0-py3-none-any.whl
- Upload date:
- Size: 167.9 kB
- Tags: Python 3
- Uploaded using Trusted Publishing? No
- Uploaded via: twine/3.7.1 importlib_metadata/4.11.3 pkginfo/1.8.3 requests/2.28.1 requests-toolbelt/0.9.1 tqdm/4.64.1 CPython/3.8.13
File hashes
| Algorithm | Hash digest | |
|---|---|---|
| SHA256 |
b7aa87bbd2dafd33577f5bc8a0d093cfe23a4fd0463dfe94e3f681c73169ac40
|
|
| MD5 |
54ebe5d0e3f7e860404e8c31b767e461
|
|
| BLAKE2b-256 |
90b3853f199e5fde9eaec168e992020a1bce30d3a06e62115481f98b8fdcbcd9
|


