A package to fit models to recognition memory ROC data and compute signal detection measures.

This project has been archived.
The maintainers of this project have marked this project as archived. No new releases are expected.
Project description
ROC Face
[!WARNING] This project is now archived. See Kriterion instead, which is the successor.
This is a Python package to compute basic signal detection theory measures and to fit theoretical recognition memory models to data using ROC curves.
Currently-supported models are those most frequently seen in the literature:
- High Threshold
- Equal-Variance Signal Detection
- Unequal-Variance Signal Detection
- Dual-Process Signal Detection
These models are fit to observed data by minimising the $G$, $\chi^2$, log-likelihood, or sum of squared error statistics between observed and model-predicted data.
Setting Up
Install with pip:
$ pip install roc-face
It is generally recommend to use a virtual environment when installing python packages (see here).
Usage
Example 1: Basic signal detection theory measures
With a single true positive and false positive rate, compute the common measures of sensitivity and bias:
>>> from roc_face import measures

>>> measures.d_prime(0.75, 0.21)
1.480910997214322

>>> measures.c_bias(0.75, 0.21)
0.06596574841107933
You can also return a dictionary of measures in a similar way:
>>> measures.compute_performance(tpr=0.75, fpr=0.21)
{
    'FPR': 0.21,
    'TPR': 0.75,
    'dprime': 1.480910997214322,
    'cbias': 0.06596574841107933,
    'aprime': 0.850886075949367,
    'beta': 1.1026202605581668,
}
Example 2: Receiver operating characteristic (ROC) modelling
Given a set of responses to a set of signal and noise trials, the ROC and z-ROC plots of the observed frequencies can be viewed as follows.
>>> import matplotlib.pyplot as plt
>>> from roc_face import utils

# Strongest "signal" <---> Strongest "noise"
# All responses to signal-present trials
>>> signal = [505,248,226,172,144,93]

# All responses to signal-absent (i.e. noise) trials
>>> noise = [115,185,304,523,551,397]

>>> fig, ax = plt.subplots(1, 2)
>>> utils.plot_roc(signal, noise, ax=ax[0])
>>> utils.plot_zroc(signal, noise, poly=1, ax=ax[1])
>>> ax[1].legend()
>>> plt.show()
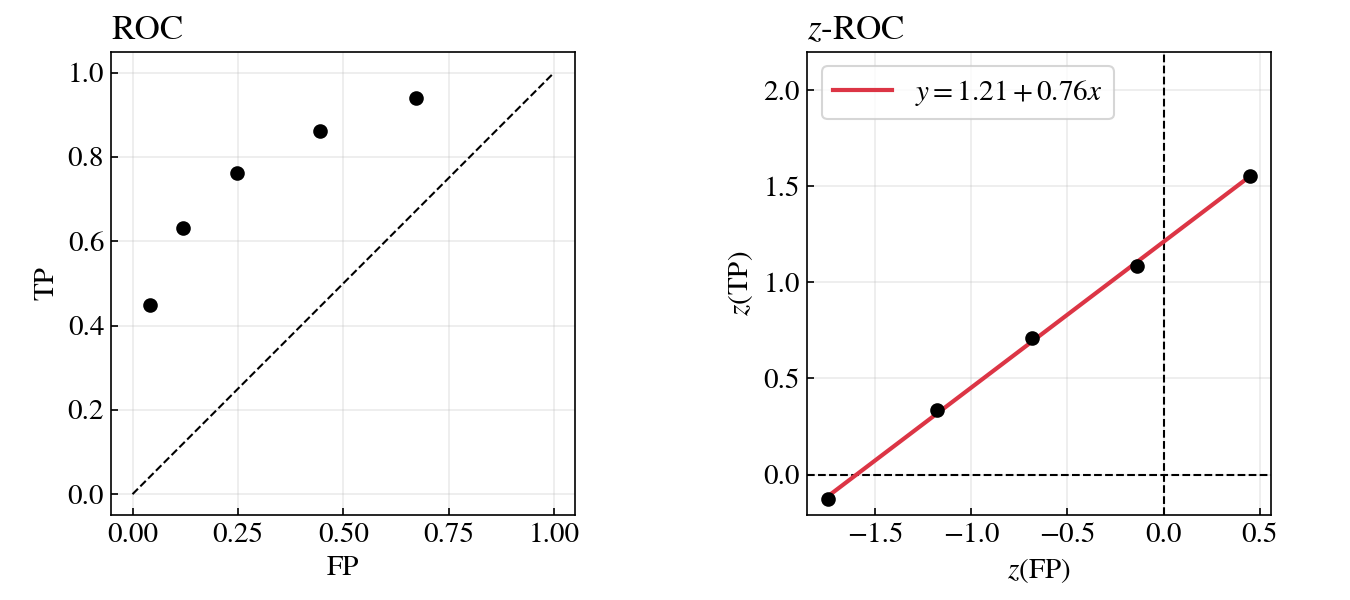
The utils.plot_roc and utils.plot_zroc functions are for convenience as
they carry out some minor plotting customisations (square axes, chance-line,
etc). The fitted line on the z-ROC in this example is a simple linear model,
which is useful for interpreting the ROC data.
With the signal and noise data, the different models can be fitted.
>>> from roc_face.models import SignalDetection

# Create an equal- and unequal-variance signal detection models
>>> evsd = SignalDetection(signal, noise)
>>> uvsd = SignalDetection(signal, noise, equal_variance=False)
After creation, the models are fit as follows:
# Fit the models using the G-test fit function
>>> evsd.fit(verbose=True)
(
    {
        'model': 'Equal Variance Signal Detection',
        'success': True,
        'method': 'G',
        'statistic': 86.65649645461215,
        'log_likelihood': -13560.04271197083,
        'AIC': 27132.08542394166,
        'BIC': 27171.729820697474,
        'SSE': 0.0038210383584672968
    },
    {
        'd': 1.3706692903039621,
        'criteria': array([ 0.87497843,  0.40584089, -0.01393461, -0.48919362, -1.0589949 ])
    }
)
Using verbose=True in the fit method prints out the results of the fitting procedure when it ends, along with the parameter estimates. After calling fit, they can also be accessed via .results and .parameter_estimates:
>>> uvsd.fit()
>>> uvsd.results
{
    'model': 'Unequal Variance Signal Detection',
    'success': True,
    'method': 'G',
    'statistic': 0.9957013337195149,
    'log_likelihood': -13517.212314410383,
    'AIC': 27048.424628820765,
    'BIC': 27094.676425035883,
    'SSE': 0.00014501577579512347
}
>>> uvsd.parameter_estimates
{
    'd': 1.6023922394537697,
    'scale': 1.32284210876227,
    'criteria': array([ 0.95984187,  0.36806527, -0.12572417, -0.65421799, -1.2496735 ])
}
These models can also be compared to one another. Although it is common practice to compare with the AIC or BIC values (see the results), it can also be done with the .compare method:
>>> evsd.compare(uvsd)
('G(EVSD - UVSD)', 85.66079512089179, 1, 2.1360619666273588e-20)
This shows that the UVSD provides a significantly better fit than the EVSD.
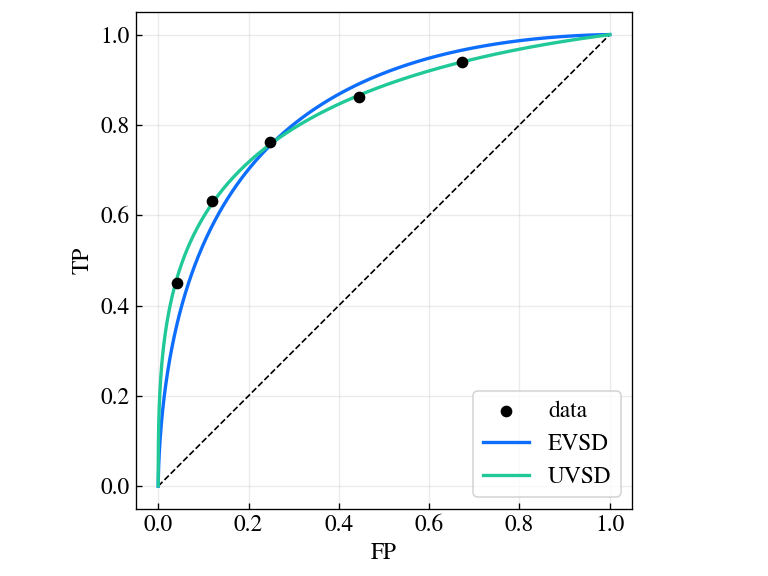
Finally, we can just view the ROC data and the two fitted models as follows:
>>> fig, ax = plt.subplots(dpi=120)
>>> utils.plot_roc(signal, noise, c='k', ax=ax, label='data')
>>> ax.plot(*evsd.curve, label='EVSD')
>>> ax.plot(*uvsd.curve, label='UVSD')
>>> ax.legend(loc='lower right')
>>> plt.show()
Release history Release notifications | RSS feed


Download files
Download the file for your platform. If you're not sure which to choose, learn more about installing packages.
Source Distribution
Built Distribution
Filter files by name, interpreter, ABI, and platform.
If you're not sure about the file name format, learn more about wheel file names.
Copy a direct link to the current filters
File details
Details for the file roc_face-0.1.2.tar.gz.
File metadata
- Download URL: roc_face-0.1.2.tar.gz
- Upload date:
- Size: 33.2 kB
- Tags: Source
- Uploaded using Trusted Publishing? No
- Uploaded via: twine/6.1.0 CPython/3.13.12
File hashes
| Algorithm | Hash digest | |
|---|---|---|
| SHA256 |
db86b3dc8273526872bf3bf987a00ca5520334286a584892a78fdc72183c5be0
|
|
| MD5 |
138d998eb8af9e046a81c707ea720bc4
|
|
| BLAKE2b-256 |
9f04bbc896586c10c509928453590f913ac7c6f700fcf5149b4548521a7ec742
|
File details
Details for the file roc_face-0.1.2-py3-none-any.whl.
File metadata
- Download URL: roc_face-0.1.2-py3-none-any.whl
- Upload date:
- Size: 31.9 kB
- Tags: Python 3
- Uploaded using Trusted Publishing? No
- Uploaded via: twine/6.1.0 CPython/3.13.12
File hashes
| Algorithm | Hash digest | |
|---|---|---|
| SHA256 |
8a59c31188dc11391d7388785df5009a852eb034a49dd783af0e234cd3807a29
|
|
| MD5 |
fd63dd7eac31d4f204b32553d3365f35
|
|
| BLAKE2b-256 |
9017d1253a04d47be52a2517502226bba2376f548f0da2836f1ea52a2c0d06f5
|


