Generate mermaid description of ROS2 graphs to add on your markdown files.


Project description
ros2_graph
Generate mermaid description of ROS2 graphs to add on your markdown files.
Motivation
In order to have better architecture documentation, graphs of nodes and topics are needed. Nonetheless, nobody wants to maintain these graphs and even do it from scratch. Because of that, a tool that does it automatedly is required. The first alternative is rqt-graph but it does not include services/actions information and adds some non-required information when we filter by a node. Normally the workflow includes connecting to a terminal where the ros system is running, launching the rqt-graph, saving the resulting image, and uploading it to the cloud to include it in the documentation.
To make our life easier and to generate graphs that include all the information that we want this tool was created
Installation
You need to have already installed ROS2 (tested on humble distro).
pip install ros2-graph
To be able to export the diagram as an image install npm and mermaid-cli on your computer
curl -sL https://deb.nodesource.com/setup_16.x | sudo -E bash -
sudo apt install nodejs
npm install -g @mermaid-js/mermaid-cli
How it works
Suppose you want to generate a graph that shows how a node it's relates to other nodes by topics, services, and actions. All you need to do is run the script:
ros2_graph your_node
This will print in the console a graph description in the mermaid language, then you have to copy and paste it on the node's readme and enjoy. But if you want export it to a file use the -o flag.
Example
ros2_graph /turtlesim -o turtle_diagram.md
You can also export the diagram as an image (png, svg or pdf) by setting the right file extension or using the flag --outputFormat:
ros2_graph /turtlesim -o turtle_diagram.png
ros2_graph /turtlesim -o turtle_diagram --outputFormat png
Note: you must copy everything between ```mermaid and ``` including both marks.
GitHub can display mermaid graphs. You can also display it on VS code by adding an extension in the devcontainer.json: "bierner.markdown-mermaid"
But what about nodes highly correlated as the range sensors, it does not make sense to have a graph for each node, Well don't worry you can include all the nodes that you want:
ros2_graph node_1 node_2 … node_n
Example:
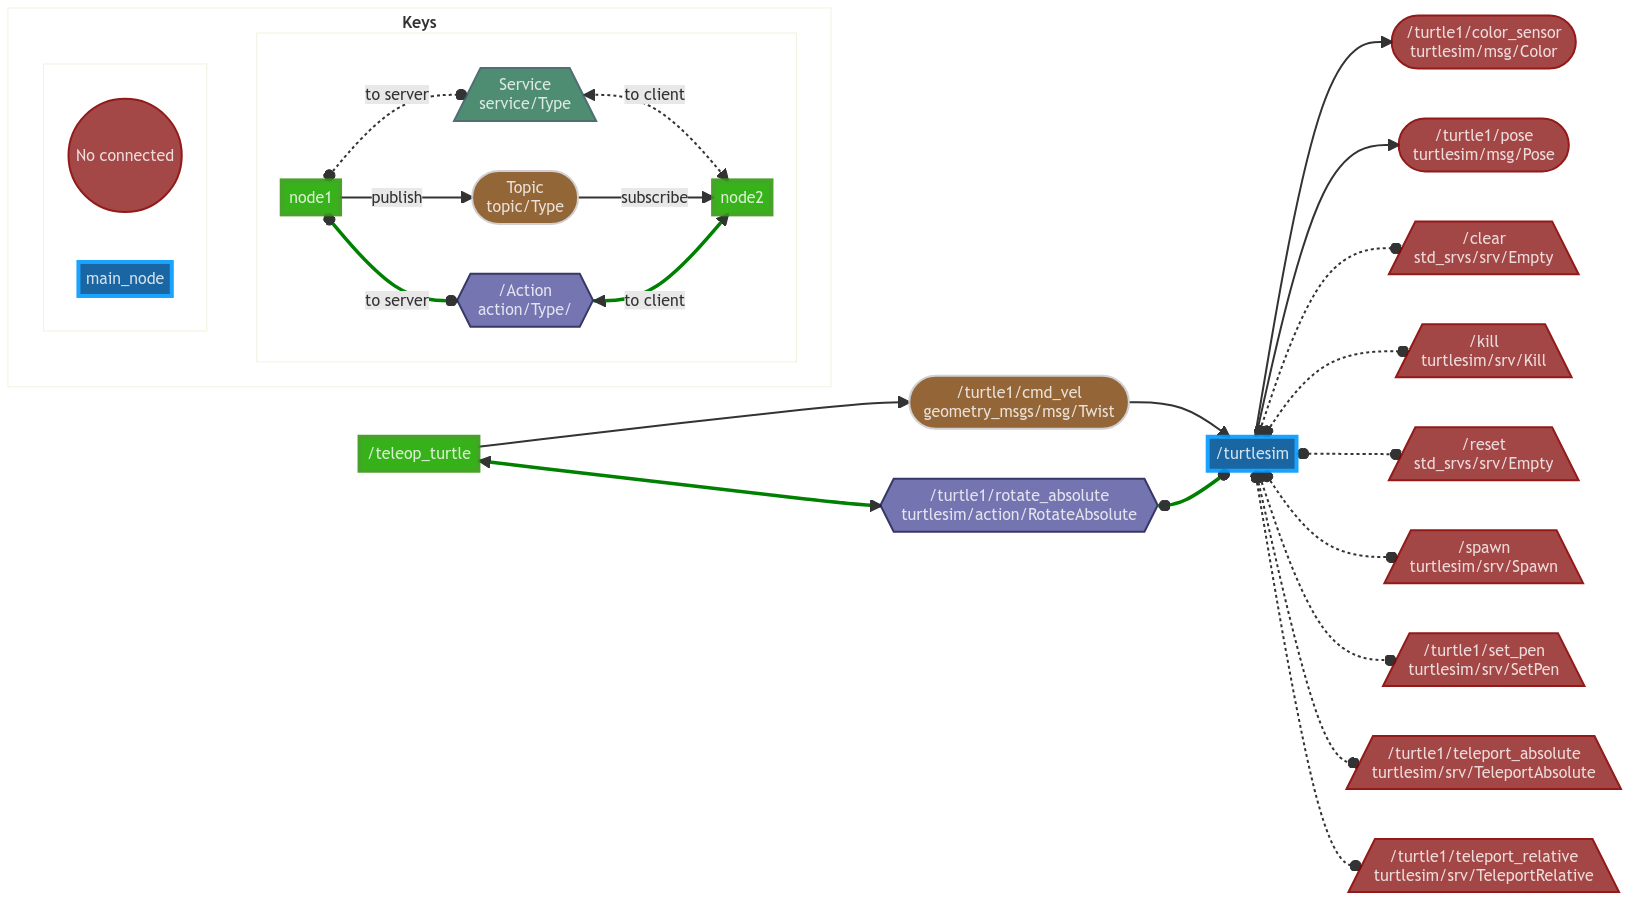
ros2_graph /turtlesim /teleop_turtle
See an example graph:
flowchart LR

/turtlesim:::main
/teleop_turtle:::node
/turtle1cmd_vel([/turtle1cmd_vel<br>geometry_msgs/msg/Twist]):::topic
/turtle1color_sensor([/turtle1color_sensor<br>turtlesim/msg/Color]):::bugged
/turtle1pose([/turtle1pose<br>turtlesim/msg/Pose]):::bugged
/clear[//clear<br>std_srvs/srv/Empty\]:::bugged
/kill[//kill<br>turtlesim/srv/Kill\]:::bugged
/reset[//reset<br>std_srvs/srv/Empty\]:::bugged
/spawn[//spawn<br>turtlesim/srv/Spawn\]:::bugged
/turtle1set_pen[//turtle1set_pen<br>turtlesim/srv/SetPen\]:::bugged
/turtle1teleport_absolute[//turtle1teleport_absolute<br>turtlesim/srv/TeleportAbsolute\]:::bugged
/turtle1teleport_relative[//turtle1teleport_relative<br>turtlesim/srv/TeleportRelative\]:::bugged
/turtle1/rotate_absolute{{/turtle1/rotate_absolute<br>turtlesim/action/RotateAbsolute}}:::action
/clear o-.-o /turtlesim
/kill o-.-o /turtlesim
/reset o-.-o /turtlesim
/spawn o-.-o /turtlesim
/turtle1set_pen o-.-o /turtlesim
/turtle1teleport_absolute o-.-o /turtlesim
/turtle1teleport_relative o-.-o /turtlesim
/teleop_turtle <==> /turtle1/rotate_absolute
/turtle1/rotate_absolute o==o /turtlesim
/turtle1cmd_vel --> /turtlesim
/turtlesim --> /turtle1color_sensor
/turtlesim --> /turtle1pose
/teleop_turtle --> /turtle1cmd_vel
subgraph keys[<b>Keys<b/>]
subgraph nodes[<b><b/>]
topicb((No connected)):::bugged
main_node:::main_node
end
subgraph connection[<b><b/>]
node1:::node
node2:::node
node1 o-. to server .-o service[/Service<br>service/Type\]:::service
service <-. to client .-> node2
node1 -- publish --> topic([Topic<br>topic/Type]):::topic
topic -- subscribe --> node2
node1 o== to server ==o action{{/Action<br>action/Type/}}:::action
action <== to client ==> node2
end
end
classDef node opacity:0.9,fill:#2A0,stroke:#391,stroke-width:4px,color:#fff
classDef action opacity:0.9,fill:#66A,stroke:#225,stroke-width:2px,color:#fff
classDef service opacity:0.9,fill:#3B8062,stroke:#3B6062,stroke-width:2px,color:#fff
classDef topic opacity:0.9,fill:#852,stroke:#CCC,stroke-width:2px,color:#fff
classDef main opacity:0.9,fill:#059,stroke:#09F,stroke-width:4px,color:#fff
classDef bugged opacity:0.9,fill:#933,stroke:#800,stroke-width:2px,color:#fff
style keys opacity:0.15,fill:#FFF
style nodes opacity:0.15,fill:#FFF
style connection opacity:0.15,fill:#FFF
Custom syle
For custom mermaid styles use the --styleConfig flag to load a style .yaml file, it must look like this (Example with the default values, if a field is not defined the default will be used):
shapes:
  main: ["[", "]"]
  node: ["[", "]"]
  topic: ["([", "])"]
  service: ["[/", "\\]"]
  action: ["{{", "}}"]
colors:
    main: "opacity:0.9,fill:#059,stroke:#09F,stroke-width:4px,color:#fff"
    node: "opacity:0.9,fill:#2A0,stroke:#391,stroke-width:4px,color:#fff"
    topic: "opacity:0.9,fill:#852,stroke:#CCC,stroke-width:2px,color:#fff"
    service: "opacity:0.9,fill:#3B8062,stroke:#3B6062,stroke-width:2px,color:#fff"
    action: "opacity:0.9,fill:#66A,stroke:#225,stroke-width:2px,color:#fff"
    no_conected: "opacity:0.9,fill:#933,stroke:#800,stroke-width:2px,color:#fff"
links_display:
  topics_publisher: "-->"
  topics_subscriber: "-->"
  services_server: "o-.-o"
  services_client: "<-.->"
  action_server: "o==o"
  action_client: "<==>"
links_style:
  topics_publisher:
  topics_subscriber:
  services_server:
  services_client:
  action_server: fill:none,stroke:green;
  action_client: fill:none,stroke:green;
display_keys: True
ignore:
  nodes:
    - "/Graph_generator"
  topics:
  services:
  actions:
Use the ignore field to don not include some node, topic, service or action in your graph, regular expressions are supported.
Release history Release notifications | RSS feed


Download files
Download the file for your platform. If you're not sure which to choose, learn more about installing packages.
Source Distribution
Built Distribution
Filter files by name, interpreter, ABI, and platform.
If you're not sure about the file name format, learn more about wheel file names.
Copy a direct link to the current filters
File details
Details for the file ros2_graph-0.0.5.tar.gz.
File metadata
- Download URL: ros2_graph-0.0.5.tar.gz
- Upload date:
- Size: 25.9 kB
- Tags: Source
- Uploaded using Trusted Publishing? No
- Uploaded via: twine/4.0.2 CPython/3.8.10
File hashes
| Algorithm | Hash digest | |
|---|---|---|
| SHA256 |
088e4f82bab6e3ae7266d69a04dc5b62172d4534fd96e6c4f889d08d20d55c66
|
|
| MD5 |
26a88da2ca4ff1ff19b5549549257258
|
|
| BLAKE2b-256 |
23bf7e41b0064b06d2b85150da22c02a7bc4ab4aa513df435818ea59e344d896
|
File details
Details for the file ros2_graph-0.0.5-py3-none-any.whl.
File metadata
- Download URL: ros2_graph-0.0.5-py3-none-any.whl
- Upload date:
- Size: 26.1 kB
- Tags: Python 3
- Uploaded using Trusted Publishing? No
- Uploaded via: twine/4.0.2 CPython/3.8.10
File hashes
| Algorithm | Hash digest | |
|---|---|---|
| SHA256 |
9d356122ab8898fbbe60a9c2ee102c8e57d57c63007ee5aeb4e07e65b1827981
|
|
| MD5 |
83a729b998d2f948a6f12994ffc49f71
|
|
| BLAKE2b-256 |
c938ec3d61a4c5d233b6771c8f20831d613733ef729e0b0b4c966787a232d960
|


