



Roygbviz
(roy-gee-bee-viz)
v0.1.1. My own plotnine theme and colour palette for research figures.
Why I made this
Academic papers can be so boring to read, especially if you're not a technical person. I'm writing a research paper on cascaded speech pipelines (speech to text, a language model, then text to speech), and I wanted to be able to send it to my friends and have them actually follow along without falling asleep halfway through page two.
Figures are the best shot I've got at that. A chart people can read at a glance does more than another paragraph of methods. So I wanted a theme where the colours mean something and stay the same everywhere: each model keeps its colour in every figure, and the three stages (STT, LLM, TTS) each get their own.
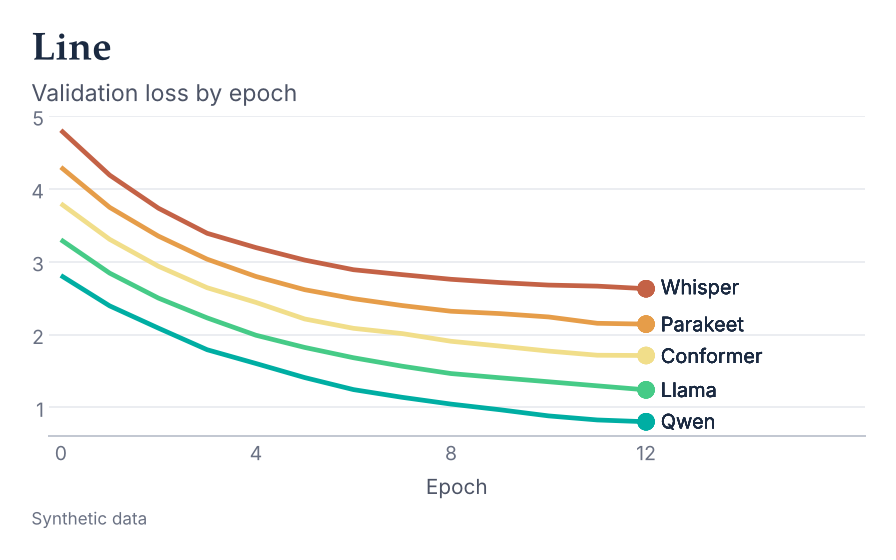
Also, I just wanted it to look pretty. Cream paper, serif titles, hairline grid, and labels written right on the lines so nobody has to squint at a legend. It works in light and dark.
Quick start
pip install roygbviz
Want the latest code instead? Install straight from GitHub:
pip install git+https://github.com/KhaiShea/roygbviz.git
Or clone it and edit it yourself (pip install -e . from the project folder).
import roygbviz as rv
from plotnine import ggplot, aes, geom_line

rv.use("light")           # or "dark"

(ggplot(df, aes("epoch", "loss", colour="model"))
 + geom_line()
 + rv.end_labels(df, "epoch", "loss", "model") + rv.room()
 + rv.scale_colour_roygbviz_d())
rv.use() sets up plotnine's theme, matplotlib's defaults and colour cycle, and the colormaps roygbviz, roygbviz_spectrum and roygbviz_div. It remembers whether you picked light or dark.
| You are drawing | Add |
|---|---|
| Lines or points by group | rv.scale_colour_roygbviz_d() |
| Bars or areas by group | rv.scale_fill_roygbviz_d() |
| Magnitude (heatmap) | rv.scale_fill_roygbviz_c("violet") |
| Above or below a baseline (cold to hot) | rv.scale_fill_roygbviz_div() |
| STT / LLM / TTS comparisons | rv.scale_fill_roygbviz_groups() |
| Theme and scales together | + rv.roygbviz("dark", aesthetics="both") |
| Name lines at their ends | rv.end_labels(...) and rv.room() |
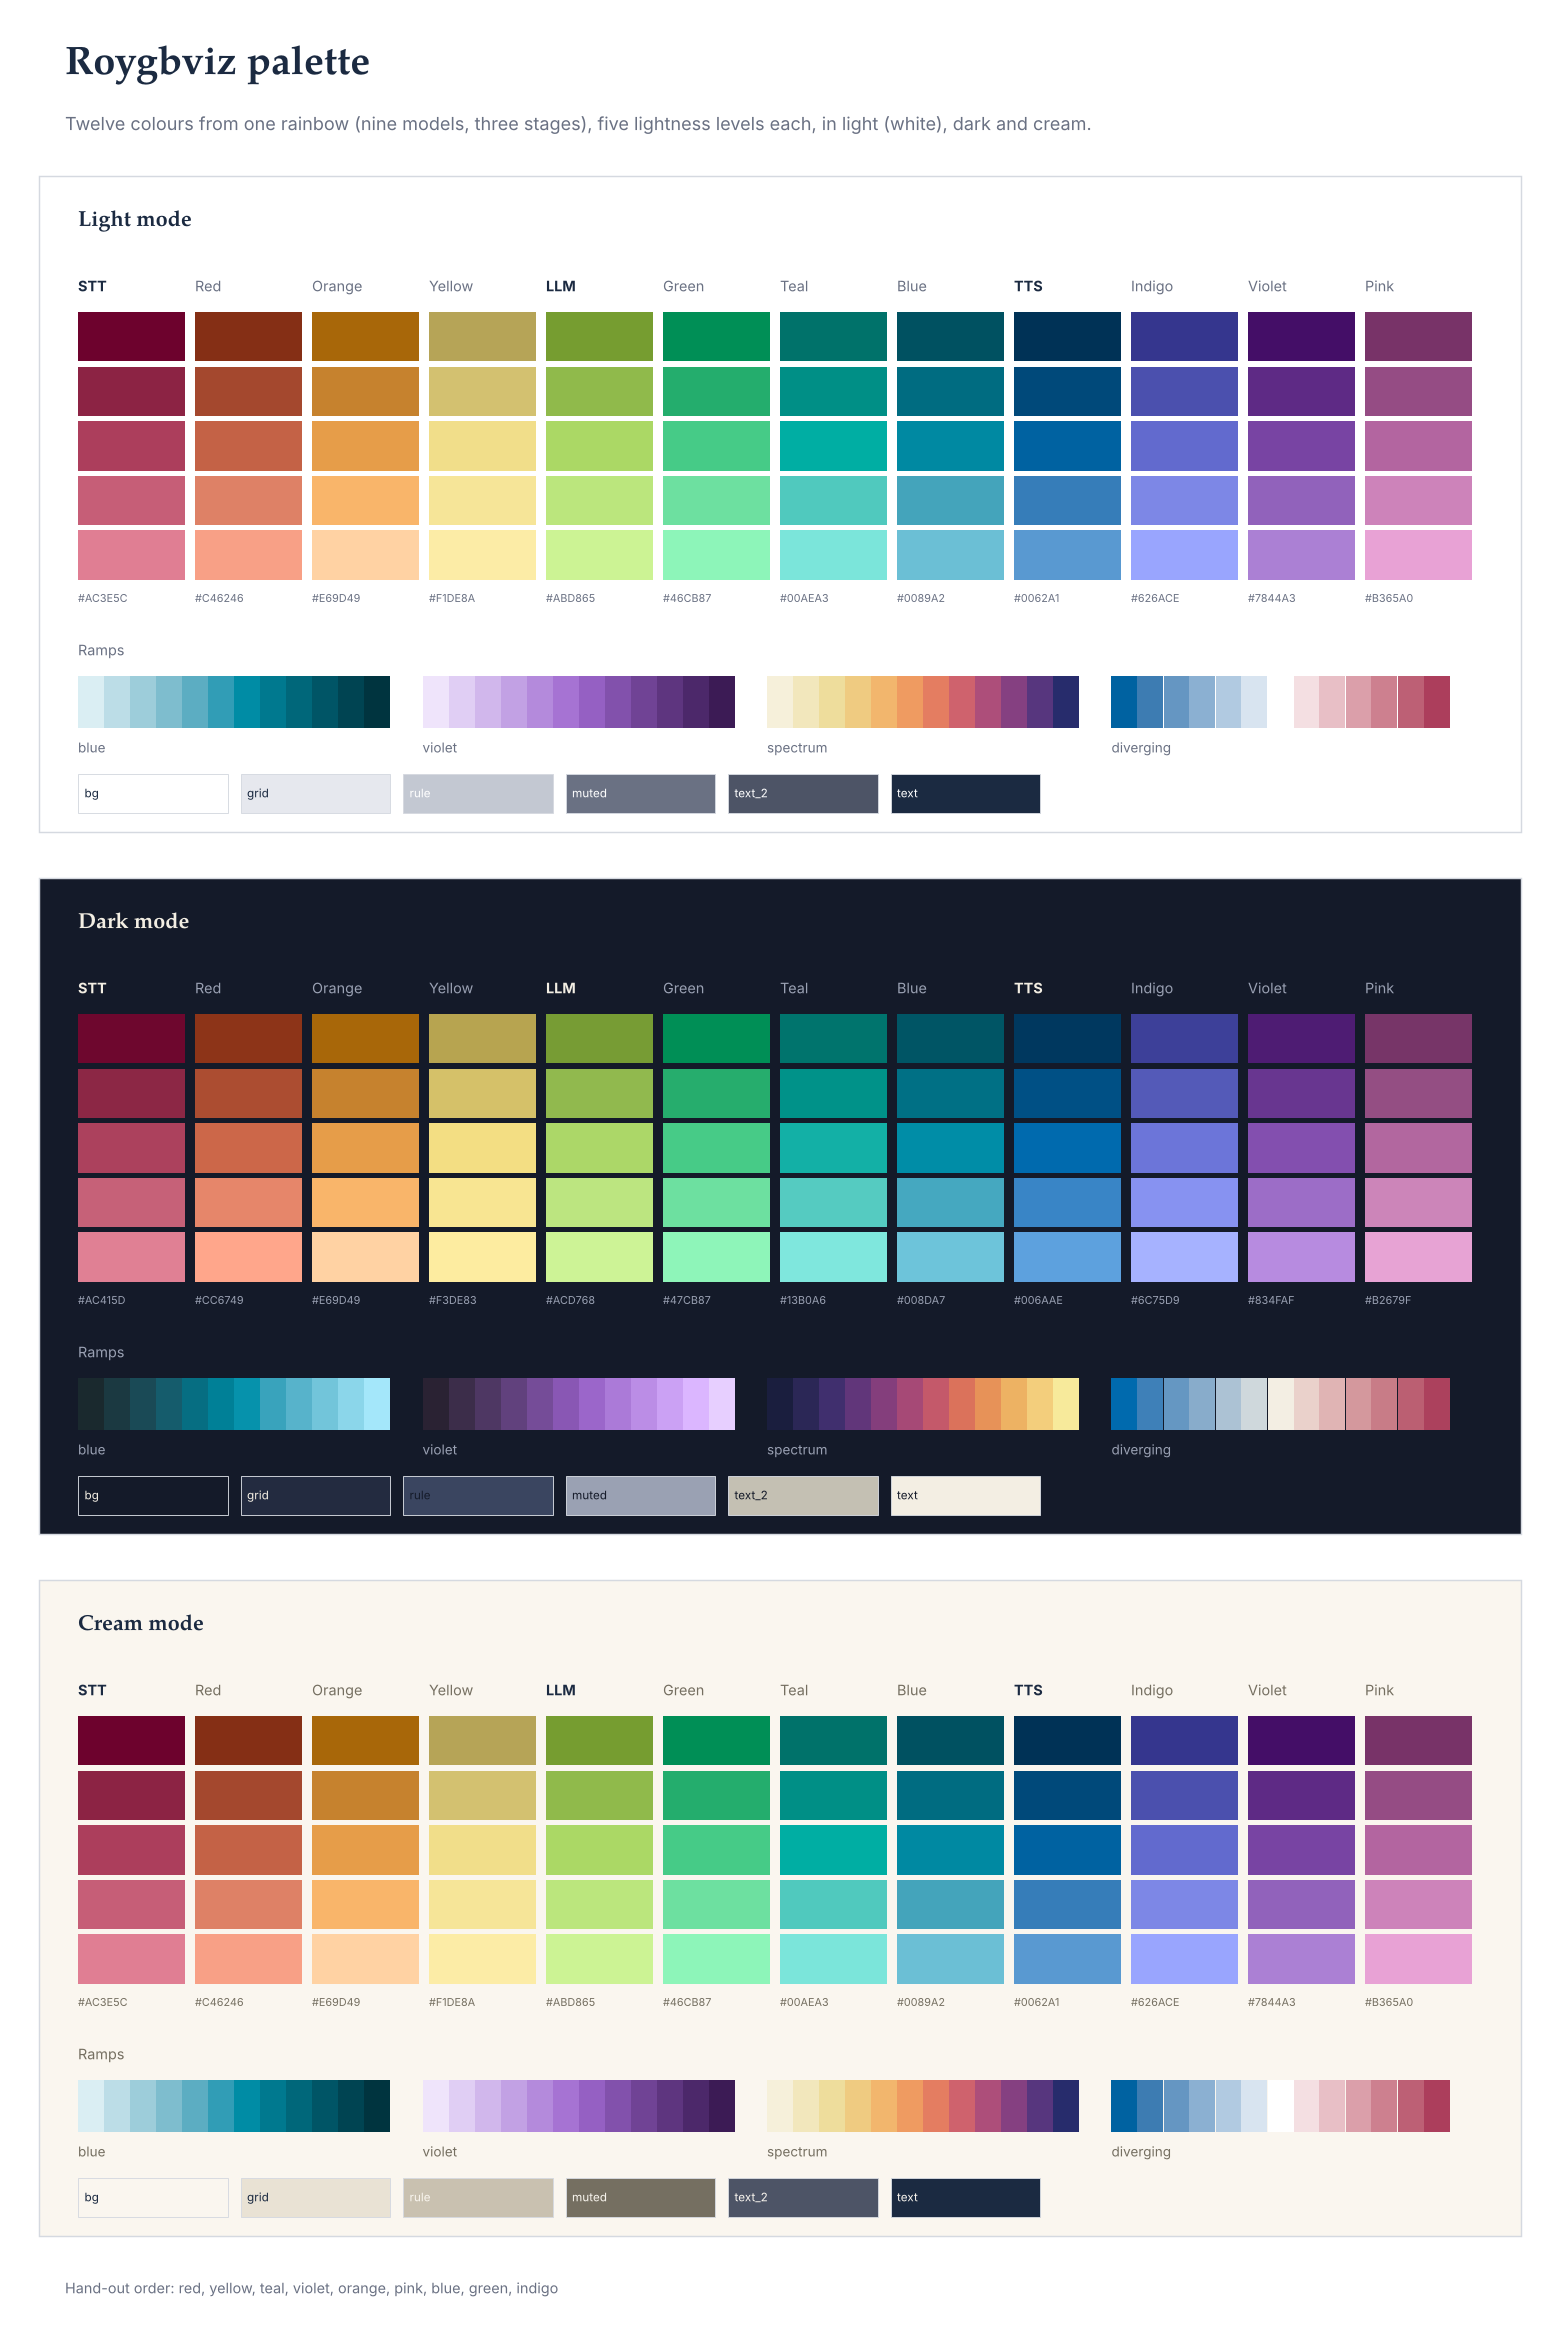
Twelve colours from one rainbow
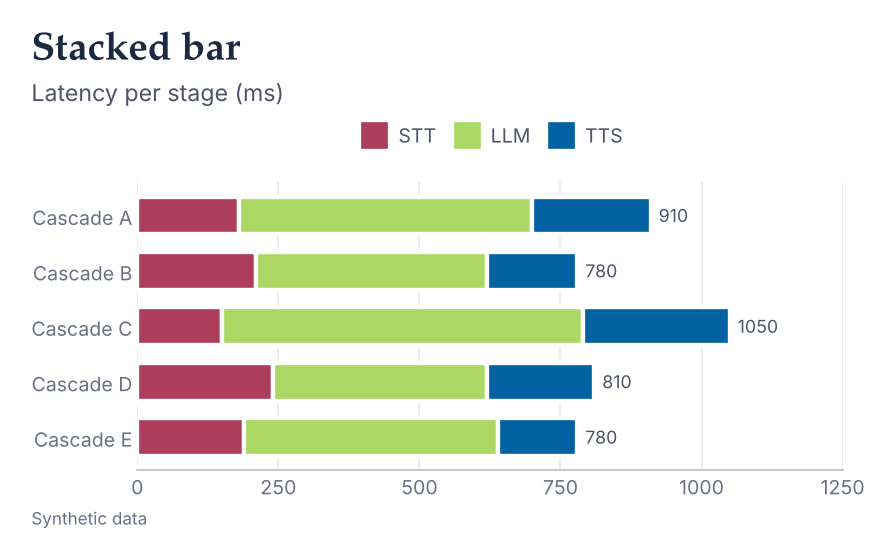
I built these from Kate Morley's article A 12-bit rainbow palette, which she made for National Grid: Live. It explains the problem better than I can, but the short version is this:
- A plain RGB rainbow looks uneven, because we see green as much brighter than blue. Neighbouring colours jump in brightness.
- A perfectly even rainbow in a perceptual colour space (LCH) has its own problems. Yellow goes brown, red goes pink and blue goes very pale.
- Her fix is to let the brightness vary on purpose. Yellow gets the brightest spot, because it only looks yellow when it's bright, and the other hues are worked out around that.
I borrowed that thinking rather than her colours. I wanted twelve hues instead of her twelve exact hex codes, and I wanted them to feel like the nine muted colours I already had. So I did it in OKLCH (a newer, more even version of LCH):
- Twelve hues spaced evenly round the wheel, 30 degrees apart.
- Lightness peaks at yellow and falls away either side, so yellow still reads as yellow.
- Chroma (how colourful) is kept close to constant, at about the level of my original nine.
- Small nudges to each colour's lightness and chroma, until the closest neighbouring pair was far enough apart to tell apart (about 7 before, about 11 after, on the OKLab scale times 100).
Dark mode uses the same hues with only the lightness moved.
Nine of the twelve are for the models and three are for the stages. Each stage leads its own block of hues, so a stage and its models look like a family:
- STT with red, orange, yellow
- TTS with green, teal, blue
- LLM with indigo, violet, pink
Stages (default colours)
| Light | Dark | |
|---|---|---|
| STT | #AC3E5C |
#AC415D |
| LLM | #0062A1 |
#006AAE |
| TTS | #ABD865 |
#ACD768 |
Models (default colours)
| Light | Dark | |
|---|---|---|
| Red | #C46246 |
#CC6749 |
| Orange | #E69D49 |
#E69D49 |
| Yellow | #F1DE8A |
#F3DE83 |
| Green | #46CB87 |
#47CB87 |
| Teal | #00AEA3 |
#13B0A6 |
| Blue | #0089A2 |
#008DA7 |
| Indigo | #626ACE |
#6C75D9 |
| Violet | #7844A3 |
#834FAF |
| Pink | #B365A0 |
#B2679F |
scale_fill_manual(values=rv.group_map()) # or rv.scale_fill_roygbviz_groups()
Which colour comes first. If you just ask for the next colour, you get red, yellow, teal, violet, orange, pink, blue, green, indigo. Each new colour is the one furthest from the ones already used, so your first three or five series are as easy to tell apart as they can be. Ask for order="rainbow" if you'd rather have the normal ROYGBIV order.
Keep a model the same colour in every figure:
COL = rv.colour_map(["Whisper", "Llama", "Kokoro", "Other"])   # "Other" gets grey
... + scale_colour_manual(values=COL)
Levels of lightness
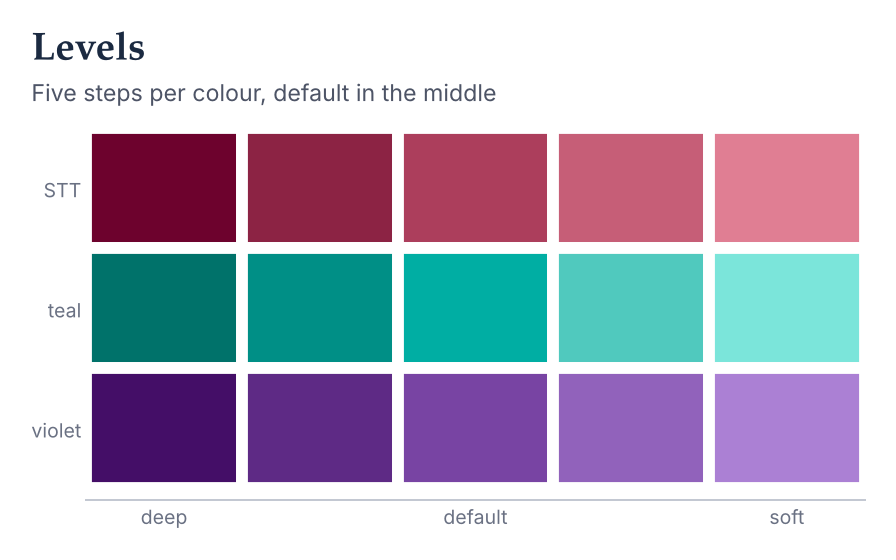
Every one of the twelve comes in five levels, from deep to soft. The default colour is the middle one, in both light and dark. If you change your mind, DEFAULT_LEVEL in palettes.py moves it.
rv.levels("green", 5)              # deep to soft, default in the middle
rv.levels("STT", 3)                # stage colours work too
scale_colour_roygbviz_d(level=-1)  # everything one step deeper, good for thin lines
Use levels for things within one model (different settings, say) or for stacked parts. Pale colours like yellow take smaller steps so the soft ones don't turn white.
Diverging (cold to hot)
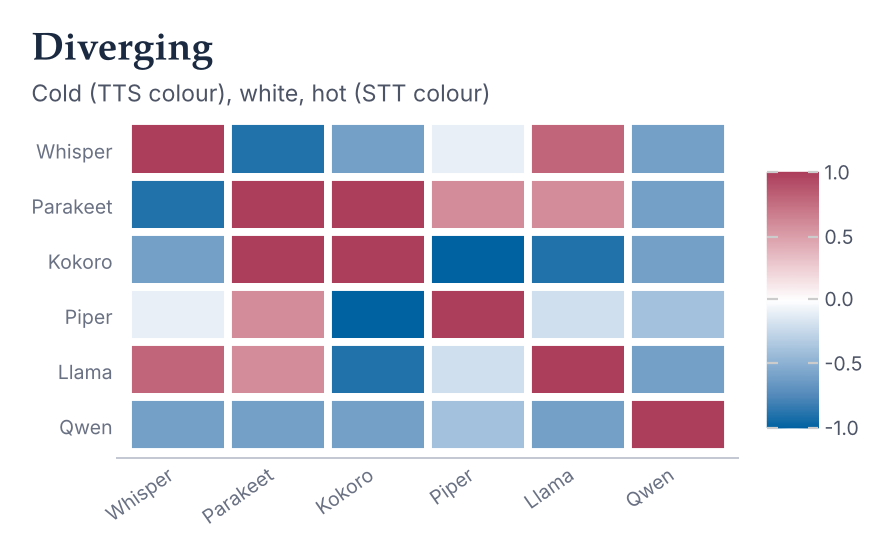
rv.scale_fill_roygbviz_div() is a straight gradient. +1 is the STT colour (hot), 0 is white, and -1 is the LLM colour (cold). The ends are the stage colours, so a diverging chart still feels like part of the same set. It centres on zero unless you pass midpoint=. In dark mode zero is a soft cream-white (#F3EEE3) so it doesn't glare.
On the pale tiles use dark text for labels. On the strong ends use white (light mode) or navy (dark mode). The gallery shows this.
Shading
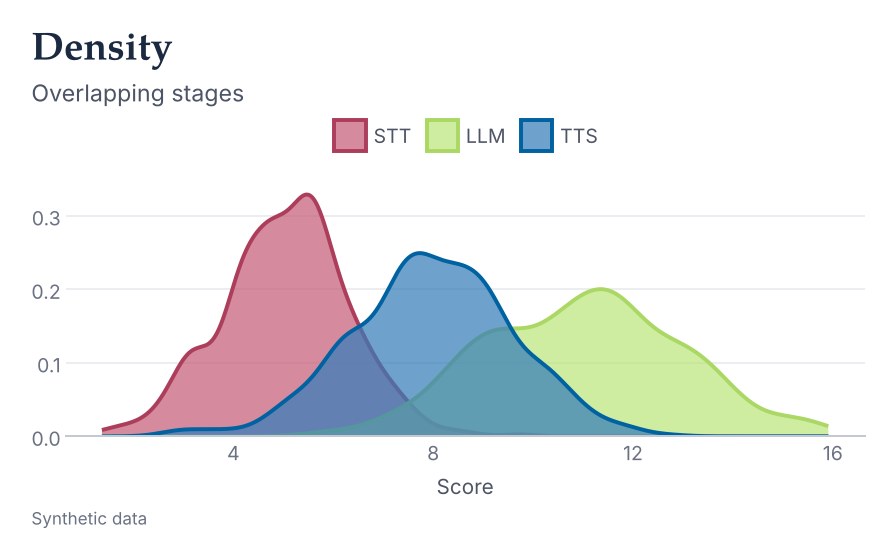
For fills (areas, bands, ribbons, bar and box bodies) I use rv.shade(colour), which is one level lighter than the default colour. The line or outline keeps the default colour so the edges stay crisp. In dark mode "lighter" means brighter, which still looks like a soft fill against the navy.
fill = rv.shade("blue")                      # one step lighter
fills = rv.shade_map(rv.colour_map(names))   # for scale_fill_manual
ggplot(d, aes("x", "y")) + geom_area(fill=rv.shade("teal"), colour=rv.colour("teal"))
Sizes
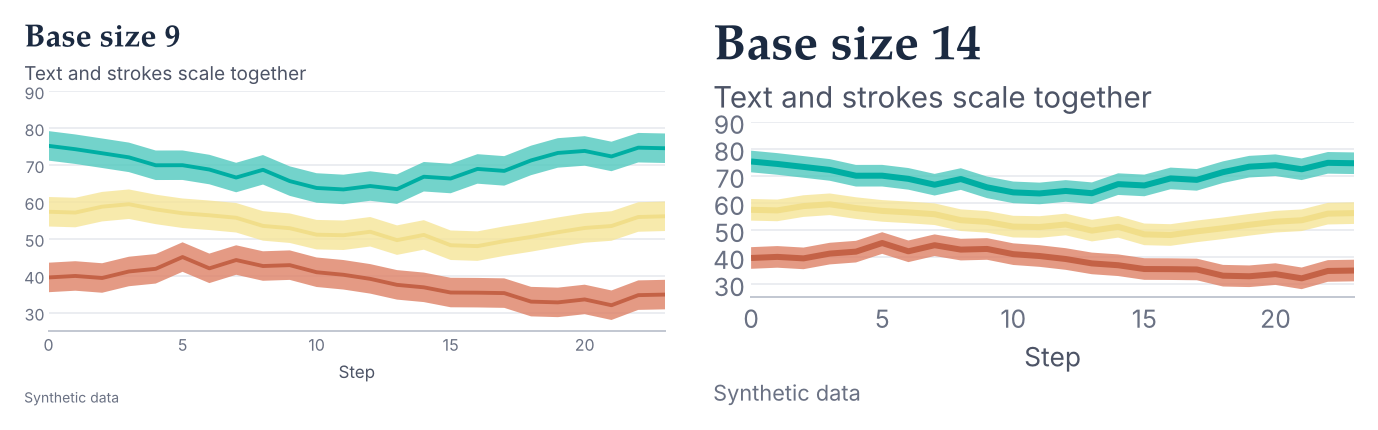
base_size sets the text size, and rv.stroke(size) scales line widths and marker sizes to match. So if you shrink a figure to fit a paper's column, the text and the lines shrink together and it still looks right.
Mega test
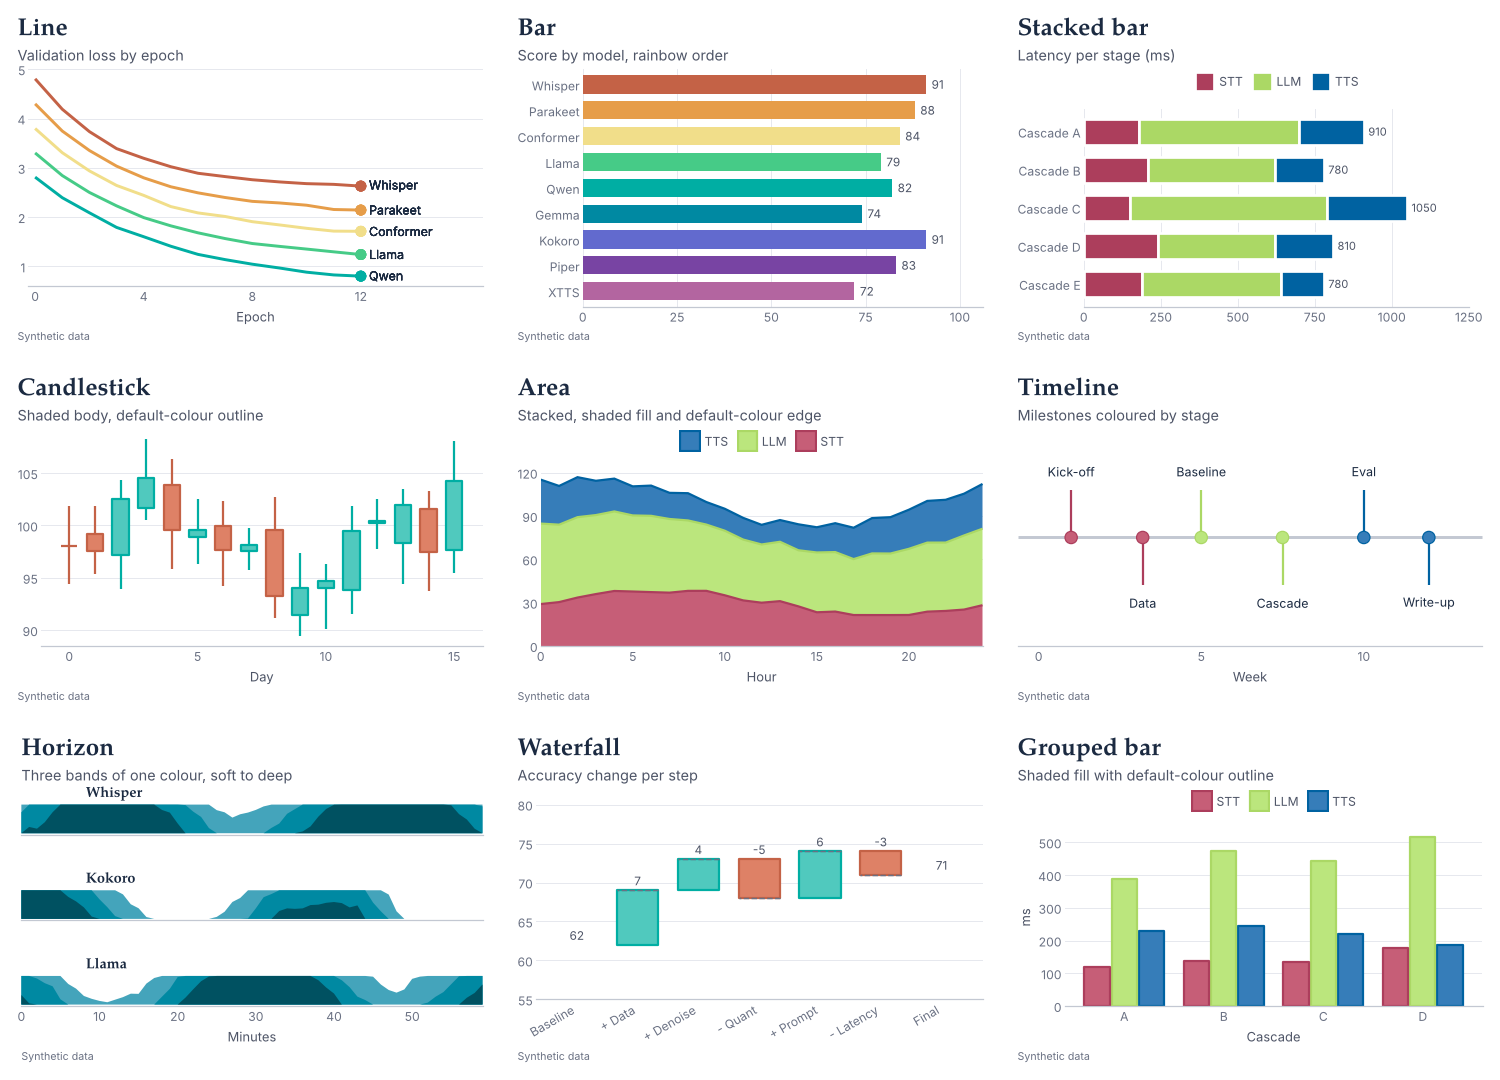
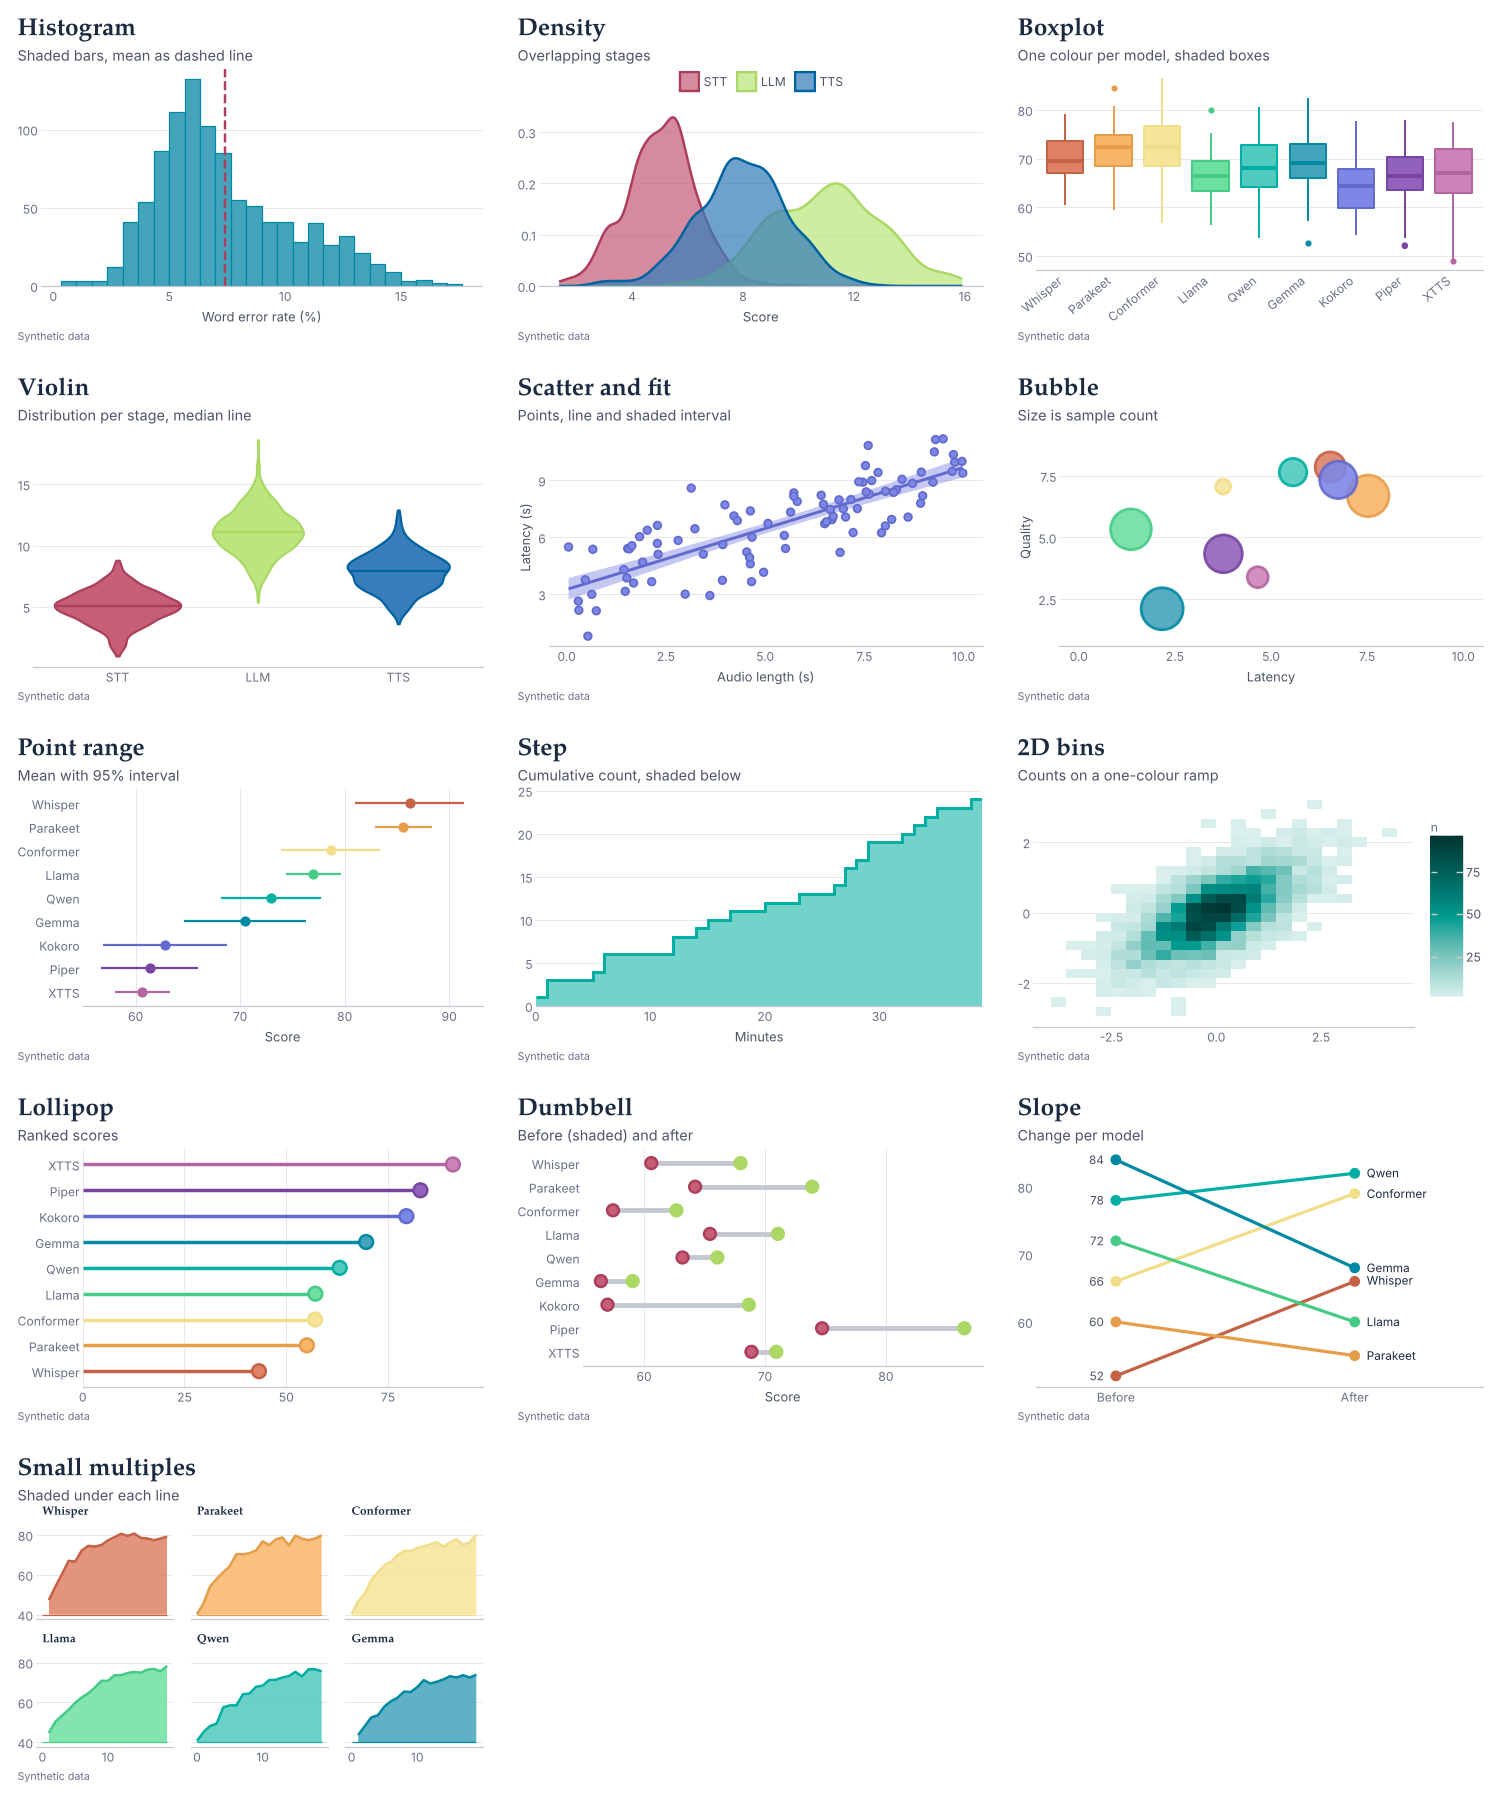
I wanted to know it holds up on more than line charts, so python examples/mega.py assets draws 45 charts in light and dark:
- Core: line, bar, stacked bar, candlestick, area, timeline, horizon, waterfall, grouped bar
- Chart elements: arrows, level difference, reference line, benchmark, trendline, shade, difference, projection
- Statistical: histogram, density, boxplot, violin, scatter, bubble, point range, step, 2D bins, lollipop, dumbbell, slope, small multiples
- Styles: grids, levels, sizes, shading steps
The sheets land in assets/mega_{core,elements,stats,styles}_{light,dark}.png.
Honest caveats
- Some colours are close. Twelve evenly spaced hues can't be as far apart as nine I spread by hand. The closest pair is about 10.7 apart in light and 10.5 in dark (OKLab, times 100). A stage sits right next to its models on the wheel, so keep stage charts and model charts separate, and use shape or direct labels.
- Contrast is weak on cream. Yellow is only about 1.3:1, and teal, orange and green are under 3:1 in light mode. For thin lines, label them directly, add an outline, or use
level=-1.end_labelssets the text in ink for this reason. - Twelve colours is a lot. The usual advice is eight at most. That was my brief, so pair colour with labels or shapes.
- No colourblind-safe set yet.
colourblind=TrueraisesNotImplementedError. It's on my list.
API
| Function | What it does |
|---|---|
use(mode, order, plotnine, base_size, grid) |
Set everything up for the session |
theme_roygbviz(mode, base_size, base_family, title_family, grid) |
The plotnine theme |
roygbviz(mode, order, level, aesthetics) |
Theme plus scales in one go |
get_palette(mode) |
A Palette with .roles, .series(level=), .levels(), .sequential(), .diverging(), .neutrals |
stroke(size) |
Scale a line width or marker size with base_size |
shade(colour, steps), shade_map(map) |
One level lighter, for fills |
levels(role, n), colour(role), colour_map(names), cmap(kind) |
Quick colour access |
end_labels(...), room(...) |
Labels at line ends, and space for them |
check(colours, mode) |
Separation and contrast report |
Built on other people's work
Roygbviz is mine, but it stands on open source work. Thank you to:
- plotnine (MIT licence), the Python grammar of graphics library this is a theme for. The theme builds on plotnine's
theme_gray. - matplotlib, which plotnine draws with, and which
rv.use()also sets up. - mizani, plotnine's scales library, which I use for the diverging midpoint.
- Kate Morley for the 12-bit rainbow article that shaped how the colours were chosen. I didn't use her hex codes, but the approach is hers. Her site calls its content free; I couldn't find a named licence, so I'm crediting her here to be safe.
- OKLab and OKLCH, by Björn Ottosson, the colour maths behind the levels, shading and separation checks.
Roygbviz itself is under the MIT licence (see LICENSE).
Gallery
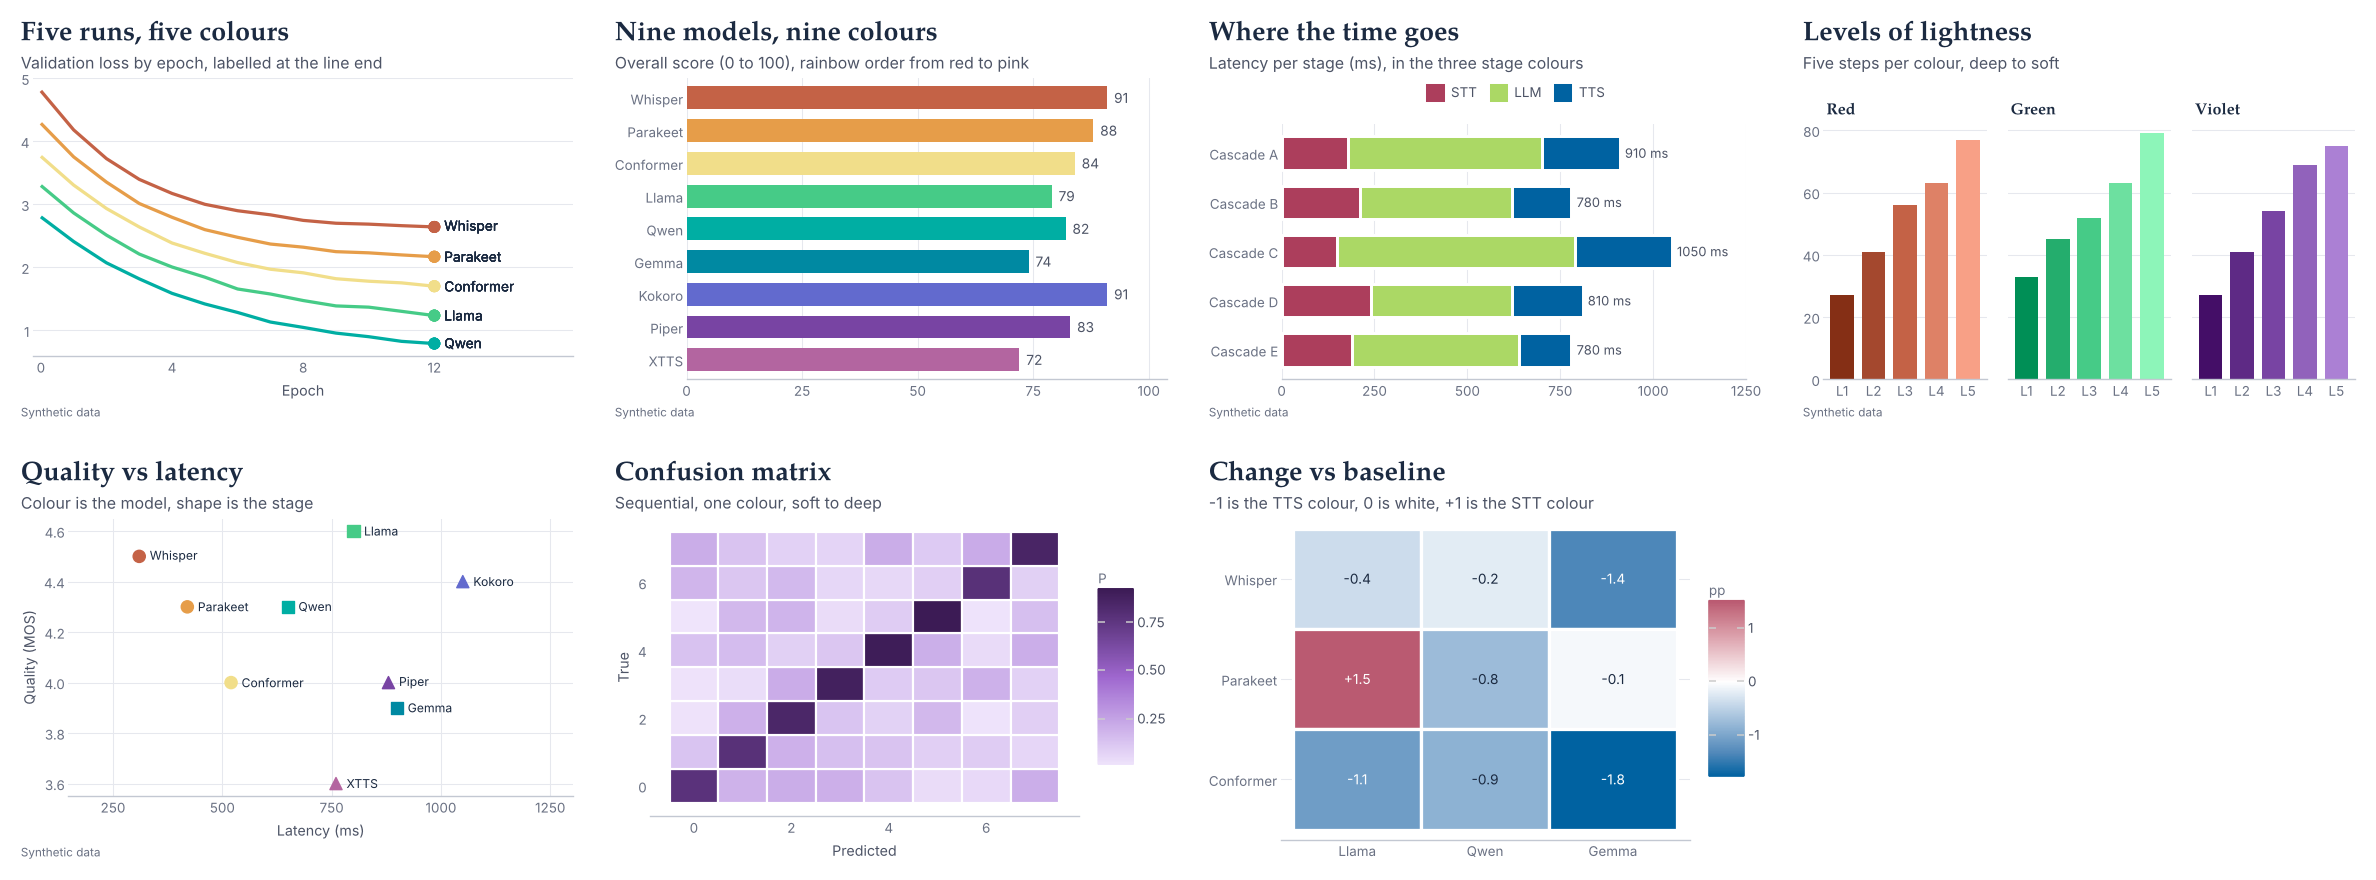
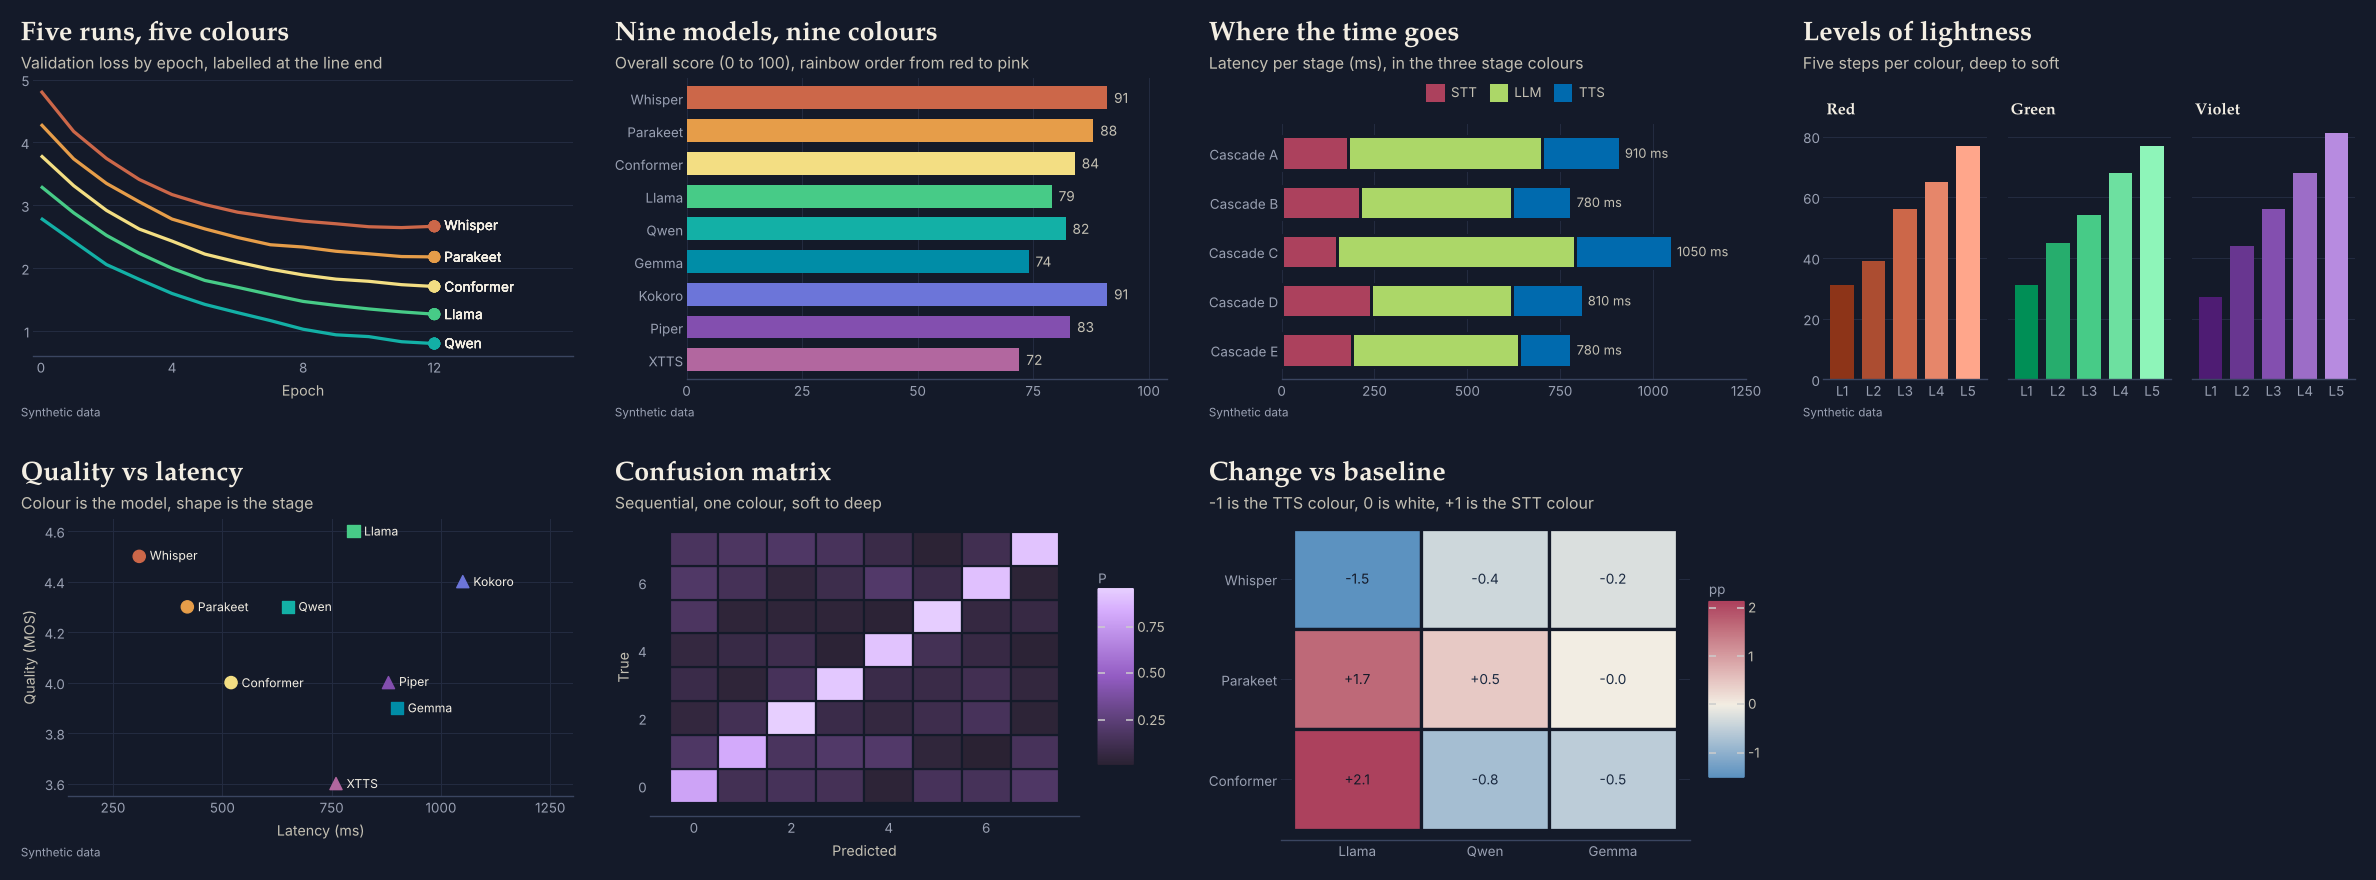
Regenerate with python examples/gallery.py and python examples/swatches.py. Tests: pytest.
1 maintainer

Metadata
1 maintainer
Release files for roygbviz 0.1.1
For a detailed explanation of source distributions (sdists) and built distributions (wheels), please see the package formats documentation.
Source distribution (sdist)
| File | Size | Uploaded | |
|---|---|---|---|
| roygbviz-0.1.1.tar.gz | 742.7 kB | Details |
Built distribution (wheel)
| File | Interpreter | ABI | Platform | Reset |
|---|---|---|---|---|
| roygbviz-0.1.1-py3-none-any.whl | Python 3 | none | any | Details |
Total release size: 765.8 kB
Release files / roygbviz-0.1.1.tar.gz
| Download URL | roygbviz-0.1.1.tar.gz |
|---|---|
| Size | 742.7 kB |
| Tags | Source |
|
SHA-256 checksum How to use checksums |
b2a27d51f8bb43b6c44c5a19a560d4f7ca939ef40d474182fe90829da26878d2
|
|
BLAKE2b-256 checksum How to use checksums |
c3c930722fc0584bf94c7cb58997c57576ad34de652df1a775d1039fa0e2b12d
|
| Upload date | |
|
Uploaded using Trusted Publishing? What is trusted publishing? |
No |
| Uploaded via |
twine/7.0.0 CPython/3.14.8
|
Release files / roygbviz-0.1.1-py3-none-any.whl
| Download URL | roygbviz-0.1.1-py3-none-any.whl |
|---|---|
| Size | 23.1 kB |
| Tags | Python 3 |
|
SHA-256 checksum How to use checksums |
5e3f2885892b6363b4bba1bab4c2e8a9a46fe181fae61eb538bfe28b7946cc2f
|
|
BLAKE2b-256 checksum How to use checksums |
f2ae53a083dd677d1278fe8db493644f62e57fe4defbd70a7c193bb96664cc6e
|
| Upload date | |
|
Uploaded using Trusted Publishing? What is trusted publishing? |
No |
| Uploaded via |
twine/7.0.0 CPython/3.14.8
|














