SVG RugPlot Python API


Project description
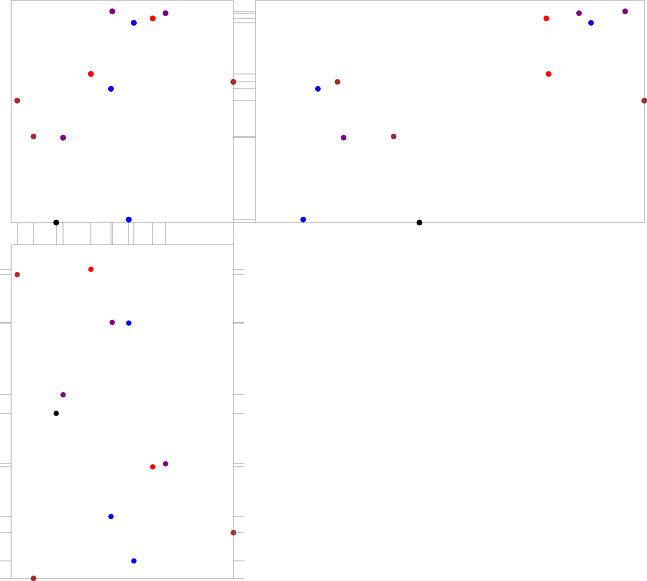
Connected bivariate scatter plots, in a rug.
Installation
Install library, perhaps within a virtualenv:
$ pip install rugplot
A short example
Three scatter plots in a rug:
import numpy as np
import svgwrite, random
from rugplot import CircleMarker, Scatter

N = 12
w = np.random.rand(N)
x = np.random.rand(N)
y = np.random.rand(N)
z = np.random.rand(N)

markers = []
for i in range(N):
    markers.append(CircleMarker(x=x[i], y=y[i], r=2.5,
                                fill=random.choice(['purple', 'blue',
                                                    'green', 'orange', 'red'])))

s0 = Scatter(x, y, markers, insert=(100,30), size=(200,200))
s0.drawBorder(stroke='grey', fill='white', stroke_width=0.4)
s0.drawMarkers()
s0.drawDotDash(['e','s'], dash_height=10, stroke="grey", stroke_width=0.4)


s1 = Scatter(w, y, markers, insert=(320,30), size=(350,200))
s1.drawBorder(stroke='grey', fill='white', stroke_width=0.4)
s1.drawMarkers()
s1.drawDotDash(['w'], dash_height=10, stroke="grey", stroke_width=0.4)


s2 = Scatter(x, z, markers, insert=(100,250), size=(200,300))
s2.drawBorder(stroke='grey', fill='white', stroke_width=0.4)
s2.drawMarkers()
s2.drawDotDash(['n','e', 'w'], dash_height=10, stroke="grey", stroke_width=0.4)


rug = svgwrite.Drawing('example.svg')
rug.add(s0.dwg)
rug.add(s1.dwg)
rug.add(s2.dwg)
rug.save()
Release history Release notifications | RSS feed

Download files
Download the file for your platform. If you're not sure which to choose, learn more about installing packages.
Source Distribution
rugplot-0.8.1.tar.gz
(2.5 kB
view details)
File details
Details for the file rugplot-0.8.1.tar.gz.
File metadata
- Download URL: rugplot-0.8.1.tar.gz
- Upload date:
- Size: 2.5 kB
- Tags: Source
- Uploaded using Trusted Publishing? No
File hashes
| Algorithm | Hash digest | |
|---|---|---|
| SHA256 |
b3df528e85b6bac03b7f5074864948a0a7c5a078e8fa80bc6ca89266ebde7d91
|
|
| MD5 |
6c6b3b98eb66fc9e794719865a956bb2
|
|
| BLAKE2b-256 |
63db48e16dbeded32645fe0db9184039f1d18ac534210d094b7c828798cb27cc
|


