
RunRaccoon 🦝
Local-only, drop-in replacement for the parts of Weights & Biases you actually look at.
RunRaccoon keeps wandb's API and file layout but has no cloud, no login, and no sync. Runs
are written to a runraccoon/ folder inside the output directory your training script
already uses. Each run gets the files wandb would write, plus publication-ready figures:
- a progress plot refreshed every epoch,
- QC images saved exactly where wandb saves them,
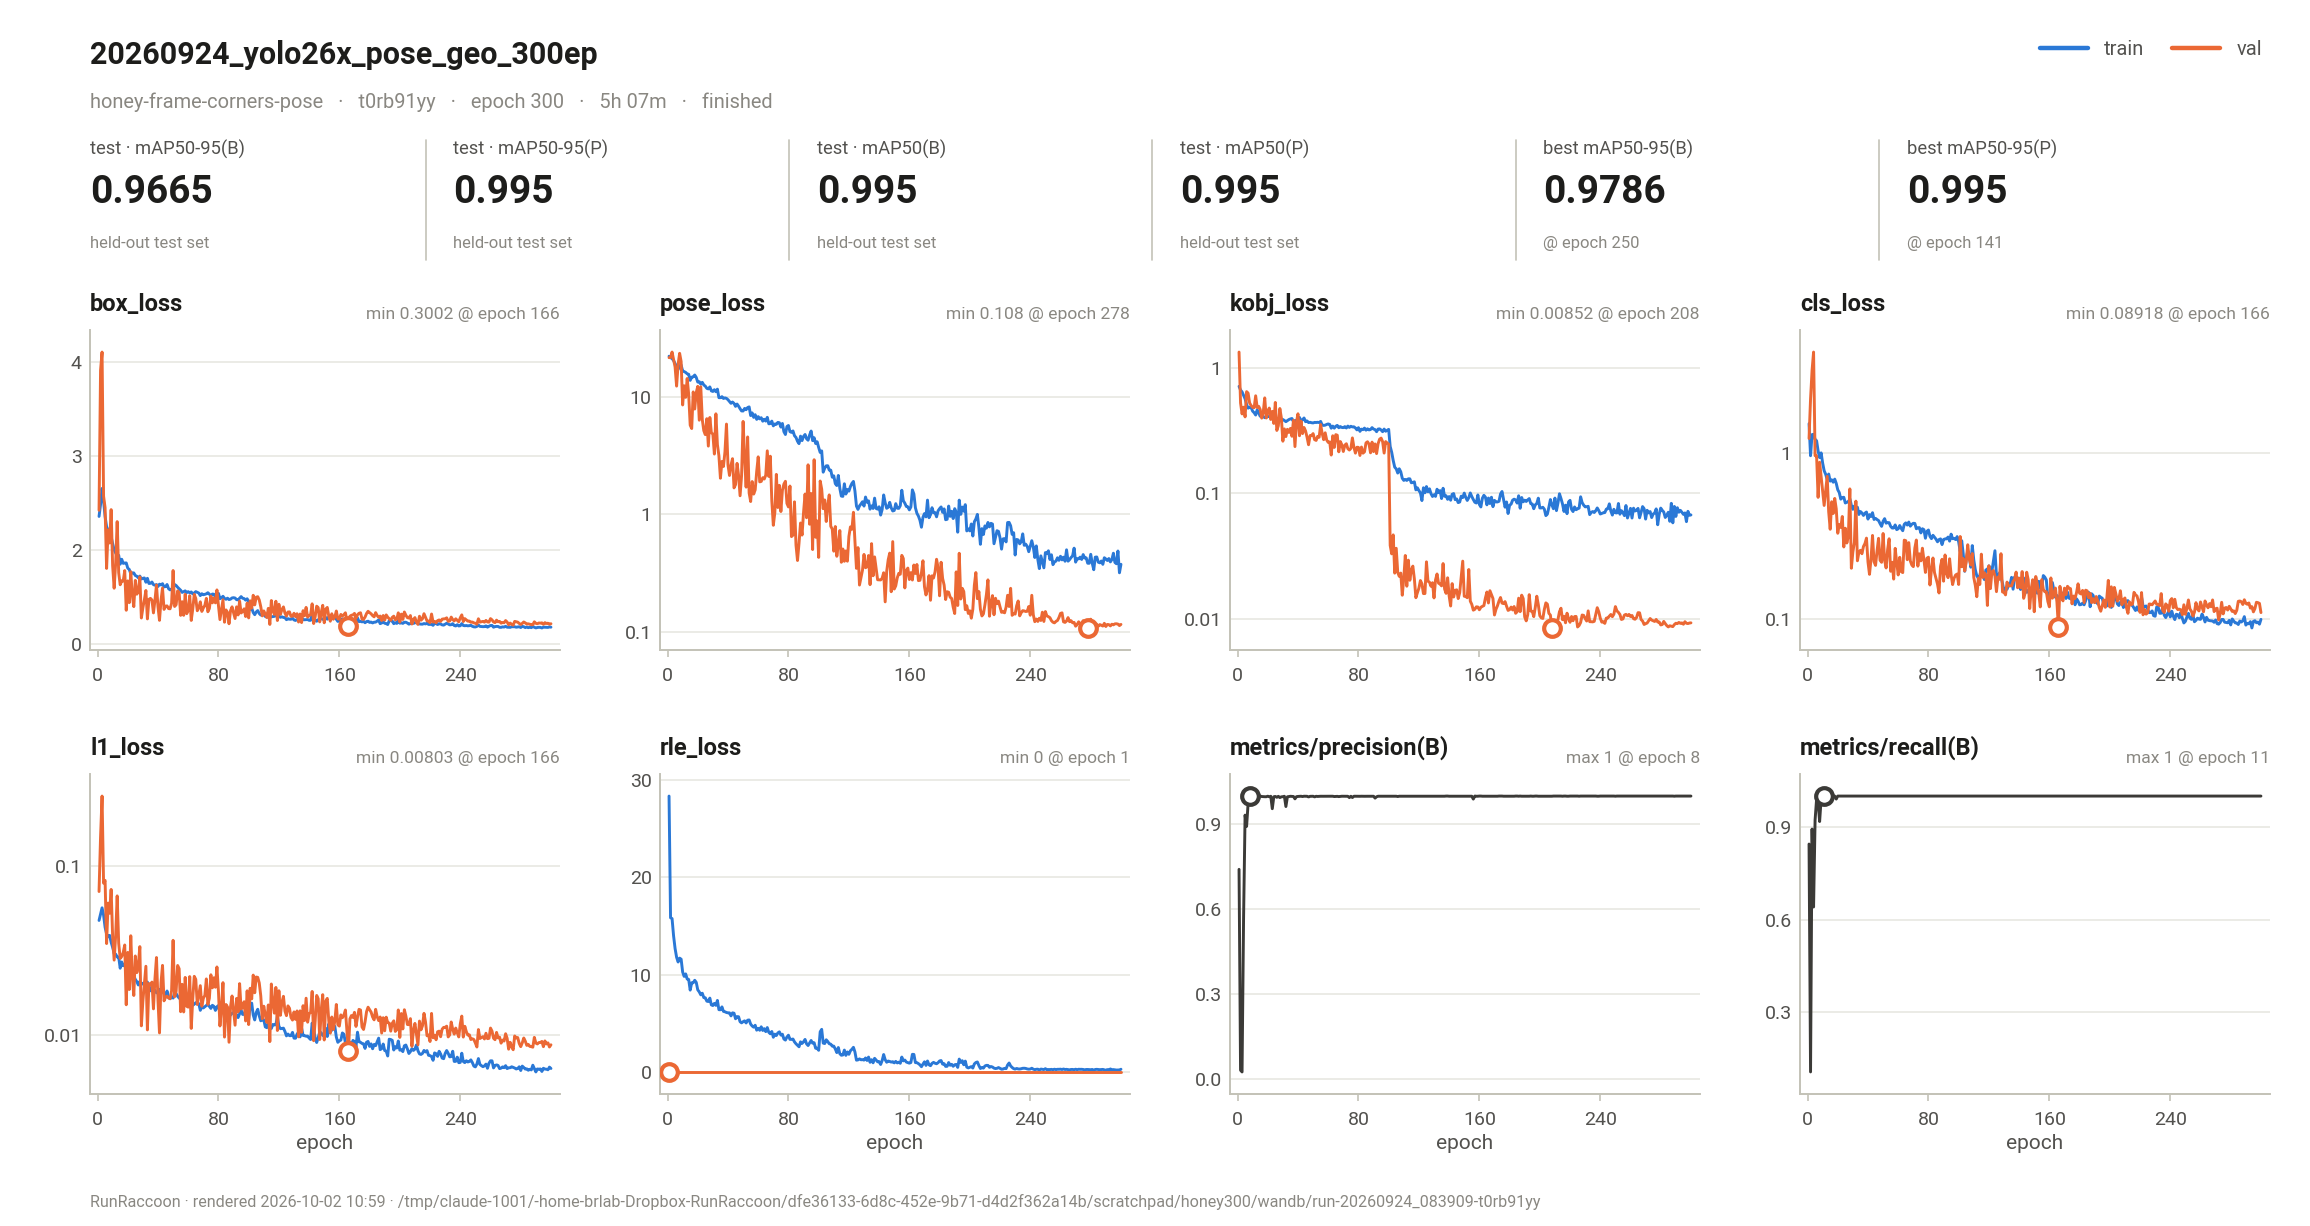
- summary figures when the run ends,
- QC contact sheets every epoch for Ultralytics training (no code needed), and a
ContactSheethelper for anything else, - training-progress GIFs of every QC image when the run ends, one for the whole sheet and one per panel,
- an optional localhost dashboard that shows every run on the machine, live and past.
- import wandb
+ import runraccoon as wandb
That one-line change is all most scripts need, including scripts that rely on Ultralytics' built-in wandb integration.
Contents
- Install
- Quick start
- Demos
- What you get on disk
- The figures
- QC contact sheets
- Training-progress GIFs
- The dashboard
- Ultralytics / YOLO
- PyTorch, DINOv2 and UNet (semantic segmentation)
- Swapping an existing wandb script
- API compatibility
- Settings and environment variables
- Command line
- How it works
- Limitations
- Development
- Releasing to PyPI
Install
Option 1: from PyPI
Install
pip install runraccoon
Upgrade
pip install --upgrade runraccoon
Option 2: from source (editable)
git clone https://github.com/Gene-Weaver/RunRaccoon.git
cd RunRaccoon
pip install -e .              # into the environment you train in
Requirements: Python ≥ 3.9, numpy, matplotlib, pillow, pyyaml. The dashboard uses
only the standard library and works fully offline.
Quick start
import runraccoon as wandb

wandb.init(project="leaf-segmentation", name="unet-baseline", config={"lr": 3e-4, "epochs": 50},
           dir="outputs/unet-baseline")      # your output dir; RunRaccoon adds runraccoon/ inside it

for epoch in range(50):
    ...
    wandb.log({"train/loss": train_loss, "val/loss": val_loss, "val/iou": val_iou, "epoch": epoch})
    if epoch % 5 == 0:
        wandb.log({"qc/overlay": wandb.Image(overlay, caption=f"epoch {epoch}")}, commit=False)

wandb.summary["test/iou"] = test_iou
wandb.finish()
When the run starts, RunRaccoon prints where everything goes:
runraccoon: started run unet-baseline (k3x9q2ab) -> outputs/unet-baseline/runraccoon/run-20261002_105640-k3x9q2ab
runraccoon: live dashboard -> http://127.0.0.1:8473/#run=k3x9q2ab
finish() prints a short wandb-style summary with sparklines and the paths to the plots.
Runnable examples are in examples/:
| Example | What it shows |
|---|---|
minimal.py |
No framework needed |
pytorch_loop.py |
A plain PyTorch loop |
ultralytics_yolo.py |
YOLO training through Ultralytics' wandb integration |
Demos
Three real Ultralytics trainings, each 50 epochs with a yolo26n model on full datasets. Each
used an unmodified copy of its project's training script; the only change was
import wandb → import runraccoon as wandb. The training ran on RunRaccoon 0.1.0
installed from PyPI; the figures below were re-rendered with 0.1.2 (runraccoon replot).
| Task | Data | Report card |
|---|---|---|
| Pose (4 frame corners) | Honey frames, 821 train images | 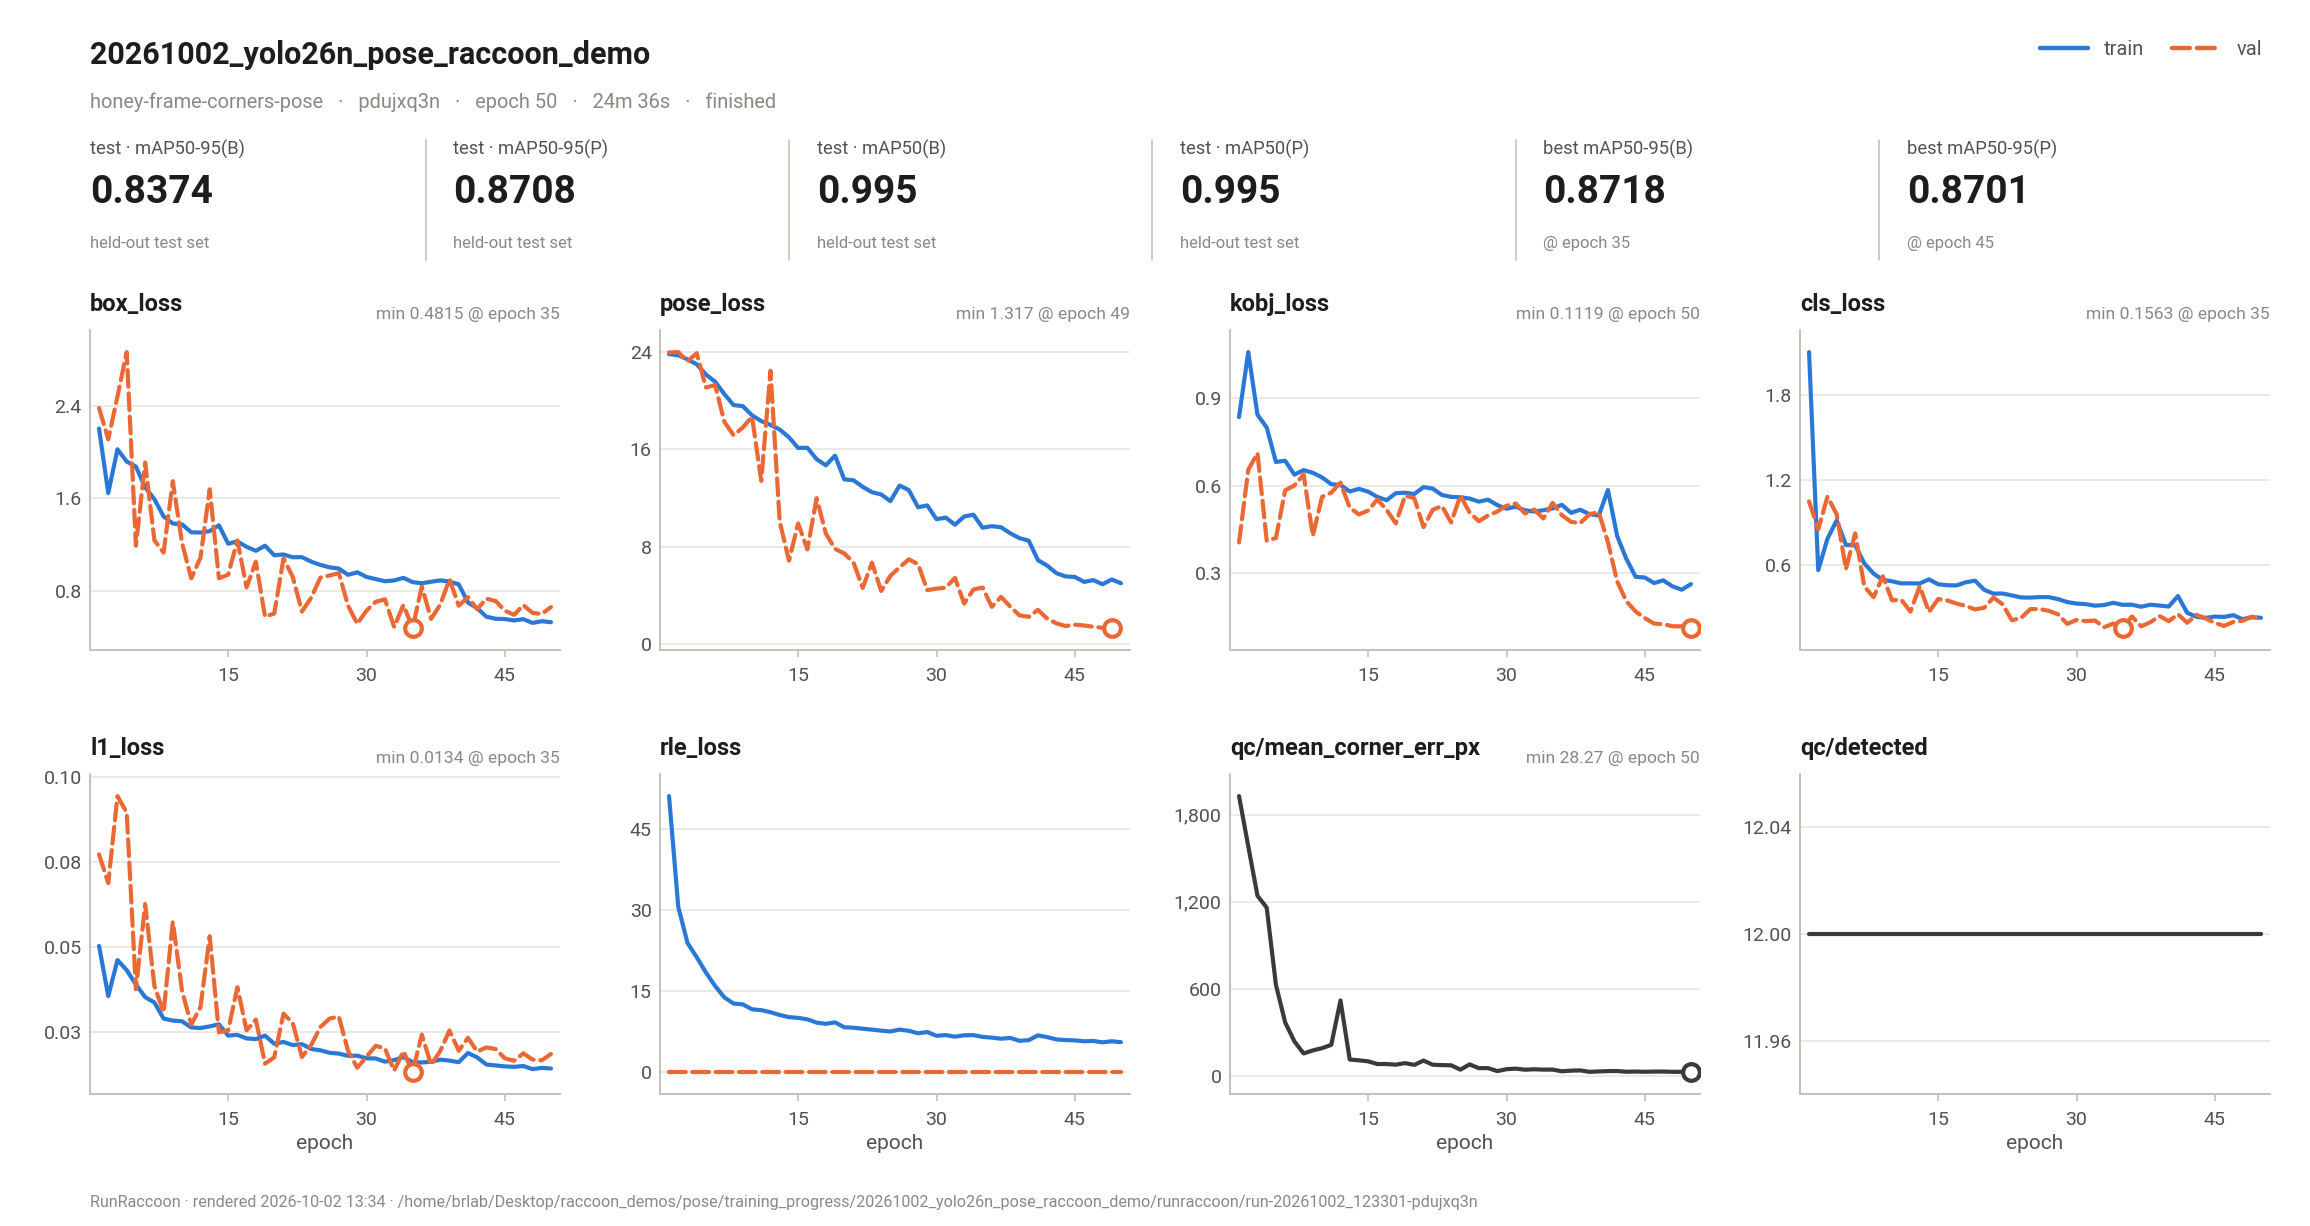 |
| Detection (rulers) | FieldPrism, 14,447 train images | 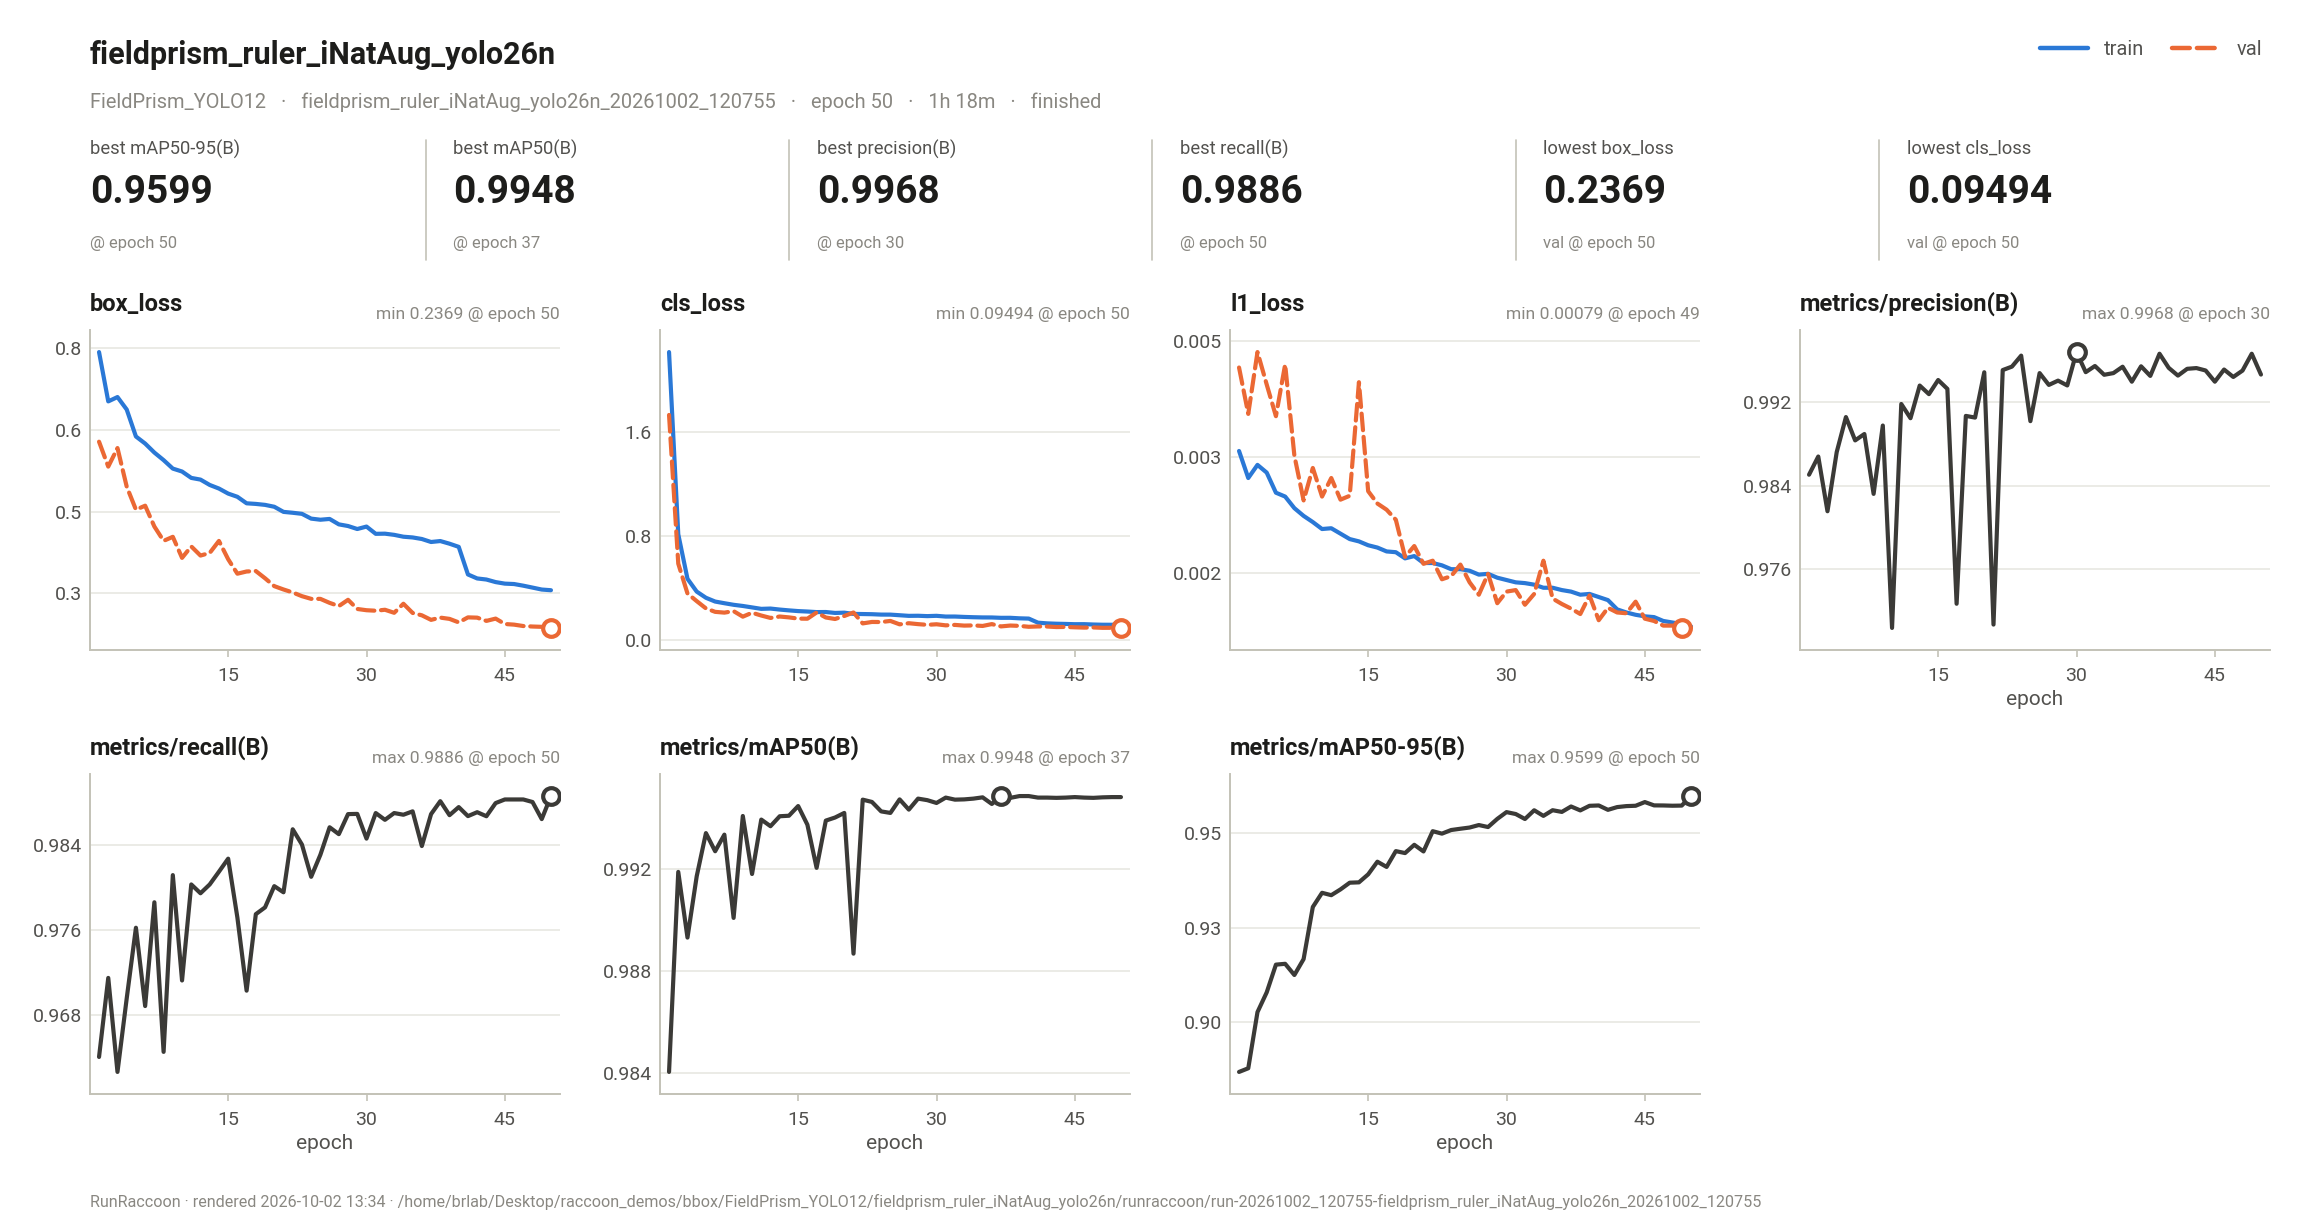 |
| Segmentation (leaf, petiole, hole) | LM3 leaves, 13,480 train images | 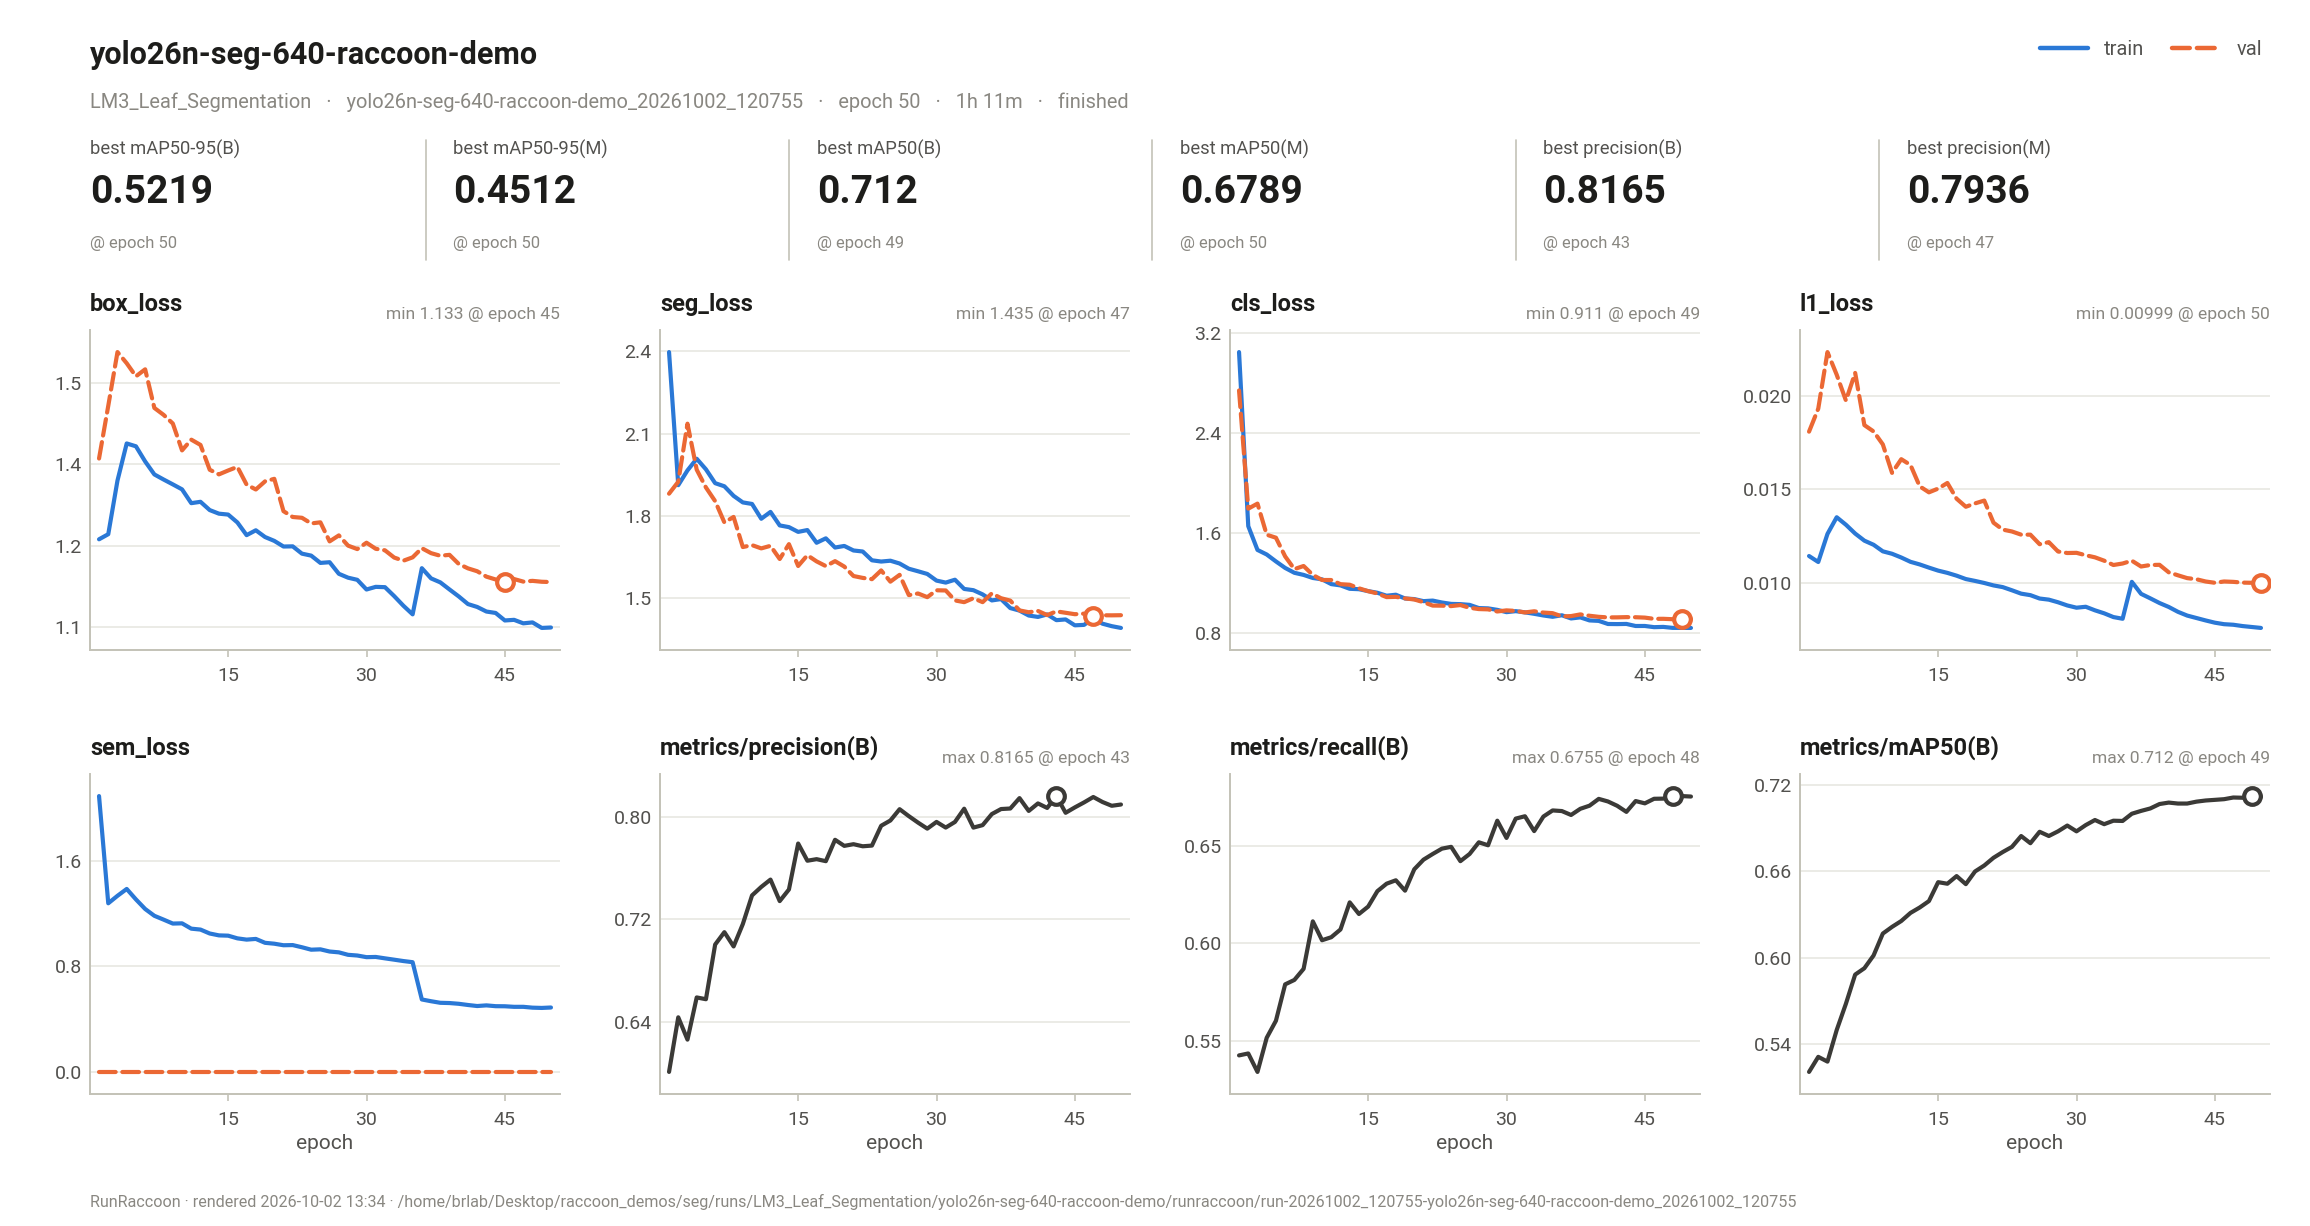 |
Plain PyTorch, no Ultralytics:
- DINOv2 weak supervision. The Honey PSSS pipeline (frozen DINOv2 ViT-S/14 probe trained on sparse points → CRF pseudo-masks → ResUNet-34/50) was instrumented with the helpers described below and run on all 6,516 train tiles. Validation uses the 1,577 val tiles' labeled points.
- UNet that already used wandb. The LM3 ruler-segmentation UNet (
train_unet.py) ran with only the import changed, on 2% of its 480k images. It logs a new image key every epoch (val/preds_epoch7), and RunRaccoon folds those into one series, so they get a step slider and GIFs.
| Run | Report card |
|---|---|
| DINOv2 linear probe (sparse points) | 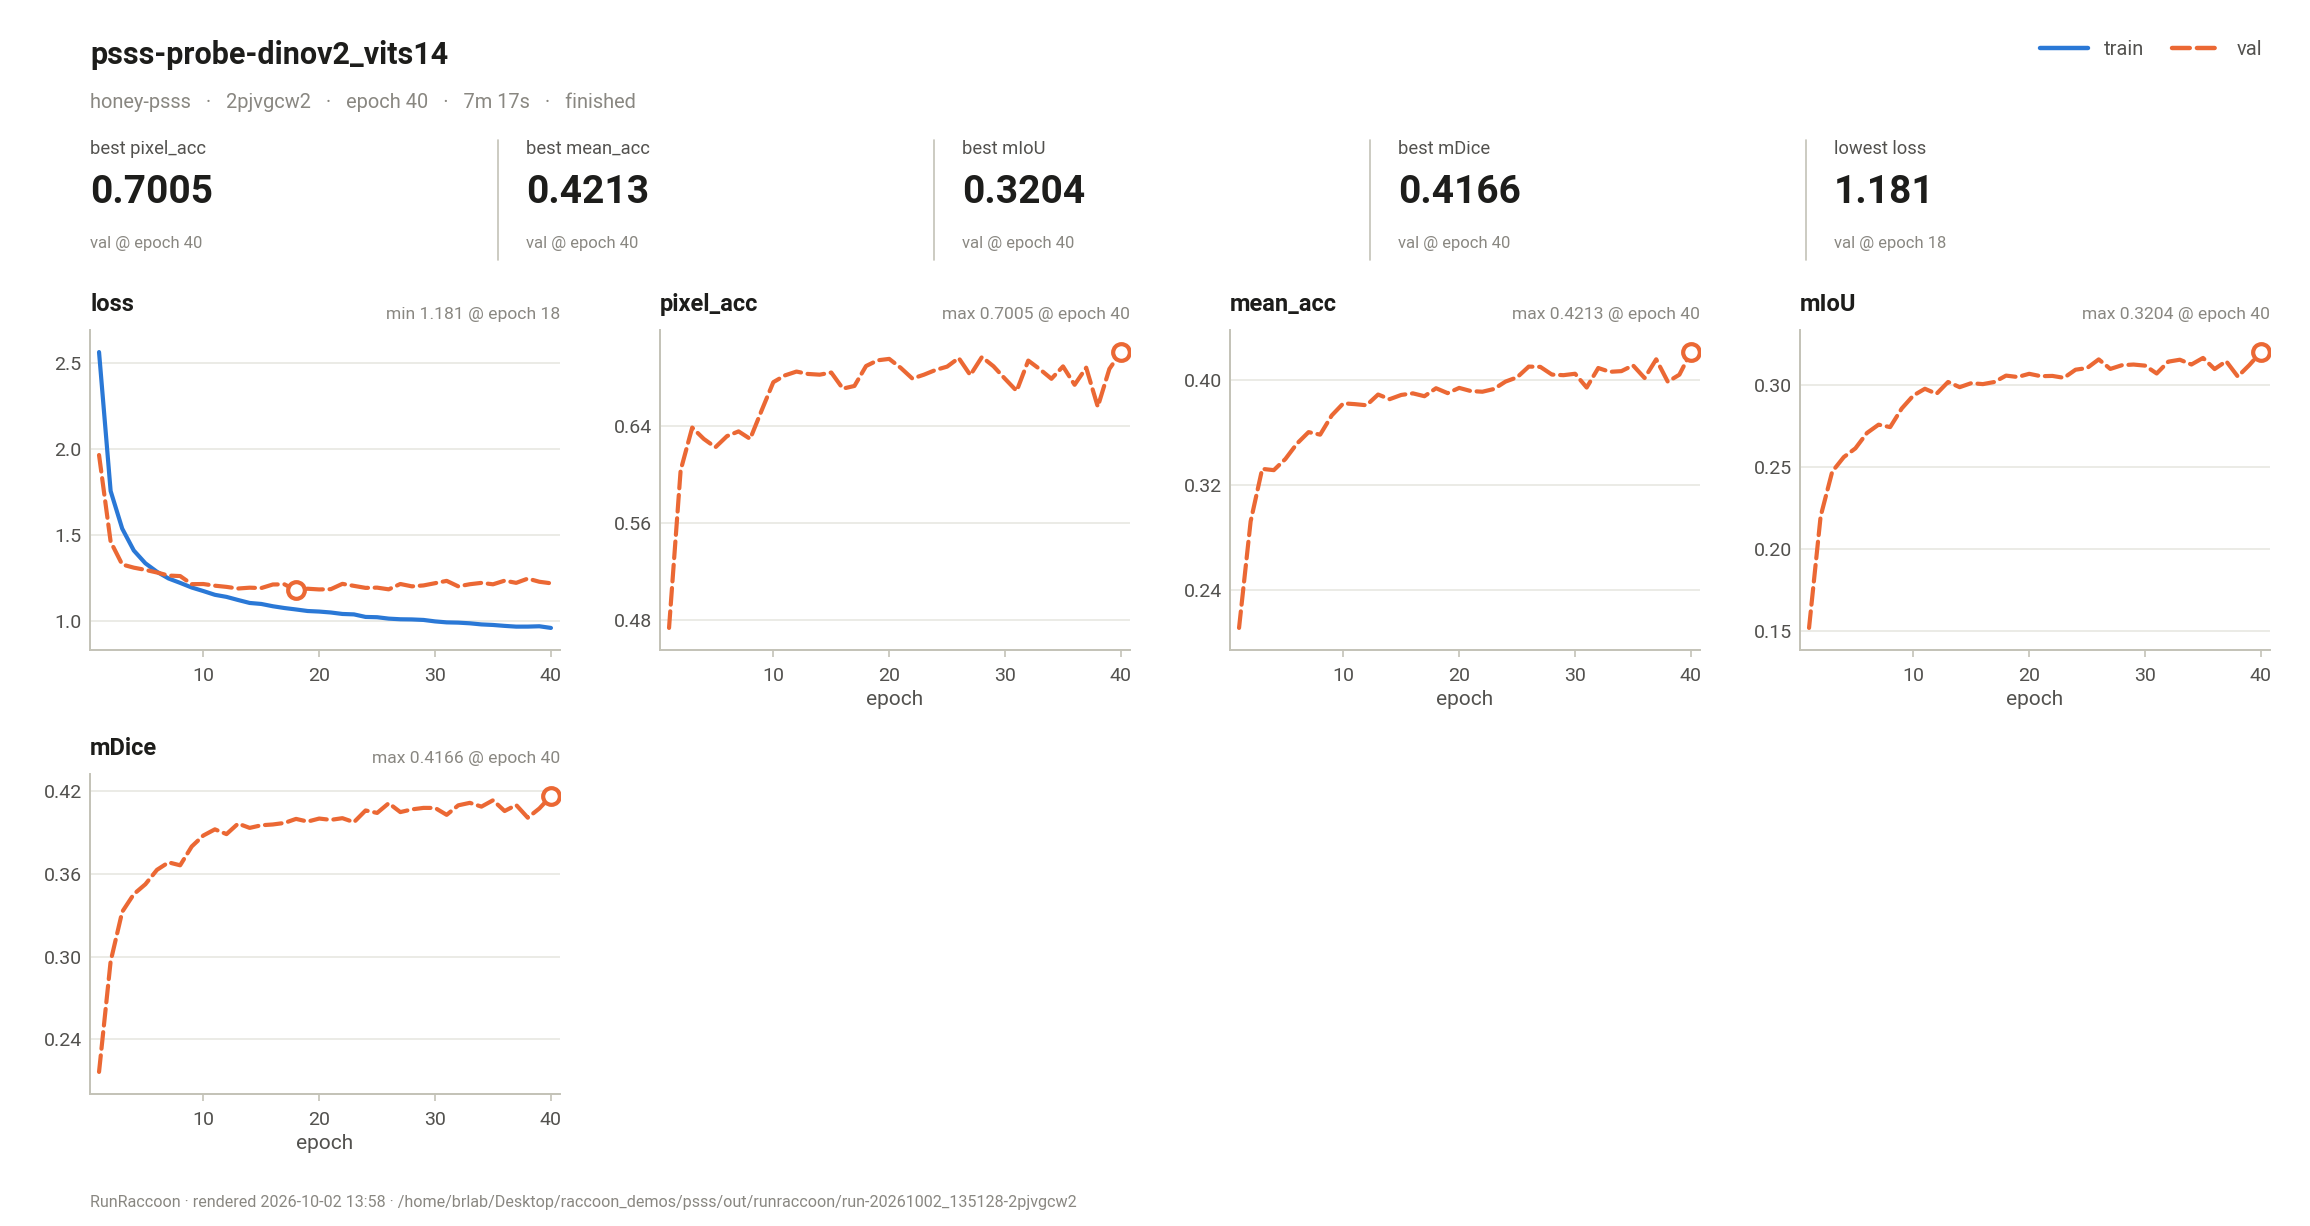 |
| LM3 UNet (wandb script, import changed) | 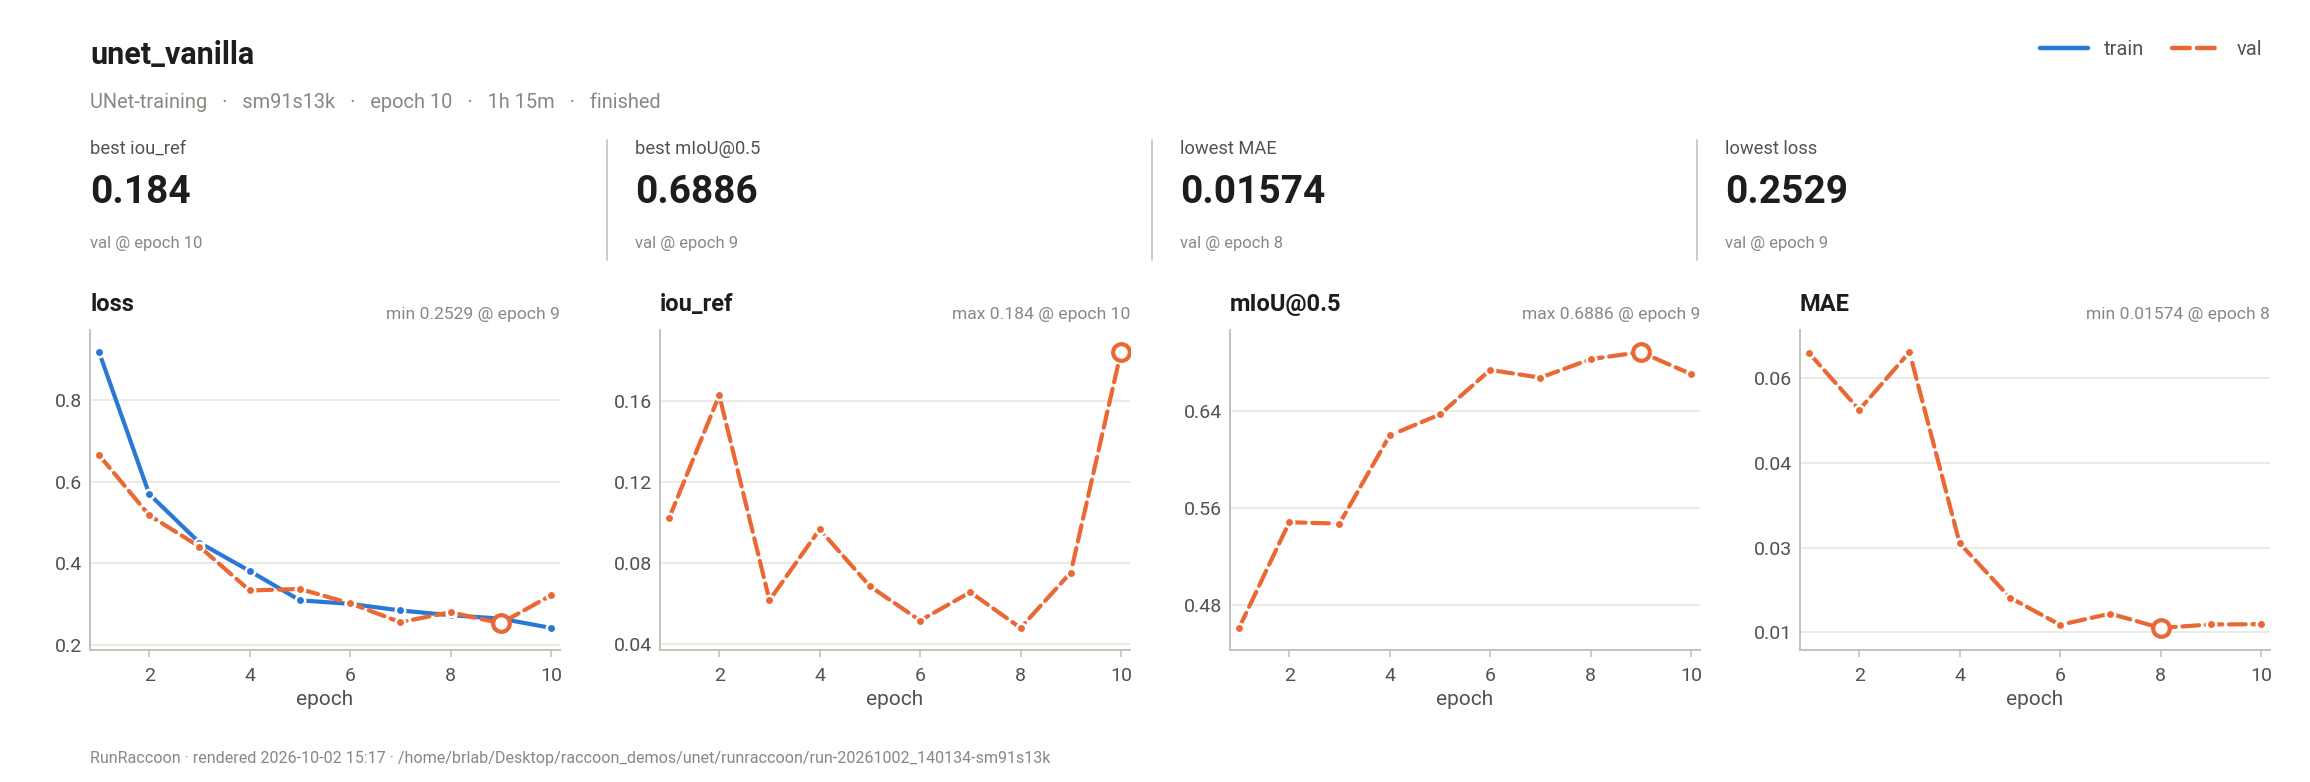 |
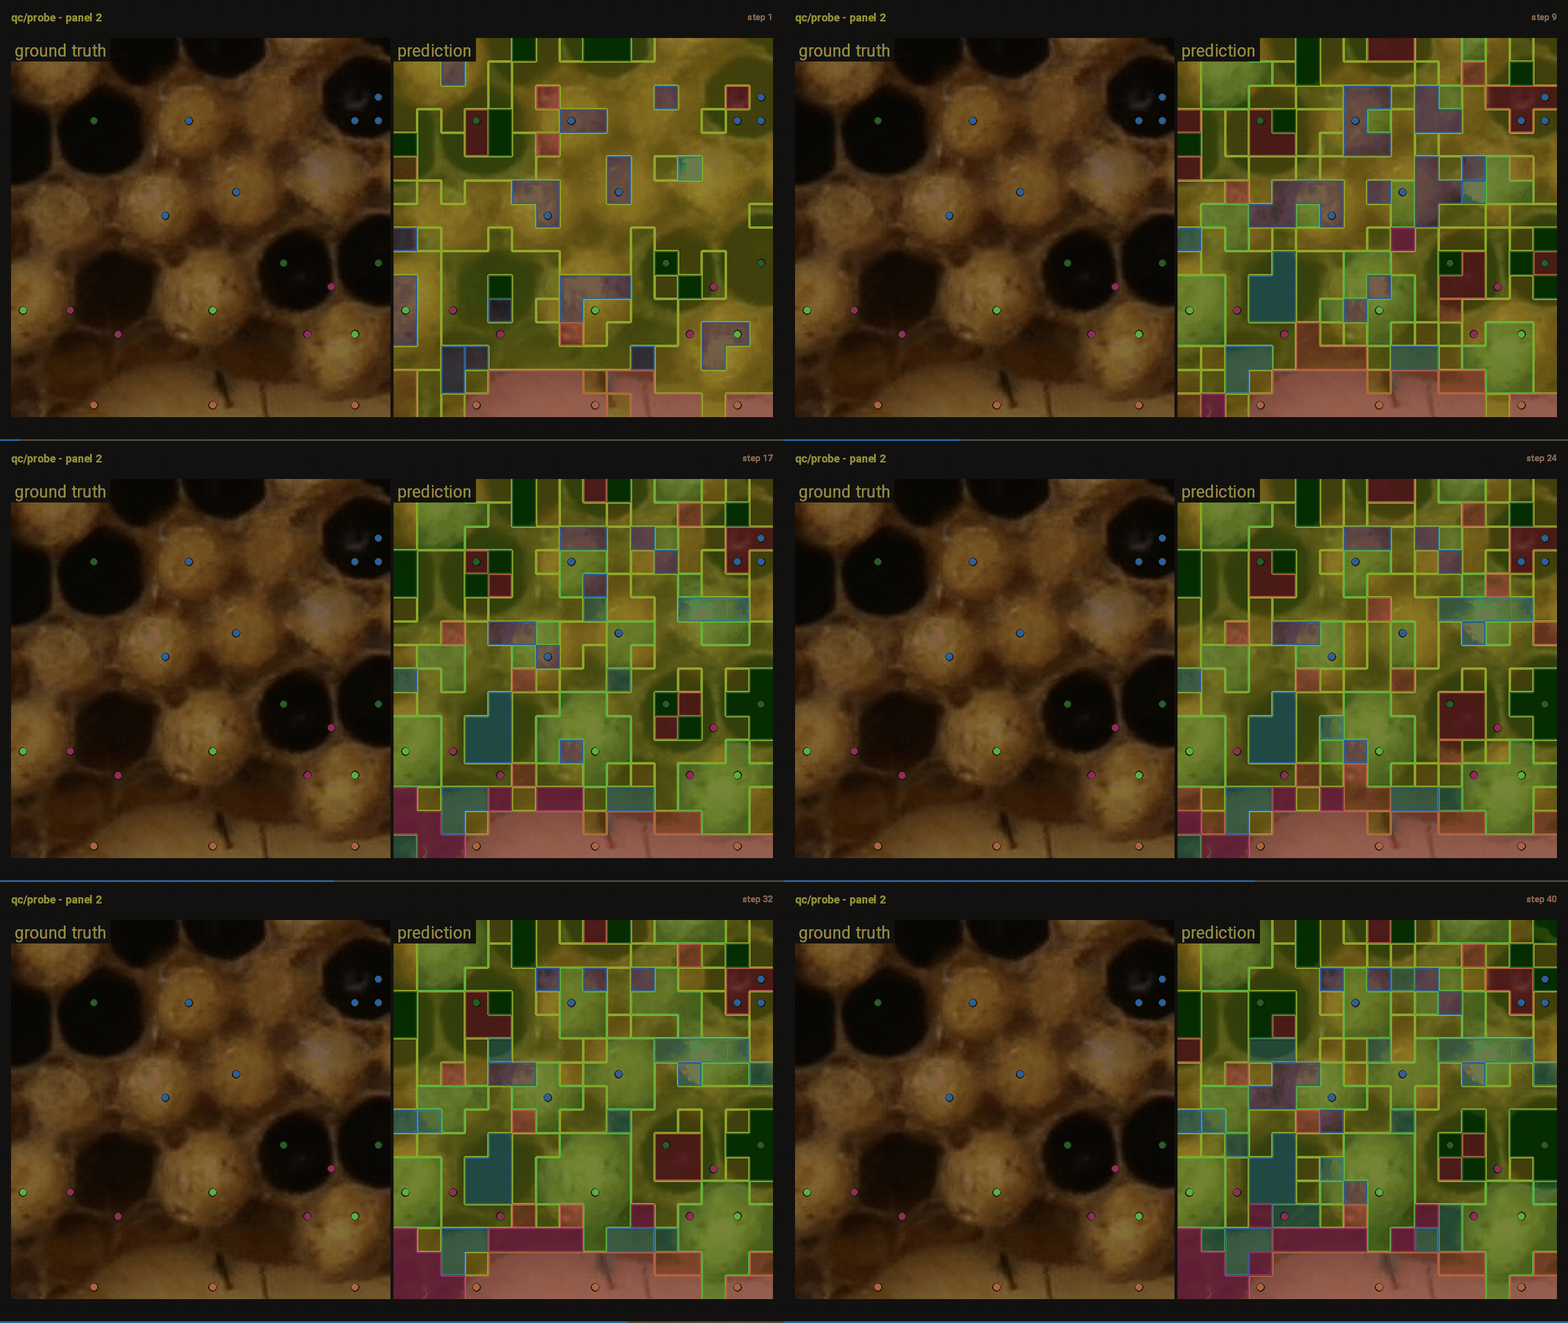
The probe learning one val tile: sparse labeled points on the left, the probe's patch-grid prediction on the right, one frame per epoch.
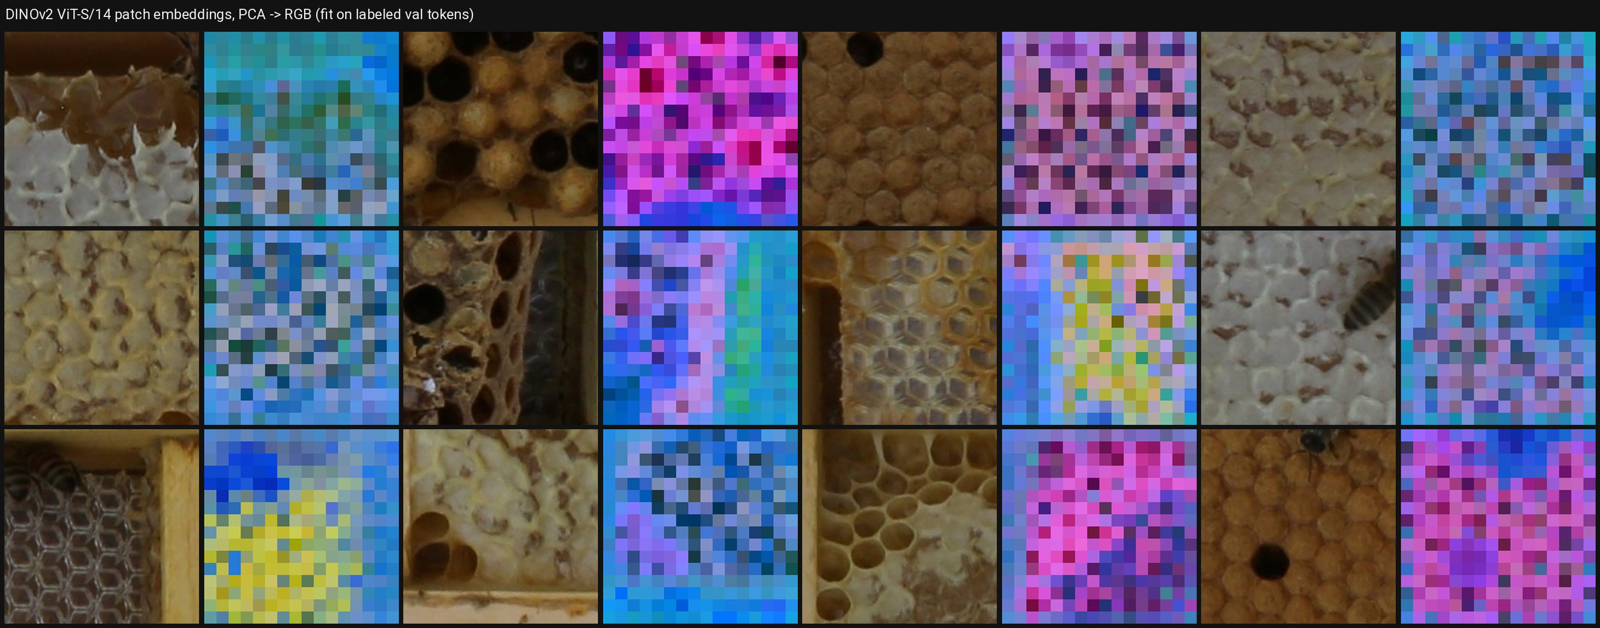
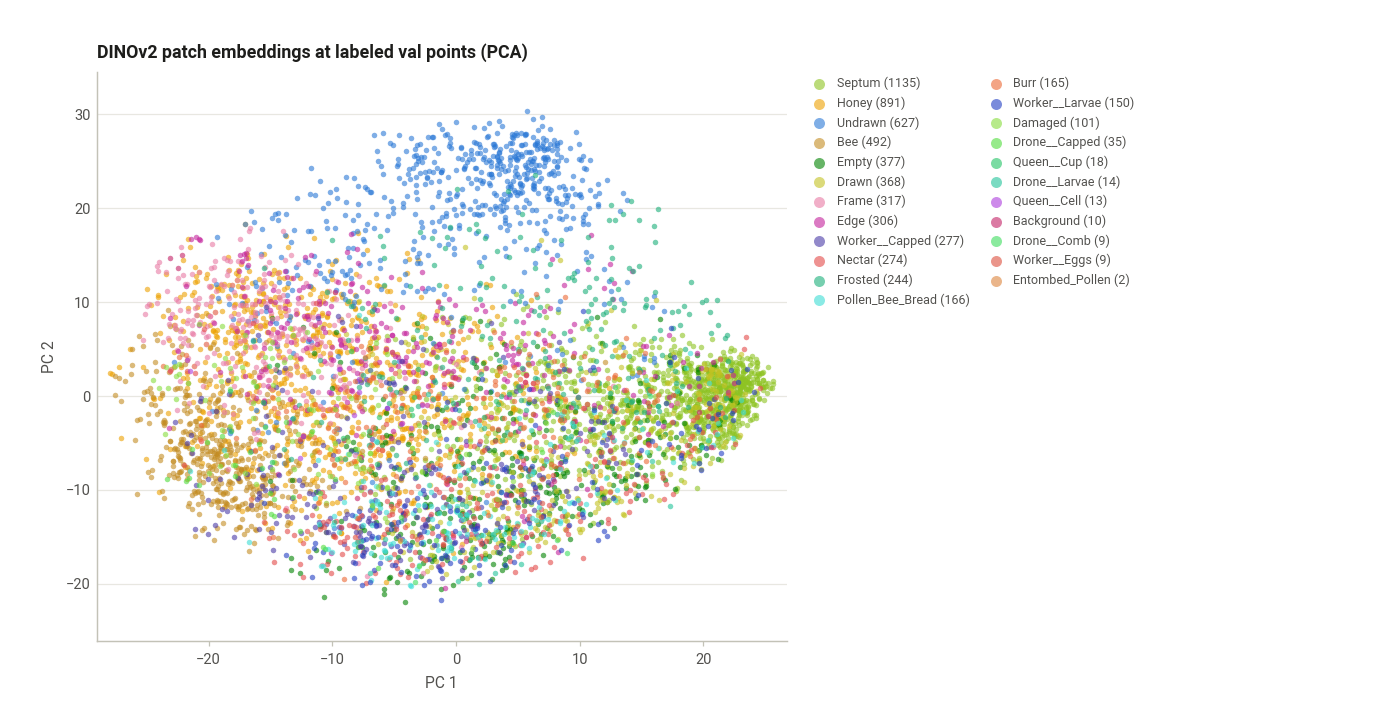
DINOv2 patch embeddings: PCA→RGB maps next to each tile, and labeled val points in 2-D (colors match the QC overlays).
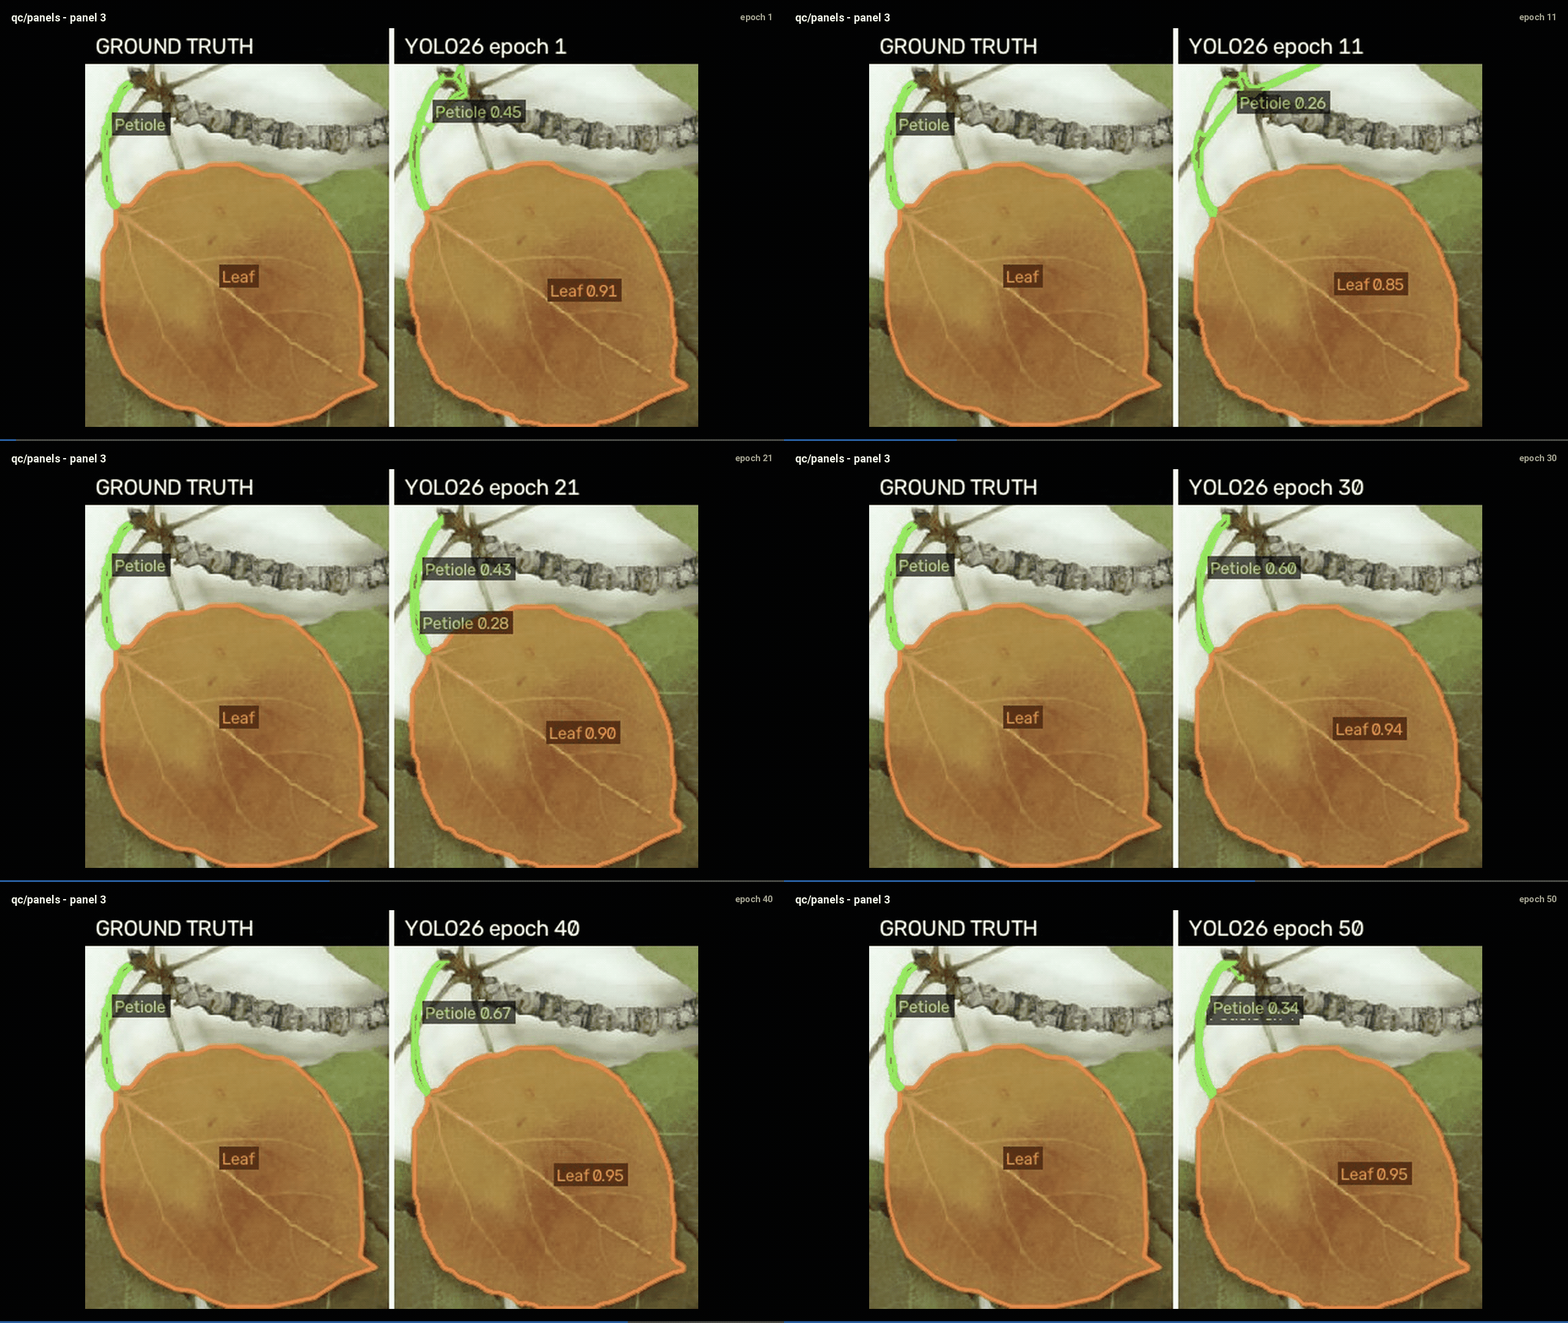
The training-progress GIF of one leaf segmentation QC image: ground truth on the left, prediction on the right, one frame per epoch.
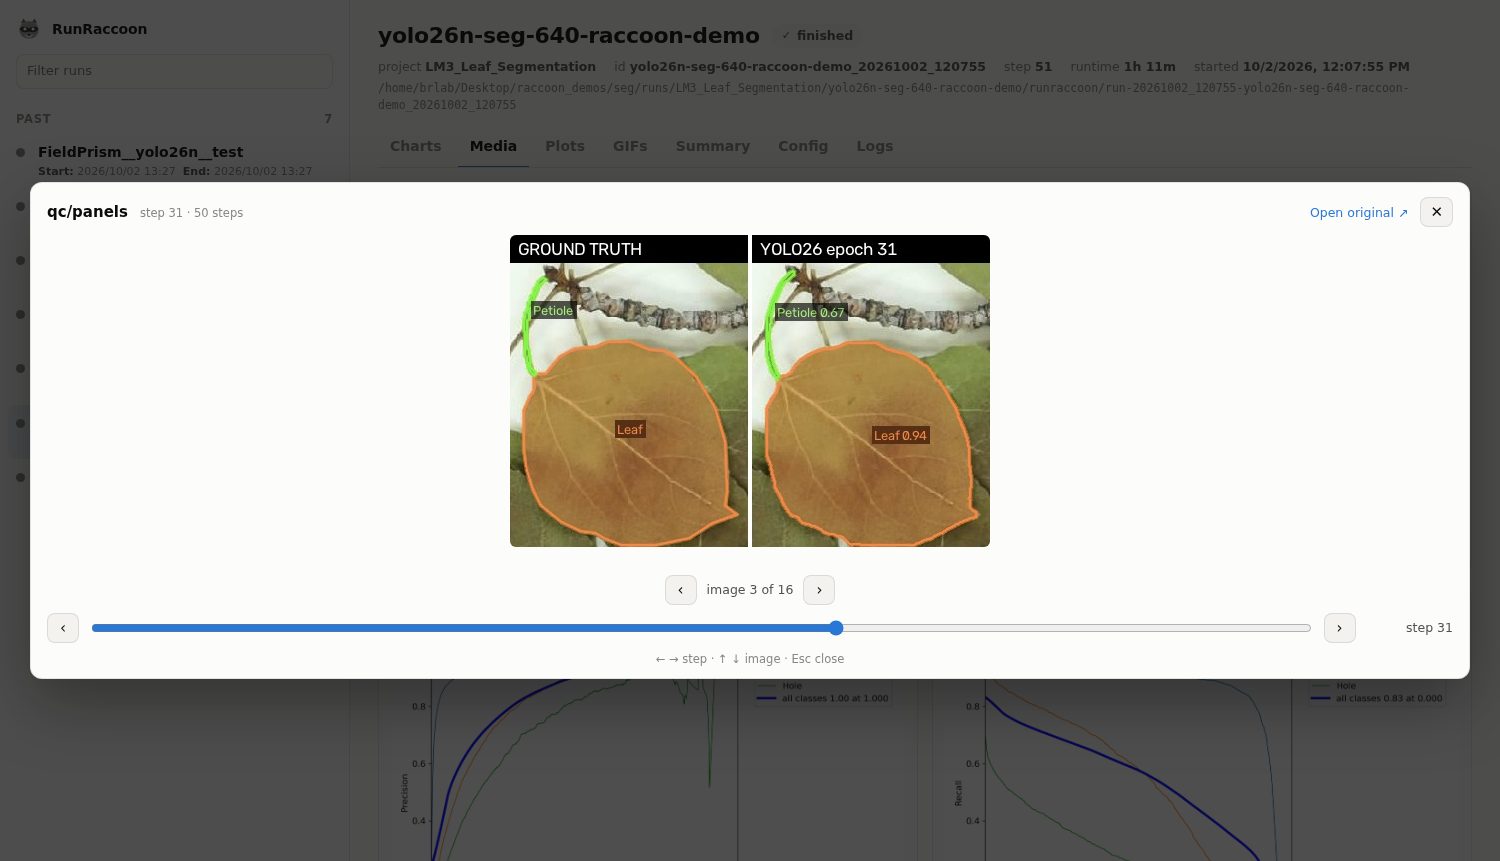
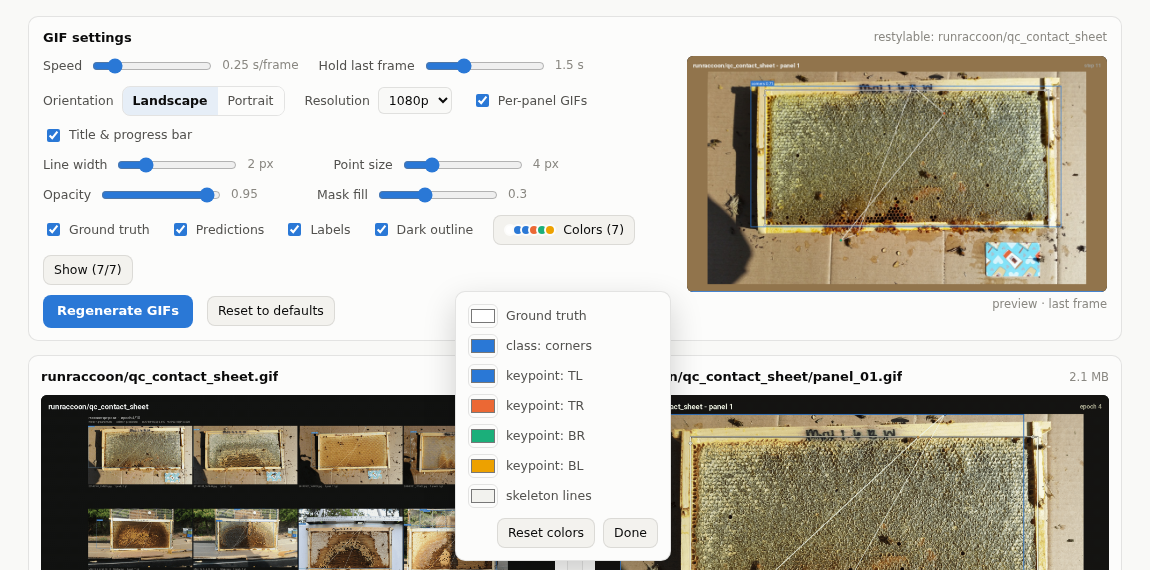
The popup image viewer (step slider, ←/→ steps, ↑/↓ images) and the GIF controller with its color picker:
What you get on disk
Runs go in a runraccoon/ folder inside the directory passed as init(dir=...). Without
dir, they go in the current working directory. Ultralytics passes its own output folder
(project/name), so YOLO runs land next to weights/ and results.csv.
Inside the run folder, the layout and file names are the same as wandb's:
<dir>/runraccoon/
├── debug.log                         -> latest run's logs/debug.log
├── latest-run                        -> run-20260924_083909-t0rb91yy
└── run-20260924_083909-t0rb91yy/
    ├── files/
    │   ├── config.yaml               wandb format: {key: {value: ...}}
    │   ├── wandb-summary.json        final / best value of every key
    │   ├── wandb-metadata.json       host, GPUs, git commit, argv, python, ...
    │   ├── wandb-history.jsonl       every logged step, one JSON object per line
    │   ├── output.log                captured stdout/stderr (progress bars collapsed)
    │   ├── requirements.txt          pip freeze of the environment
    │   ├── media/
    │   │   ├── images/<key>_<step>_<sha20>.<ext>        e.g. qc/contact_sheet_73_fff6edfaacd84552d328.jpg
    │   │   └── table/<key>_<step>_<sha20>.table.json    e.g. curves/F1-Confidence(B)_table_302_....table.json
    │   └── plots/                    <- RunRaccoon's figures (next section)
    ├── logs/debug.log, logs/plots.log
    └── artifacts/<name>/manifest.json
wandb stores history in a binary .wandb file. RunRaccoon writes wandb-history.jsonl
instead, the plain-text name older wandb versions used. You can open it with any tool, or
use plots/history.csv.
The figures
All figures go in files/plots/:
| File | When | What |
|---|---|---|
progress.png |
about once per epoch while training | The important metrics only: paired train/val/test losses, validation scores, your QC numbers. Learning rates, counters and model info are left out. |
summary/run_summary.png |
at finish() |
A report card: headline numbers on top (test results, best validation scores and the epoch they occurred), key curves below. |
summary/<section>.png |
at finish() |
Every chart, one figure per wandb panel section (loss, performance, metrics, lr, val_px, ...). |
charts/<key>.png |
when logged | Custom charts: wandb.plot.* and plot_table, e.g. Ultralytics' PR/F1 curves and confusion matrices. |
history.csv |
at finish() |
Every scalar, one row per step, for Excel / pandas / R. |
gifs/<key>.gif, gifs/<key>/panel_NN.gif |
at finish() |
Training-progress GIFs (next sections). |
How the plots are put together:
- Pairing.
train/loss,val/lossandtest/lossshare one panel, and so do Keras-styleloss/val_lossandtrain_acc/val_acc. - Colors and line styles. Train is blue solid, val is orange dashed, test is green dotted. The colors are checked to be colorblind-safe, and the dashes keep the figure readable in grayscale print. Curves with many points are drawn solid and thinner so dashes don't turn into noise.
- Best point. For each metric whose direction is known, the best value is circled and
labeled, e.g.
min 0.108 @ epoch 278. Losses and errors are minimized; accuracy, mAP, IoU, F1 and similar are maximized. You can override this withdefine_metric. - Scales. Losses that span more than ~30× switch to a log axis. Series longer than 400 points get light smoothing drawn over the faint raw line.
- Typography. Text stays in vector form in PDF/SVG output (
pdf.fonttype 42), so journal checks and Illustrator edits work. Addplot_formats=("png", "pdf")to get vector copies.
To re-render the figures at any time, for example after a crash or after changing settings:
runraccoon replot path/to/outputs/unet-baseline --formats png,pdf
QC contact sheets
A contact sheet shows the same validation images every epoch, so you can watch a model learn.
Ultralytics runs get one automatically. With RunRaccoon imported, after every validation
it predicts with the newest weights on 12 fixed val images and logs a grid as
runraccoon/qc_contact_sheet. Training code doesn't change. In each tile:
- ground truth is drawn as white outlines with a dark halo,
- predictions are drawn on top in per-class colors: boxes, masks, keypoints with their skeleton, and oriented boxes,
- a caption gives the image name and
N pred / M gt.
The header shows the epoch and mAP50-95. After training, one more sheet is made from
best.pt.
RunRaccoon also saves the overlay data each epoch (normalized boxes, polygons, keypoints)
next to the images. That is what lets the dashboard redraw the GIFs in another style later.
Set qc_sheet=False to turn it off; the other qc_* settings are in the table below.
Anything else: log a grid of your own images:
wandb.log({"qc/samples": runraccoon.ContactSheet(images, captions=names, title=f"epoch {epoch}")})
images can be file paths, PIL images, numpy arrays, or tensors. The sheet records where
each tile sits, so its per-panel GIFs are cut exactly.
Training-progress GIFs
When a run finishes, every image key logged at three or more steps becomes a GIF, one frame per step:
files/plots/gifs/<key>.gif                the whole image, e.g. the full contact sheet
files/plots/gifs/<key>/panel_01.gif ...   one GIF per panel of it
Frames. Every frame is exactly 1920×1080 (or 1080×1920 in portrait). Each one carries a small title, the step or epoch, and a progress bar along the bottom. Each step shows for 0.25 s, and the last frame is held for 1.5 s before the GIF loops.
Panels. Each item of an image list is a panel, and so is each tile of a contact sheet. RunRaccoon's own sheets record their tile positions. For sheets drawn by your own code, the tiles are found by detecting the background-colored gutters between them.
Size. The GIFs stay small: one 255-color palette per GIF, position-stable ordered dithering, light temporal denoising, and only the changed pixels stored per frame. In testing that came to about 4–5 MB for 50 frames at 1080p.
Speed. GIFs are built in parallel: one process per GIF, plus threads inside each for composing frames, building the palette, and quantizing. The worker budget defaults to max(physical cores, threads) − 2. The result is byte-identical to a single-threaded build; on a 32-core machine, 13 GIFs of 51 frames at 1080p take about 8 s instead of 106 s.
To make or remake them for any run:
runraccoon gif path/to/run --seconds 0.5 --orientation portrait --resolution 1080 --keys "qc/*"
In the dashboard, the GIFs tab has the same controls:
- speed, final-frame hold, orientation, resolution, and per-panel GIFs on or off;
- for RunRaccoon QC sheets, also line width, point size, opacity, mask fill, ground truth / predictions / labels on or off, and a color for every class, keypoint, skeleton, and the ground truth.
A live preview updates as you change settings, and Regenerate GIFs rebuilds them with a progress bar.
The dashboard
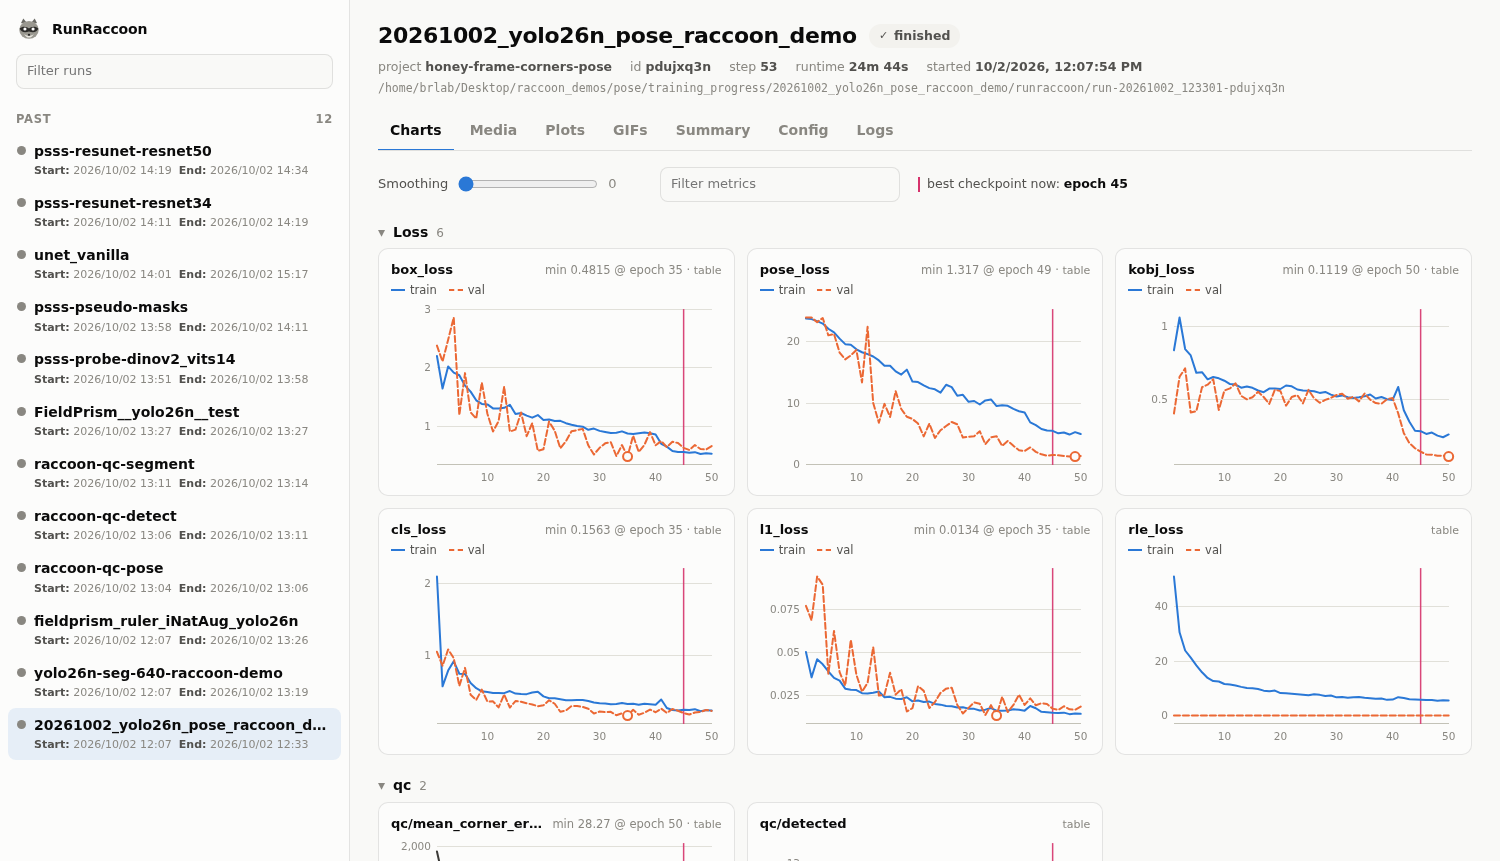
The first run on the machine starts a small server on http://127.0.0.1:8473 (localhost only).
Every later run, in any process or environment, registers with it.
Left panel
- Active lists every run currently training, so several GPUs or jobs each get their own entry.
- Past lists finished, failed, and crashed runs.
- Each run shows
Start: YYYY/MM/DD HH:MM End: …, orestEnd: …while training. The estimate appears once the first epoch, including its validation, has finished. It projects the remaining epochs from the median duration of recent epochs.
Tabs for the selected run
- Charts: the same panels as the figures, with hover tooltips, a smoothing slider, a
metric filter, and a table view on every chart. Live runs update every few seconds.
- A magenta line marks the best checkpoint so far, and it moves whenever a later step
becomes the best. It follows, in order: a metric you declare with
define_metric(key, summary="min"|"max"); Ultralytics' ownbest.ptrule; or the lowestval/loss. - The Ultralytics rule depends on the version: from 8.3.198 on it is mAP50-95 summed over
box and mask/pose; before that, 0.1·mAP50 + 0.9·mAP50-95. RunRaccoon reads the version
from the run's
requirements.txt.
- A magenta line marks the best checkpoint so far, and it moves whenever a later step
becomes the best. It follows, in order: a metric you declare with
- Media: every logged image with a step slider, like wandb's image panels.
- Plots: the rendered PNGs from
files/plots/. - GIFs: the training-progress GIFs, autoplaying, with the controller described above.
- Popup viewer: clicking any image opens it large. The step slider comes along, ←/→ change steps, ↑/↓ change images within a step, and Esc closes it.
- Summary / Config: searchable key/value tables.
- Logs: the tail of
output.log.
The auto-started server shuts itself down after an hour with no active runs. To browse past runs at any time:
runraccoon dashboard # opens your browser
The dashboard follows your system's light/dark setting. Set RUNRACCOON_DASHBOARD=0 to turn
off the auto-start.
Ultralytics / YOLO
Ultralytics' wandb callback runs import wandb internally. Importing RunRaccoon registers it
as the wandb module, so the callback logs to RunRaccoon instead:
- per-epoch losses, metrics and learning rates,
train_batch*.jpg,val_batch*_pred.jpg,labels.jpgandresults.png,- confusion matrices and PR/F1/P/R curves (saved as tables and rendered to
plots/charts/), - the best weights, recorded as an artifact manifest.
import runraccoon as wandb          # before model.train()
from ultralytics import YOLO, settings

settings.update({"wandb": True})
YOLO("yolo11n.pt").train(data="coco8.yaml", epochs=10, project="runs", name="exp")
Ultralytics' YOLO resume=True looks for a previous run in save_dir/wandb/latest-run. With
the runraccoon/ folder, a resumed YOLO training therefore starts a new RunRaccoon run instead
of appending to the old one. Calling wandb.init(id=..., resume="must") yourself is not
affected. Set RUNRACCOON_DIRNAME=wandb if you need Ultralytics' automatic resume to find the
earlier run.
Importing RunRaccoon also sets WANDB_MODE=disabled for child processes. If something
launches the real wandb in a subprocess, such as multi-GPU DDP workers, it stays offline.
PyTorch, DINOv2 and UNet (semantic segmentation)
Hand-written training loops have no callbacks to hook into, so RunRaccoon provides helpers that produce the same outputs an Ultralytics run gets. Each needs a line or two in the loop.
import runraccoon as wandb
from runraccoon.integrations.segmentation import SegMetrics, semantic_qc_sheet
from runraccoon.integrations.dino import EmbeddingPCA, pca_scatter

wandb.init(project="leaf-seg", name="resunet34", config=cfg)
wandb.define_metric("val/mIoU", summary="max")       # the dashboard's best-checkpoint line follows it

metrics = SegMetrics(num_classes, class_names, ignore_index=255)
for epoch in range(1, epochs + 1):
    ...train...
    metrics.reset()
    for images, masks in val_loader:
        metrics.update(model(images), masks)          # logits (N,C,H,W) or label maps
    wandb.log({"train/loss": loss, "qc/val": semantic_qc_sheet(qc_images, qc_masks, qc_preds, class_names,
                                                               mean=IMAGENET_MEAN, std=IMAGENET_STD)},
              step=epoch, commit=False)
    metrics.log(prefix="val", step=epoch)             # val/mIoU, val/pixel_acc, val/mDice, val/mean_acc + charts
What you get:
- Metrics:
SegMetricsaccumulates a confusion matrix and logs pixel accuracy, mean class accuracy, mIoU and mean Dice. It also logs a per-class IoU bar chart and a row-normalized confusion matrix, rendered toplots/charts/. - QC sheets:
semantic_qc_sheetmakes a contact sheet with ground truth and prediction side by side for each tile. Label maps are stored as small PNGs, so the GIF controller can change every class's color, hide classes, and change line width and fill opacity. More than 8 classes get extra distinct hues automatically. - Weak supervision: when the only ground truth is sparse points, pass the predictions at those
points (
metrics.update(pred_at_points, point_labels)) and givesemantic_qc_sheetthe points (points=[[(x, y, class), ...], ...]). The points are drawn as class-colored dots on both halves. - DINOv2 embeddings:
EmbeddingPCA().fit(tokens)turns patch tokens (backbone.forward_features(x)["x_norm_patchtokens"]) into PCA→RGB maps withpca.sheet(...). The PCA is fit once, so colors stay stable across epochs and a fine-tuned backbone makes a meaningful GIF.pca_scatter(tokens, labels, class_names)plots labeled embeddings in 2-D, one color per class.
examples/semantic_segmentation.py runs the whole thing with
numpy only.
Example: the Honey weak-supervision pipeline. The Honey PSSS trainer
(train_psss_Dinov2_CRF_allResNetOptions.py) has three stages:
- A frozen DINOv2 ViT-S/14 linear probe, trained on sparse points.
- Pseudo-masks from that probe, refined with CRF.
- A ResUNet sweep, trained on the pseudo-masks.
Instrumented with these helpers, it logs one run per stage, grouped together:
| Stage | What is logged |
|---|---|
| Probe | Train/val loss. Val mIoU, accuracy and Dice on the val split's labeled points. Per-class IoU and confusion charts. A per-epoch QC sheet (points vs. the probe's patch-grid prediction). DINOv2 PCA maps and the labeled-embedding scatter. |
| Pseudo-masks | A sheet of pseudo-masks, the fraction of pixels per class, and the count and time. |
| Each ResUNet | Train loss. Val metrics on the labeled points. A per-epoch QC sheet. |
Most scripts need only the import change. For example, here is
Honey/annotation_app_build/train_yolo26_pose.py:
-        import wandb
+        import runraccoon as wandb
Everything else in that script works unchanged:
wandb.init(..., dir=run_dir),- the custom
EpochQCcallback loggingqc/contact_sheetimages andval_px/*atstep=epoch, - Ultralytics finishing the run, then
wandb.init(id=..., resume="must")reopening it to addtest/*to the summary.
Resuming creates a new run-<time>-<same id> directory, as wandb does. RunRaccoon carries the
earlier history and media into it, so the figures cover the whole run.
To switch every script in an environment without editing each import, add this near the start of your entry point:
import runraccoon # noqa: F401 (registers itself as `wandb`)
From then on, any import wandb in that process returns RunRaccoon.
API compatibility
| wandb | RunRaccoon |
|---|---|
init(project, name, config, dir, id, group, job_type, tags, notes, resume, reinit, mode, settings, ...) |
✓ (entity and cloud-only options are accepted and ignored) |
log(data, step=, commit=) |
✓ same step semantics; a late write to an already-committed step is kept, where wandb would drop it |
run.config, wandb.config.update(...), argparse Namespace |
✓ |
run.summary[...], summary.update(...) |
✓ |
define_metric(name, step_metric=, summary=, goal=, hidden=) |
✓ also controls the plots (x-axis, best marker, hidden) |
Image (path, PIL, numpy HW/HWC/CHW, torch tensor, matplotlib figure; caption) |
✓ (boxes=/masks= overlays are accepted but not drawn) |
lists of Image under one key |
✓ (images/separated, as wandb) |
Table, plot.line, plot.line_series, plot.scatter, plot.bar, plot.histogram, plot.pr_curve, plot.roc_curve, plot.confusion_matrix, plot_table |
✓ saved as tables and rendered to PNG |
Histogram, raw arrays |
✓ stored in history (not plotted) |
runraccoon.ContactSheet(images, captions=...) |
RunRaccoon addition: a captioned grid of images that records its tile positions |
Artifact, log_artifact, log_model |
✓ local manifest (files referenced, optionally copied) |
save(glob), alert, finish(exit_code), run.dir, run.id, run.name, run.step, context manager |
✓ |
login, watch, unwatch, Settings(...) |
accepted, no-op |
Video, Audio, Html |
✓ from a file path |
Api(), use_artifact(...).download() from a server, sweeps, reports |
✗ local-only; these raise a clear error |
Settings and environment variables
Pass settings in code with wandb.init(settings=wandb.Settings(plot_every_s=30)) (or a plain
dict), or set them through the environment:
| Setting | Env var | Default | Meaning |
|---|---|---|---|
dashboard |
RUNRACCOON_DASHBOARD |
1 |
auto-start the localhost dashboard |
dashboard_port |
RUNRACCOON_PORT |
8473 |
dashboard port (also used by runraccoon dashboard) |
live_plots |
RUNRACCOON_LIVE_PLOTS |
1 |
refresh progress.png during training |
plot_every_s |
RUNRACCOON_PLOT_EVERY_S |
10 |
minimum seconds between refreshes (at most once per epoch either way) |
final_plots |
RUNRACCOON_FINAL_PLOTS |
1 |
render the summary figures in finish() |
plot_formats |
RUNRACCOON_PLOT_FORMATS |
png |
e.g. png,pdf,svg for the final figures |
live_metrics |
RUNRACCOON_LIVE_METRICS |
auto | glob patterns choosing the progress-plot metrics, e.g. train/*,val/* |
dirname |
RUNRACCOON_DIRNAME |
runraccoon |
name of the run folder created inside the output dir |
console |
RUNRACCOON_CONSOLE |
wrap |
off to skip output.log capture |
artifact_copy |
RUNRACCOON_ARTIFACT_COPY |
0 |
copy artifact files instead of referencing them |
quiet |
RUNRACCOON_QUIET |
0 |
silence RunRaccoon's console messages |
gifs |
RUNRACCOON_GIFS |
1 |
make training-progress GIFs in finish() |
gif_seconds_per_frame |
RUNRACCOON_GIF_SECONDS |
0.25 |
time each step is shown |
gif_orientation |
RUNRACCOON_GIF_ORIENTATION |
landscape |
landscape (1920×1080) or portrait (1080×1920) |
gif_resolution |
RUNRACCOON_GIF_RESOLUTION |
1080 |
short side of every frame, px |
gif_hold_last_s |
RUNRACCOON_GIF_HOLD |
1.5 |
pause on the final frame before looping |
gif_panels |
RUNRACCOON_GIF_PANELS |
1 |
also one GIF per panel |
gif_label |
RUNRACCOON_GIF_LABEL |
1 |
title, step and progress bar on each frame |
gif_keys |
RUNRACCOON_GIF_KEYS |
all | glob patterns of image keys to animate |
gif_workers |
RUNRACCOON_GIF_WORKERS |
cores/threads − 2 | parallel workers for GIF building |
qc_sheet |
RUNRACCOON_QC_SHEET |
1 |
automatic QC contact sheet for Ultralytics training |
qc_images |
RUNRACCOON_QC_IMAGES |
12 |
number of fixed val images |
qc_every |
RUNRACCOON_QC_EVERY |
1 |
every N epochs (the last epoch always) |
qc_cols / qc_tile_px |
RUNRACCOON_QC_COLS / _TILE_PX |
4 / 720 |
grid columns, tile width |
qc_conf |
RUNRACCOON_QC_CONF |
0.25 |
prediction confidence threshold |
qc_key |
RUNRACCOON_QC_KEY |
runraccoon/qc_contact_sheet |
media key of the sheet |
RUNRACCOON_HOME |
~/.runraccoon |
where the run index and dashboard log live | |
RUNRACCOON_SHIM |
1 |
0 to stop import runraccoon from registering as wandb |
The usual wandb variables are honored as defaults: WANDB_PROJECT, WANDB_NAME,
WANDB_RUN_ID, WANDB_RUN_GROUP, WANDB_JOB_TYPE, WANDB_TAGS, WANDB_NOTES, WANDB_DIR,
WANDB_RESUME, and WANDB_MODE=disabled, which turns logging off entirely.
Command line
runraccoon dashboard [--port 8473]     open the dashboard (all runs, live + past)
runraccoon ls [--all]                  list runs and their status
runraccoon replot <run dir | id>       re-render every figure for a run  [--formats png,pdf]
runraccoon register <folder>...        add existing/moved run folders to the dashboard
runraccoon forget <id>...              remove runs from the dashboard index (files are kept)
runraccoon gc                          forget runs whose folders were deleted
runraccoon gif <run dir | id>          (re)make training-progress GIFs  [--seconds --orientation --resolution --keys ...]
python -m runraccoon ... works the same way.
How it works
 training script                      runraccoon/run-<time>-<id>/files/
 runraccoon.init / log  ── appends ─▶  history · summary · config · media
        │                                     ▲              ▲
        │ spawns ≤ 1× per epoch               │ reads        │ reads
        ▼                                     │              │
 renderer subprocess (matplotlib) ────────────┘              │
        │ writes files/plots/*.png                           │
        │                                                    │
        └ heartbeat ─▶ ~/.runraccoon/runs/<id>.json ◀─ reads ─ dashboard server
                                                              127.0.0.1:8473
- The training process only writes files. Media is hashed and written when logged, and history rows are appended as each step is committed. Plotting runs in a short-lived subprocess, so it never competes with training for the GIL and never touches your script's matplotlib state.
- One module decides what gets plotted.
runraccoon/panels.pyhandles key pairing, sections, the x-axis, and the better direction. The PNG renderer and the dashboard both use it, so they always agree. - The dashboard is read-only. It reads the same files and the per-run heartbeat records. It therefore works across processes, Python environments, and runs that crashed.
The code is organized by job:
| Module | Job |
|---|---|
sdk.py |
Module-level wandb.* functions |
run.py |
The Run class and step semantics |
media.py |
Image, Table, ... |
plot.py |
wandb.plot |
paths.py |
Directory layout |
reader.py |
Reading a run back from disk |
registry.py |
The machine-wide run index |
plotting/ |
Style, figures, renderer, scheduler, GIFs |
qc.py |
Contact sheets and restyleable QC overlays |
integrations/ultralytics.py |
The automatic per-epoch QC sheet for Ultralytics |
dashboard/ |
Server and static app |
Limitations
- Nothing is uploaded, ever. No sweeps, reports, team sharing, or
wandb.Api(). - Image overlays (
boxes=,masks=) are not drawn. Render them into the image before logging. - System metrics (GPU utilization over time) are not tracked. The GPU model and count are
recorded in
wandb-metadata.json. output.logcaptures Python-levelprint/logging. Output written directly by C extensions to file descriptor 1/2 is not captured.- If the real
wandbwas imported before RunRaccoon, code already holding that module is not redirected (RunRaccoon prints a warning). Import RunRaccoon first.
Development
pip install -e ".[dev]"
pytest
Tests cover the on-disk layout, step semantics, media naming, resume, metric pairing, rendering, and the dashboard API.
Releasing to PyPI
The release flow matches VoucherVisionGO-client: setup.py holds the package metadata, and
builds go to dist/, which is gitignored.
- Bump
__version__inrunraccoon/_version.py. This is the only place the version lives;setup.pyandrunraccoon.__version__both read it. - Add an entry to
CHANGELOG.md. - Build and upload:
pip install build twine            # once
python -m build
python -m twine upload dist/* --skip-existing --verbose
--skip-existing lets dist/ keep older builds without twine failing on versions already
on PyPI. Twine asks for credentials: use __token__ as the username and a PyPI API token as
the password, or put them in ~/.pypirc.
Before the first upload you can rehearse on TestPyPI with
python -m twine upload --repository testpypi dist/*.
License: MIT.
1 maintainer

Metadata
1 maintainer
Release files for runraccoon 0.1.2
For a detailed explanation of source distributions (sdists) and built distributions (wheels), please see the package formats documentation.
Source distribution (sdist)
| File | Size | Uploaded | |
|---|---|---|---|
| runraccoon-0.1.2.tar.gz | 154.7 kB | Details |
Built distribution (wheel)
| File | Interpreter | ABI | Platform | Reset |
|---|---|---|---|---|
| runraccoon-0.1.2-py3-none-any.whl | Python 3 | none | any | Details |
Total release size: 286.0 kB
Release files / runraccoon-0.1.2.tar.gz
| Download URL | runraccoon-0.1.2.tar.gz |
|---|---|
| Size | 154.7 kB |
| Tags | Source |
|
SHA-256 checksum How to use checksums |
1add525ee7ac1a0a5392fbe5ec00ca5a96ac3a756545a6f5f42f0a90068294b4
|
|
BLAKE2b-256 checksum How to use checksums |
7ec2c3b1abafe35f0ea9dd7ccd00c69a8c8d82280cdd307c989f1b3e801734d9
|
| Upload date | |
|
Uploaded using Trusted Publishing? What is trusted publishing? |
No |
| Uploaded via |
twine/7.0.0 CPython/3.11.5
|
Release files / runraccoon-0.1.2-py3-none-any.whl
| Download URL | runraccoon-0.1.2-py3-none-any.whl |
|---|---|
| Size | 131.3 kB |
| Tags | Python 3 |
|
SHA-256 checksum How to use checksums |
e2e4d535d776f4a94c77456d2a6be2f361a02f3762848e2b4f34676b3f6b218d
|
|
BLAKE2b-256 checksum How to use checksums |
dec7ebcfc96e00f7431580748428dad3a9cf4aeea53930f8b1fa5e4224a76e3d
|
| Upload date | |
|
Uploaded using Trusted Publishing? What is trusted publishing? |
No |
| Uploaded via |
twine/7.0.0 CPython/3.11.5
|














