
Supervised Spatial Single-Cell Image Analysis for identification of disease associated cell type composition in the tissue microenvironment

Project description
S3-CIMA
Supervised Spatial Single-Cell Image Analysis for identification of disease associated cell type composition in the tissue microenvironment
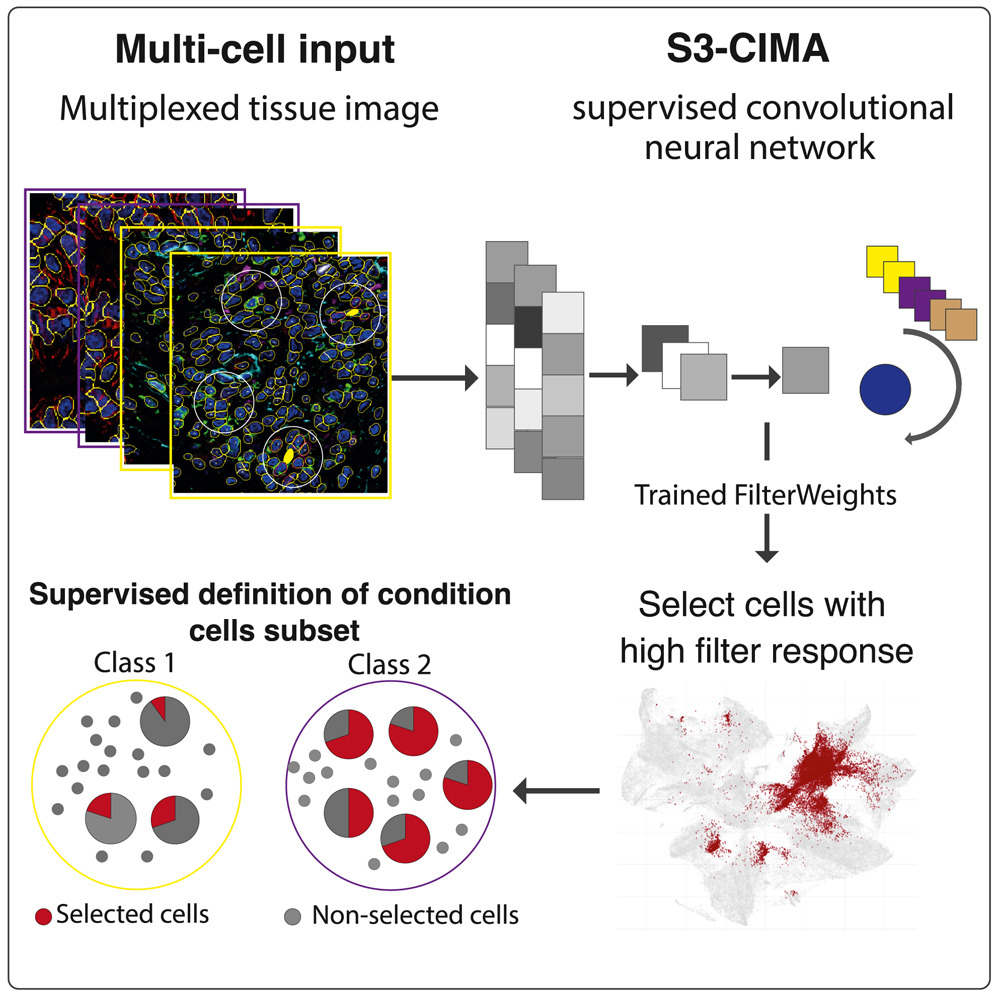
S3-CIMA implements a weakly supervised CNN model to identify cell subsets whose frequency distinguishes the considered phenotype labels (i.e., disease associated conditions). The model is adopted from the CellCNN model (Arvaniti and Claassen, 2017), comprising a single layer CNN, a pooling layer and a classification or regression output, and using groups of cell expression profiles (multi-cell inputs) as input.
Usage
Examples are provided in S3CIMA_example.ipynb. Further guidance to be added soon.
run_scima log file
The model training parameters and outputs is written in a log file including:
• Best model validation accuracy
• std of validation accuracies across models
• multi-cell inputs size
• Accuracy score on the test set
• Anchor
• nset which is the number of anchor cell in each image.
plot_results output:
• clustered_filter_weights.pdf:
Filter weight vectors from all trained networks that pass a validation accuracy threshold, grouped in clusters via hierarchical clustering. Each row corresponds to a filter. The last column(s) indicate the weight(s) connecting each filter to the output class(es). Indices on the y-axis indicate the filter cluster memberships, as a result of the hierarchical clustering procedure. This plot generates from the CellCNN model.
• consensus_filter_weights.pdf : One representative filter per cluster is chosen (the filter with minimum distance to all other members of the cluster). This plot generates from the CellCNN model.
• best_net_weights.pdf :
Filter weight vectors of the network that achieved the highest validation accuracy. This plot generates from the CellCNN model.
• filter_response_differences.pdf :
Difference in cell filter response between classes for each consensus filter. To compute this difference for a filter, we first choose a filter-specific class, that's the class with highest output weight connection to the filter. Then we compute the average cell filter response (value after the pooling layer) for validation samples belonging to the filter-specific class (v1) and the average cell filter response for validation samples not belonging to the filter-specific class (v0). The difference is computed as v1 - v0. For regression problems, we cannot compute a difference between classes. Instead we compute Kendall's rank correlation coefficient between the predictions of each individual filter (value after the pooling layer) and the true response values. This plot helps decide on a cutoff (filter_diff_thres parameter) for selecting discriminative filters. This plot generates from the CellCNN model.
• cdf_filter_i.pdf :
Cumulative distribution function of cell filter response for filter i. This plot helps decide on a cutoff (filter_response_thres parameter) for selecting the responding cell population. This plot generates from the CellCNN model.
• g.txt
A one-column text File indicating the corresponding filter response for each cell of the input data.
Citation
If you use S3-CIMA in your research, please cite our paper:
Sepideh Babaei, Jonathan Christ, Vivek Sehra, Ahmad Makky, Mohammed Zidane, Kilian Wistuba-Hamprecht, Christian M. Schürch, Manfred Claassen, S3-CIMA: Supervised spatial single-cell image analysis for identifying disease-associated cell-type compositions in tissue, Patterns, Volume 4, Issue 9, 2023, 100829, ISSN 2666-3899, https://doi.org/10.1016/j.patter.2023.100829.
License
S3-CIMA is released under the MIT License. See the LICENSE file for more details.
Release history Release notifications | RSS feed


Download files
Download the file for your platform. If you're not sure which to choose, learn more about installing packages.
Source Distribution
Built Distribution
Filter files by name, interpreter, ABI, and platform.
If you're not sure about the file name format, learn more about wheel file names.
Copy a direct link to the current filters
File details
Details for the file s3cima-0.1.7.tar.gz.
File metadata
- Download URL: s3cima-0.1.7.tar.gz
- Upload date:
- Size: 19.3 kB
- Tags: Source
- Uploaded using Trusted Publishing? No
- Uploaded via: poetry/2.2.1 CPython/3.14.3 Darwin/25.3.0
File hashes
| Algorithm | Hash digest | |
|---|---|---|
| SHA256 |
0cedc46eade6b351ddb788a266626a076b782a9011f3dc0d39414f1f6fb61075
|
|
| MD5 |
def858cadd09751e04020c5ffb702617
|
|
| BLAKE2b-256 |
29549ecccb2b40594b97be39faa3c76ebf92b25fb77367230ec99592aee7beeb
|
File details
Details for the file s3cima-0.1.7-py3-none-any.whl.
File metadata
- Download URL: s3cima-0.1.7-py3-none-any.whl
- Upload date:
- Size: 20.2 kB
- Tags: Python 3
- Uploaded using Trusted Publishing? No
- Uploaded via: poetry/2.2.1 CPython/3.14.3 Darwin/25.3.0
File hashes
| Algorithm | Hash digest | |
|---|---|---|
| SHA256 |
f09c23ef2f62e17c153af8cd3ea758789f8e203d0f892ca5739ec54a5d0b2ce9
|
|
| MD5 |
dd73fc4478c099718868bc83c7933d13
|
|
| BLAKE2b-256 |
3dd7c5d996ab32c1a59bf117ec2468a6c773ae31b8c8213d85fe430099b05ddb
|






