Toolset for modeling of LiveSplit files and analysis of the speedrunning data within

Project description


SaltySplits is a powerful Python library for the modeling of LiveSplit files and analysis of the speedrunning data within. It also features an experimental front-end (available at saltysplits.com).
Key features
- Modeling, not parsing: LSS's XML structure is explicitely modeled through
pydantic-xml, allowing us to validate all elements and attributes within - Lossless representation: appropriate types with serialization/validation logic for selected LSS elements and attributes, allowing for lossless decoding and encoding of speedrunning data
- Dataframe representation: Option to bundle all splits per run (normally scattered across all segments) as a single
pandas.DataFrameand customize their representation. Choose between game time or real time, cumulative or split time and exclude partial and/or empty runs. Can then be dumped to common file formats for further analysis (e.g. CSV or Excel's XLSX) - Data visualization: optional front-end with visualizations for lifetime, run and segment statistics, powered by
Vega-Altairandstreamlit
Planned features (in order of priority)
- Front-end option to upload multiple LSS files and compare runs across (online and offline) sources
- Include dynamic elements in the
pydantic_xmlmodels (e.g. Metadata, AutoSplitterSettings; would allow us to update and even create entirely new LSS files throughsaltysplits) - Decoding of LSS' GameIcon/Segment.Icon elements and representing them as
PIL.Imagefields - Add more meaningful statistics / visualizations to front-end
- Add run validation utilities (e.g. assert that Attempt.ended - Attempt.started matches summed splits for a given run, flag improbable splits, etc.)
- Replace prototype front-end (likely with
django-ninjaback-end, builds on top of the existingpydanticstack)
Installation
# Install from PYPI with Python's package installer
pip install saltysplits
Example of usage
SaltySplits is roughly split into two parts, the saltysplits module and its optionalstreamlit front-end.
Python module
After importing the library, we have to locate an LSS file that we'd like to validate and/or analyse. You can export your own through LiveSplit or use the DEMO_SPLITS file included in the library.
import saltysplits as ss
from saltysplits import DEMO_SPLITS

# Loading (and validating) LSS file
splits = ss.read_lss(lss_path=DEMO_SPLITS)
If the content passes the validation, it returns a pydantic model instance that holds all LSS elements and attributes along with other class methods for data representation (e.g. to_df) These elements and attributes can be accessed through dot notation or through indexing, here are some examples.
# Getting the first split of the first run (i.e. Time instance)
print(splits.segments[0].segment_history[0])

# Getting your attempt count
print(splits.attempt_count)

# Getting your last attempt (i.e. Attempt instance)
print(splits.attempt_history[-1])

# Getting all split_times for the first segment (list of SplitTime instances).
# Any comparisons that you added in LiveSplit will show up here (DEMO_SPLITS only includes 'Personal Best')
print(splits.segments[0].split_times)
Time(real_time=Timedelta('0 days 00:00:54.279395'), game_time=Timedelta('0 days 00:00:54.279395'), id='2')

51

Attempt(real_time=Timedelta('0 days 01:17:44.116000'), game_time=None, id='47', started=datetime.datetime(2016, 2, 3, 2, 18, 25), is_started_synced=False, ended=datetime.datetime(2016, 2, 3, 3, 36, 12), is_ended_synced=True)

[SplitTime(real_time=Timedelta('0 days 00:00:52.605000'), game_time=None, name='Personal Best')]
SaltySplits includes lossless serialization logic for most LSS elements and attributes, allowing us to dump their data to JSON, XML and even LSS. Here are some examples.
# Serialize the first split of the first run (indentation is just to prettify it)
print(splits.segments[0].segment_history[0].model_dump_json(indent=4))

# Serialize the last attempt
print(splits.attempt_history[-1].model_dump_json(indent=4))
{
    "real_time": "00:00:54.2793950",
    "game_time": "00:00:54.2793950",
    "id": "2"
}

{
    "real_time": "01:17:44.1160000",
    "game_time": null,
    "id": "47",
    "started": "02/03/2016 02:18:25",
    "is_started_synced": "False",
    "ended": "02/03/2016 03:36:12",
    "is_ended_synced": "True"
}
The SaltySplits model instance also gives you the option to bundle all splits per run (normally scattered across all segments) and make them available as a single pandas.DataFrame with some options for representation/filtering. Here are some examples.
# Exporting as cumulative times
dataframe = splits.to_df(cumulative=True)

# Displaying first three segments for the first three runs
dataframe.iloc[:, :3].head(3)
| 2 | 9 | 14 | |
|---|---|---|---|
| Tron City | 0 days 00:00:54.279395 | 0 days 00:00:57.234414 | 0 days 00:00:50.736531 |
| Start Abraxas fight | 0 days 00:04:10.803156900 | 0 days 00:04:09.396753300 | 0 days 00:03:53.812999400 |
| Finish Abraxas fight | 0 days 00:06:18.184266600 | 0 days 00:06:13.461184100 | 0 days 00:05:43.722918900 |
# Exporting complete and partial runs
dataframe = splits.to_df(cumulative=False, allow_partial=True)

# Displaying the second run (known to be incomplete)
print(dataframe.iloc[:, 1])
Tron City                                      0 days 00:00:57.544701700
Start Abraxas fight                               0 days 00:03:35.924318
Finish Abraxas fight                           0 days 00:02:07.086598700
"FLYNN!"                                       0 days 00:03:01.553906200
"Hey! Over here!"                              0 days 00:02:02.089599100
"That was CLU. I saw him." (stack2 skip inc)   0 days 00:02:09.190927500
"Follow me."                                   0 days 00:02:51.260018700
End of cycle ride (bridge skip inc)            0 days 00:01:14.917915200
End of bridge thing                            0 days 00:08:22.675795700
Da Vinci                                       0 days 00:00:21.396310300
"Hey! Over here!" #2                           0 days 00:08:48.184439600
Drive tank 4 feet                              0 days 00:06:43.503104700
Green guy                                      0 days 00:05:33.415396700
Beat games                                     0 days 00:03:13.281322800
Green guy talks to me                          0 days 00:02:26.057099100
Get across that bridge                            0 days 00:09:19.363009
Jump up and down on three lightsabers                                NaT
"That's Flynn's!"                              0 days 00:03:07.951872300
Race green guy                                 0 days 00:01:13.459649600
Kill green guy                                 0 days 00:06:17.738949400
Jump the bike                                  0 days 00:05:36.236928300
Grab me by the arm                             0 days 00:04:58.795037200
Popcorn ceiling's revenge                      0 days 00:02:36.808701600
Jump onto the flying staple                    0 days 00:03:23.187284100
Ride motorbike for 9 seconds                   0 days 00:07:49.757024100
Final fight phase 1                               0 days 00:02:38.255899
Final fight phase 2                               0 days 00:03:09.417971
Final fight phase 3                            0 days 00:00:42.739248400
Name: 6, dtype: timedelta64[ns]
# Exporting complete and partial runs
dataframe = splits.to_df(cumulative=True, allow_partial=True)

# Displaying the second run (known to be incomplete; notice how accumulation stops at the missing data)
print(dataframe.iloc[:, 1])
Tron City                                      0 days 00:00:57.544701700
Start Abraxas fight                            0 days 00:04:33.469019700
Finish Abraxas fight                           0 days 00:06:40.555618400
"FLYNN!"                                       0 days 00:09:42.109524600
"Hey! Over here!"                              0 days 00:11:44.199123700
"That was CLU. I saw him." (stack2 skip inc)   0 days 00:13:53.390051200
"Follow me."                                   0 days 00:16:44.650069900
End of cycle ride (bridge skip inc)            0 days 00:17:59.567985100
End of bridge thing                            0 days 00:26:22.243780800
Da Vinci                                       0 days 00:26:43.640091100
"Hey! Over here!" #2                           0 days 00:35:31.824530700
Drive tank 4 feet                              0 days 00:42:15.327635400
Green guy                                      0 days 00:47:48.743032100
Beat games                                     0 days 00:51:02.024354900
Green guy talks to me                             0 days 00:53:28.081454
Get across that bridge                            0 days 01:02:47.444463
Jump up and down on three lightsabers                                NaT
"That's Flynn's!"                                                    NaT
Race green guy                                                       NaT
Kill green guy                                                       NaT
Jump the bike                                                        NaT
Grab me by the arm                                                   NaT
Popcorn ceiling's revenge                                            NaT
Jump onto the flying staple                                          NaT
Ride motorbike for 9 seconds                                         NaT
Final fight phase 1                                                  NaT
Final fight phase 2                                                  NaT
Final fight phase 3                                                  NaT
Name: 6, dtype: timedelta64[ns]
Since we represent time with pandas.TimeDelta, we can easily compute some interesting statistics. Here are a few examples.
# Exporting complete runs
dataframe = splits.to_df(cumulative=False)

# Display top 5 complete runs
print(dataframe.sum(axis=0).sort_values().head(5))
34      0 days 01:20:16.868000
45      0 days 01:21:08.828000
43      0 days 01:22:54.734000
42      0 days 01:23:45.617000
27   0 days 01:24:15.563029600
dtype: timedelta64[ns]
# Exporting complete AND partial runs
dataframe = splits.to_df(cumulative=False, allow_partial=True)

# Getting best split for all segments (including those in partial runs)
best_segments = dataframe.min(axis=1)

# Calculating life playtime
print(dataframe.sum(axis=0).sum())

# Display best splits per segment (limited to 3)
print(best_segments.head(3))

# Getting the best run
complete_runs = dataframe.loc[:, ~dataframe.isna().any()]
complete_run_times = complete_runs.sum(axis=0)
best_run_index = complete_run_times.argmin()
best_run = complete_runs.iloc[:, best_run_index]

# Computing time loss for all segments in best run
best_diffs = best_run - best_segments
possible_timesave = best_diffs.sum()
print(possible_timesave)
Timedelta('1 days 16:00:59.502299300')

Tron City                                         0 days 00:00:47.178000
Start Abraxas fight                               0 days 00:02:51.953000
Finish Abraxas fight                           0 days 00:01:43.500052100
dtype: timedelta64[ns]

Timedelta('0 days 00:11:24.032838')
Lastly, you can switch between GameTime and RealTime (we currently default to RealTime) and choose to represent time as strings (useful if you want to continue analysis elsewhere).
# Exporting GameTime with LSS representation (with the option to drop nanoseconds)
dataframe = splits.to_df(lss_repr=True, lss_ns=True, time_type=ss.TimeType.GAME_TIME)

# Displaying first three segments for the first three runs
print(dataframe.iloc[:, :3].head(3))
| 2 | 9 | 14 | |
|---|---|---|---|
| Tron City | 00:00:54.2793950 | 00:00:57.2344140 | 00:00:50.7365310 |
| Start Abraxas fight | 00:03:16.5237619 | 00:03:12.1623393 | 00:03:03.0764684 |
| Finish Abraxas fight | 00:02:07.3811097 | 00:02:04.0644308 | 00:01:49.9099195 |
Streamlit front-end
Available at SaltySplits.com through streamlit's Community Cloud service.
Can also be hosted locally:
# pip install saltysplits[streamlit]
streamlit run ./saltysplits/streamlit.py
Exporting your LSS file from LiveSplit
Exporting your LSS file from LiveSplit
Simply right-click your LiveSplit window and select Save Splits As...:
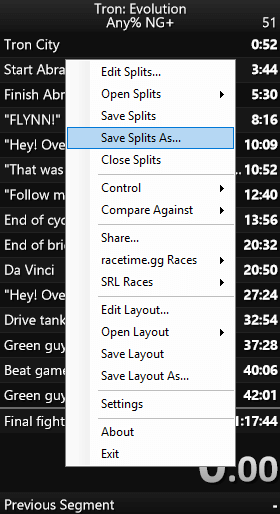
You can then load it with either the saltysplits module or the streamlit front-end (self-hosted or through SaltySplits.com)
Release history Release notifications | RSS feed


Download files
Download the file for your platform. If you're not sure which to choose, learn more about installing packages.
Source Distribution
Built Distribution
Filter files by name, interpreter, ABI, and platform.
If you're not sure about the file name format, learn more about wheel file names.
Copy a direct link to the current filters
File details
Details for the file saltysplits-1.0.3.tar.gz.
File metadata
- Download URL: saltysplits-1.0.3.tar.gz
- Upload date:
- Size: 106.2 kB
- Tags: Source
- Uploaded using Trusted Publishing? No
- Uploaded via: uv/0.8.23
File hashes
| Algorithm | Hash digest | |
|---|---|---|
| SHA256 |
49a55c3d7dfe3511a1d3771455692c716137943eddac02e1c270ba9b49b0cfd0
|
|
| MD5 |
5bd5dd2a0de6ffac822c193ec7ead184
|
|
| BLAKE2b-256 |
c5f7f1a1cc7e8a82d3a323000d4673f003323f68434f9f697df08e8f1ffff51e
|
File details
Details for the file saltysplits-1.0.3-py3-none-any.whl.
File metadata
- Download URL: saltysplits-1.0.3-py3-none-any.whl
- Upload date:
- Size: 27.4 kB
- Tags: Python 3
- Uploaded using Trusted Publishing? No
- Uploaded via: uv/0.8.23
File hashes
| Algorithm | Hash digest | |
|---|---|---|
| SHA256 |
1f8296d87ecb058f43f8add102e851e728380ea202cd78fc07948af2022f97ad
|
|
| MD5 |
4c5e9a644b2a0366f90e9d2a9ef90d2d
|
|
| BLAKE2b-256 |
6c41478cc9da15a5c3bb6ea3995e8605d68bbcaac5d31b66c3c77ae8844e0d49
|


