
This project has been archived by its maintainers, and is no longer receiving any updates.
Scanpath Visualization




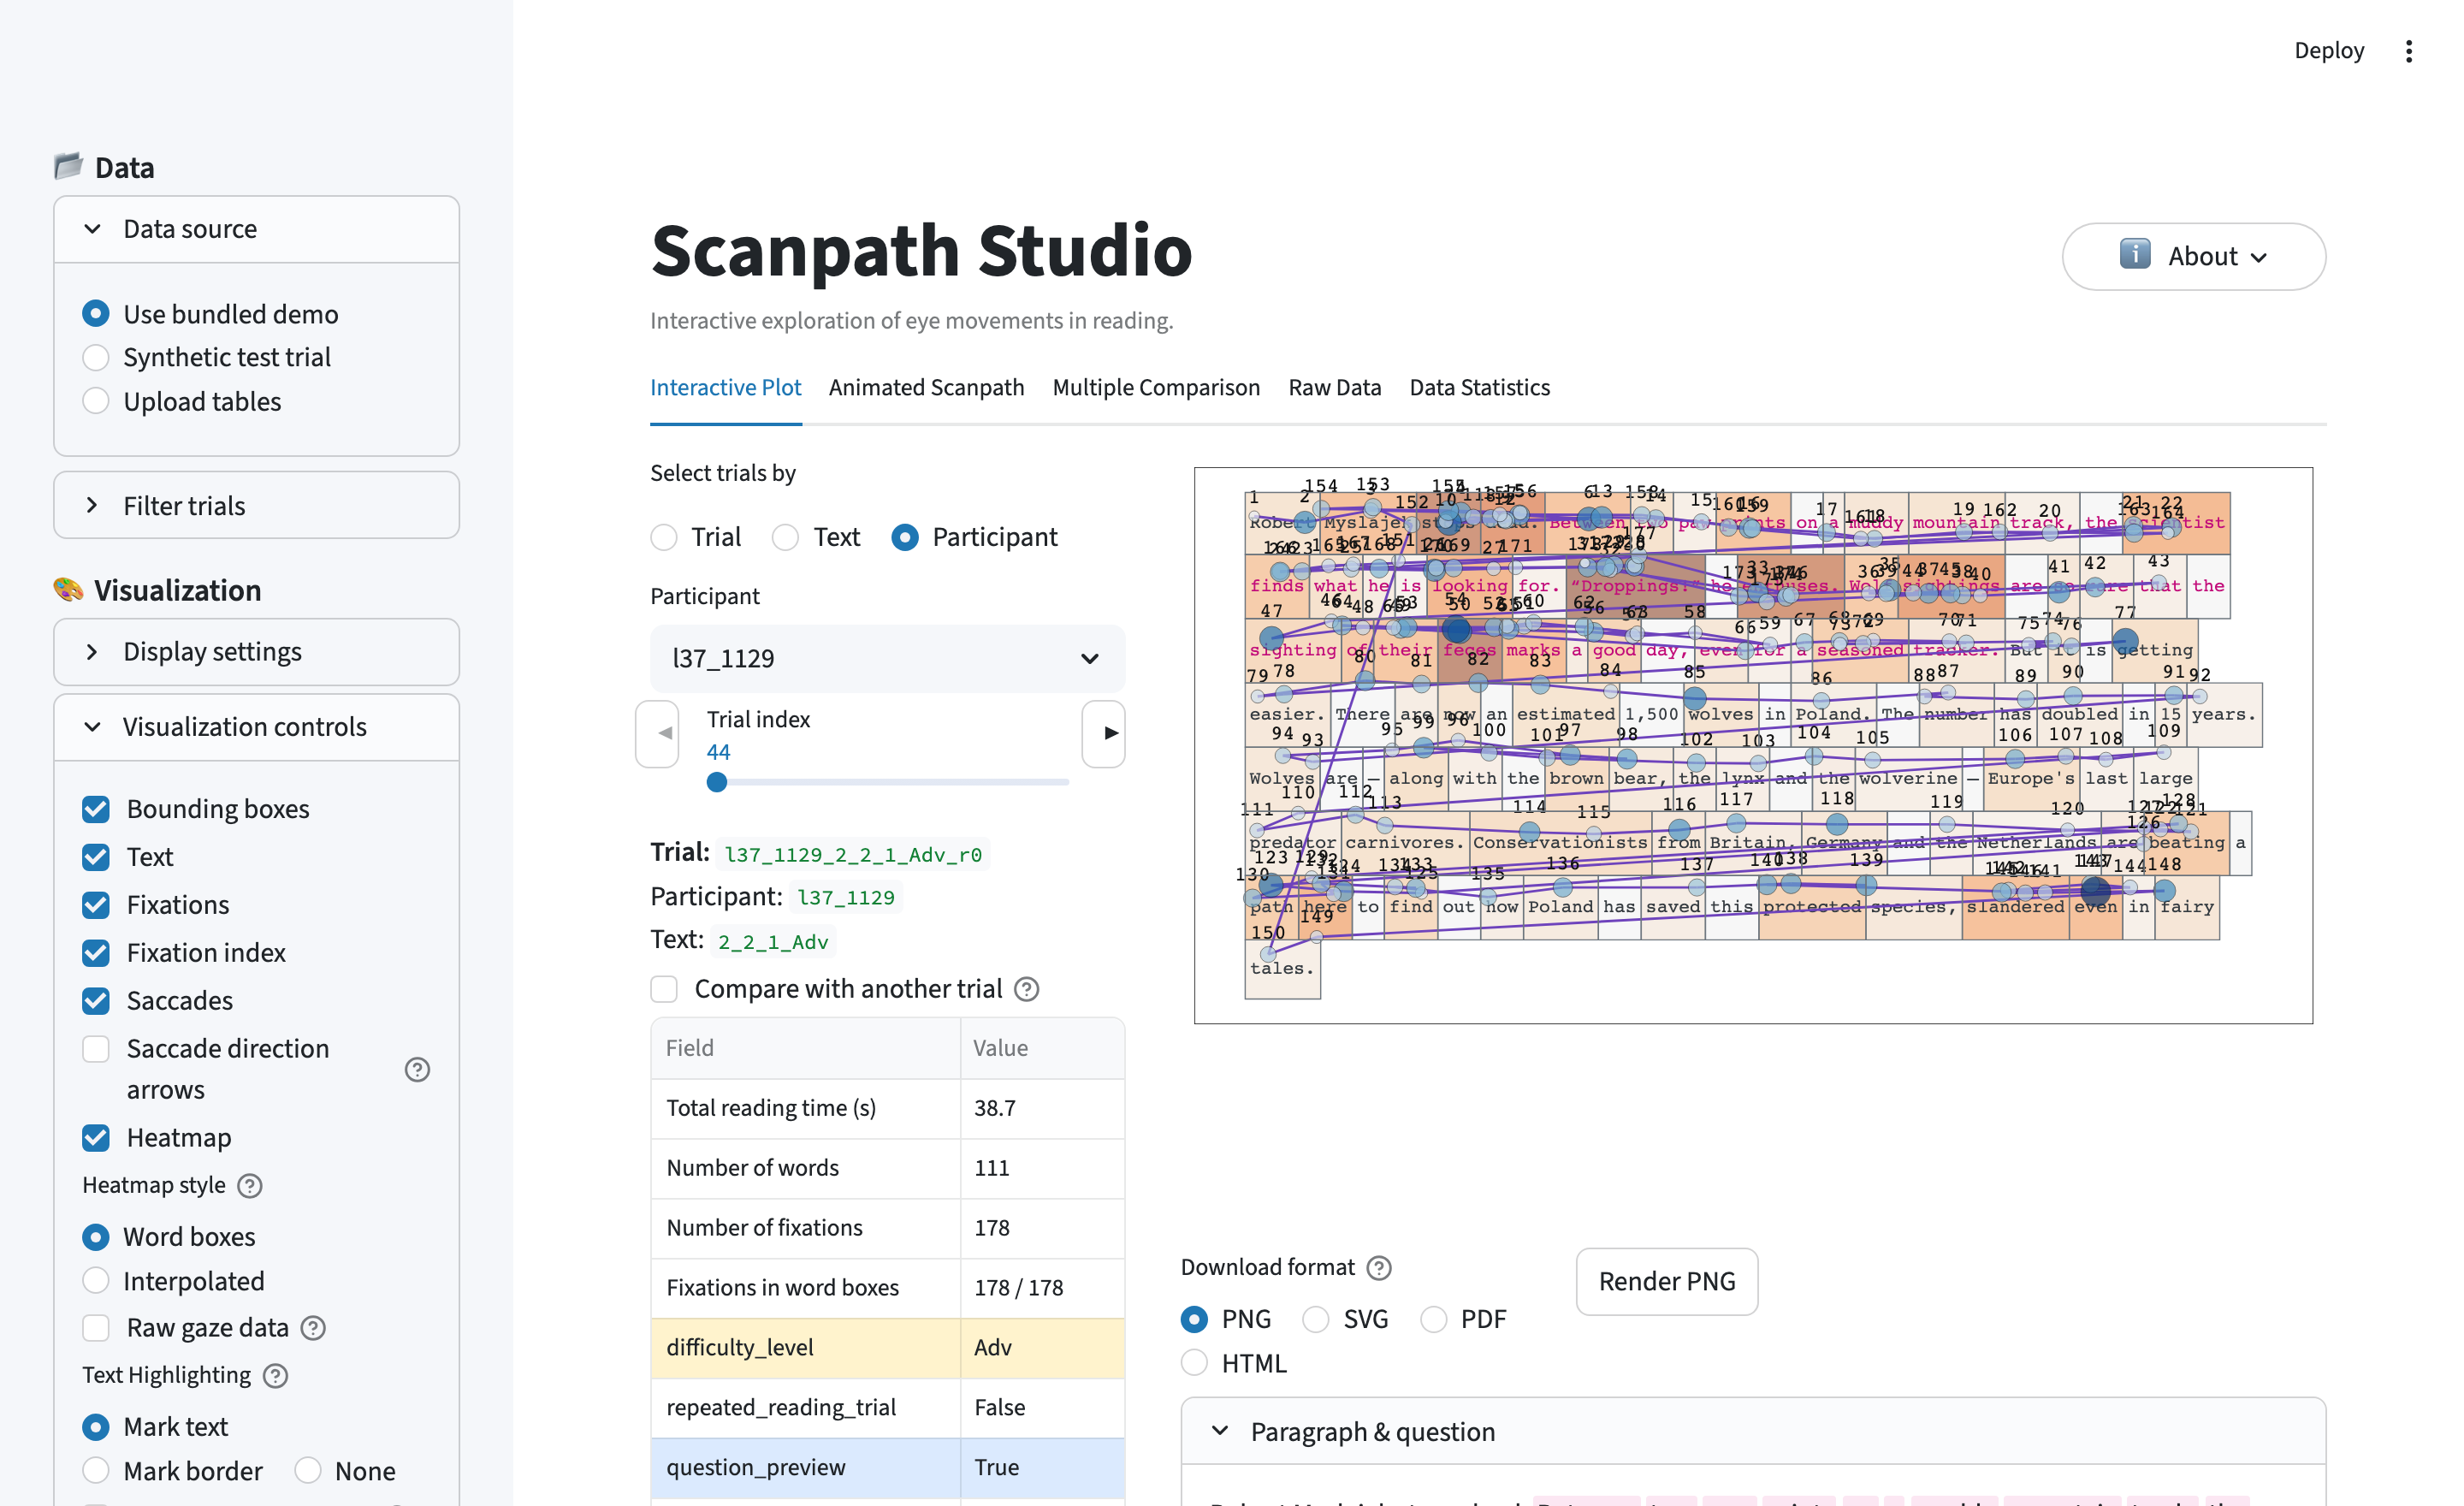
An interactive workbench for visualizing eye-tracking-while-reading data. Drop in a trial and see the scanpath the way the reader saw it: words at their true on-screen positions, fixations and saccades layered on top, a density heatmap, side-by-side trial comparisons, and animated replay — all tunable, and all exportable as publication-ready figures.
It is dataset-agnostic (auto-detects EyeLink / Gazepoint / snake-case columns) and ships with a small OneStop demo so you can try it with zero setup.
Authors: Omer Shubi, Keren Gruteke Klein, and others (TBD) — LACC Lab, Technion.
Try it
Live demo (zero install): https://scanpath-visualization.streamlit.app
Or run locally:
pip install scanpath-visualization-app
scanpath-visualization      # launches the app in your browser
What you can visualize
The plot is built from layers you can toggle independently:
- Text — every word drawn at the exact pixel coordinates the participant saw.
- Fixations — where the eye paused, sized and colored by any column in your data (duration, GPT-2 surprisal, word frequency, …).
- Saccades — the jumps between fixations; backward jumps (regressions) stand out.
- Areas of interest — word bounding boxes that tie each fixation to a word.
- Heatmap — the trial aggregated into a word-level measure (total fixation duration, fixation count, …).
On top of the layered view:
- Animated replay — watch the scanpath unfold fixation by fixation, at real or scaled speed.
- Compare two trials — overlaid on one canvas or side-by-side (e.g. ordinary vs. information-seeking reading, first vs. repeated reading, L1 vs. L2).
- Critical-span highlight — mark a region of interest (e.g. an answer span) by color or border to see at a glance whether it was read.
- Out-of-text & by-line — flag fixations that land outside every word box, or color fixations by the text line they fall on.
- Fully customizable — map any field to color, size, or axes; set the plot background (white or a neutral gray); every toggle, palette, and scale is independent.
The four tabs
| Tab | What's there |
|---|---|
| Interactive Plot | The layered scanpath view, trial picker (by trial / text / participant), trial metadata, and two-trial comparison. |
| Animated Scanpath | Frame-by-frame replay; each frame lasts the actual fixation duration ÷ playback speed. |
| Raw Data | Paginated word, fixation, and raw-gaze tables, each with CSV + Parquet download. |
| Data Statistics | Summary stats (mean fixation duration, saccade amplitude, regression rate, reading speed), a fixation-duration distribution, and a per-word reading-measure bar plot. |
Reading measures from raw fixations
If your data only carries raw fixations, the app computes the canonical per-word measures itself (pre-aggregated EyeLink columns, if present, take precedence):
| Measure | Definition |
|---|---|
| FFD — first fixation duration | duration of the first fixation to land on the word |
| FPRT / gaze duration | sum of fixations from first entry until the eye first leaves |
| RPD / go-past time | sum of fixations from first entry until the eye first moves past the word |
| TFD / dwell | sum of all fixations on the word |
| fixation count, skip, regression in/out, saccade amplitude | standard reading-research flags and counts |
Definitions follow Rayner (1998) and Inhoff & Radach (1998).
Triage your trials
Filter the trial pool by condition — information-seeking Hunting vs. ordinary Gathering reading, difficulty, first vs. repeated reading, answer correctness — or by your own annotations. Star favorites, tag trials (e.g. "To exclude"), and jot per-trial notes; download everything as a JSON sidecar and restore it in a later session.
Your data
Upload CSV, Parquet, or Feather tables for words/AoIs, fixations, and (optionally) raw gaze. Columns are auto-detected from common EyeLink, Gazepoint, and snake-case conventions; a sidebar Column mapping panel lets you override any guess.
Areas of interest come straight from your word boxes — given as
(x, y, width, height) or EyeLink's IA_LEFT/RIGHT/TOP/BOTTOM — the app never
invents them. Fixations are tied to words by bounding-box containment (with a
small nearest-word fallback); fixations that miss every box are flagged
out-of-text.
Bulk export
One panel exports artifacts for every filtered trial into a single zip —
per-trial PNG + SVG figures, the exact plot settings (plot_config.json),
fixations, and per-word measures, plus aggregated tables across trials. Ideal
for paper figures or building an image dataset of scanpaths for vision models.
Run from source
git clone https://github.com/lacclab/scanpath-visualization.git
cd scanpath-visualization
pip install -e ".[test]"          # or: uv sync
streamlit run streamlit_app.py
Tested on Python 3.11–3.13. Run the tests with pytest; lint with
ruff check --exclude other_vis .. See AGENTS.md for an
architectural overview.
Citation
A system-demo paper is in preparation — citation TBD.
If you use the bundled demo data, please cite the OneStop corpus:
@article{berzak2025onestop,
  title     = {{OneStop}: A 360-Participant {E}nglish Eye Tracking Dataset
               with Different Reading Regimes},
  author    = {Berzak, Yevgeni and Malmaud, Jonathan and Shubi, Omer
               and Meiri, Yoav and Lion, Ella and Levy, Roger},
  journal   = {Scientific Data},
  year      = {2025},
  publisher = {Nature Publishing Group},
  doi       = {10.1038/s41597-025-06272-2},
  url       = {https://www.nature.com/articles/s41597-025-06272-2},
}
The bundled demo is a subset of OneStop Eye Movements, used under its original license (docs).
License
MIT — see LICENSE.
1 maintainer

Metadata
1 maintainer
Release files for scanpath-visualization-app 0.13.0
For a detailed explanation of source distributions (sdists) and built distributions (wheels), please see the package formats documentation.
Source distribution (sdist)
| File | Size | Uploaded | |
|---|---|---|---|
| scanpath_visualization_app-0.13.0.tar.gz | 661.7 kB | Details |
Built distribution (wheel)
| File | Interpreter | ABI | Platform | Reset |
|---|---|---|---|---|
| scanpath_visualization_app-0.13.0-py3-none-any.whl | Python 3 | none | any | Details |
Total release size: 1.3 MB
Release files / scanpath_visualization_app-0.13.0.tar.gz
| Download URL | scanpath_visualization_app-0.13.0.tar.gz |
|---|---|
| Size | 661.7 kB |
| Tags | Source |
|
SHA-256 checksum How to use checksums |
0852bbc2bcd0a1f81db4e6028fbca4d2710b3884c25a511d44deef6f1623e5ab
|
|
BLAKE2b-256 checksum How to use checksums |
8485e4a1fa619df98b92ec24258ff3b11308c52ef55641b3632950a898d3069f
|
| Upload date | |
|
Uploaded using Trusted Publishing? What is trusted publishing? |
Yes |
| Uploaded via |
twine/6.1.0 CPython/3.13.12
|
Provenance
Provenance describes where a file came from. On PyPI, provenance is shared via attestations, which provide a verifiable record of the build or publishing details. View details, limitations and caveats.


PyPI Publish Attestation
PyPI verified that this artifact, at this checksum, originated from the publisher listed below.
Signed by GitHub Actions, verified by PyPI on Jun 6, 2026.
Transparency logRelease files / scanpath_visualization_app-0.13.0-py3-none-any.whl
| Download URL | scanpath_visualization_app-0.13.0-py3-none-any.whl |
|---|---|
| Size | 652.2 kB |
| Tags | Python 3 |
|
SHA-256 checksum How to use checksums |
24f56eee7c86844994f30033d67680eb4b5c209b633df63550e90f8718cbf836
|
|
BLAKE2b-256 checksum How to use checksums |
469134b9c73bb3d045c184526657ae0adaa9669446582e806ad9e630e8f734fe
|
| Upload date | |
|
Uploaded using Trusted Publishing? What is trusted publishing? |
Yes |
| Uploaded via |
twine/6.1.0 CPython/3.13.12
|
Provenance
Provenance describes where a file came from. On PyPI, provenance is shared via attestations, which provide a verifiable record of the build or publishing details. View details, limitations and caveats.
PyPI Publish Attestation
PyPI verified that this artifact, at this checksum, originated from the publisher listed below.
Signed by GitHub Actions, verified by PyPI on Jun 6, 2026.
Transparency log













