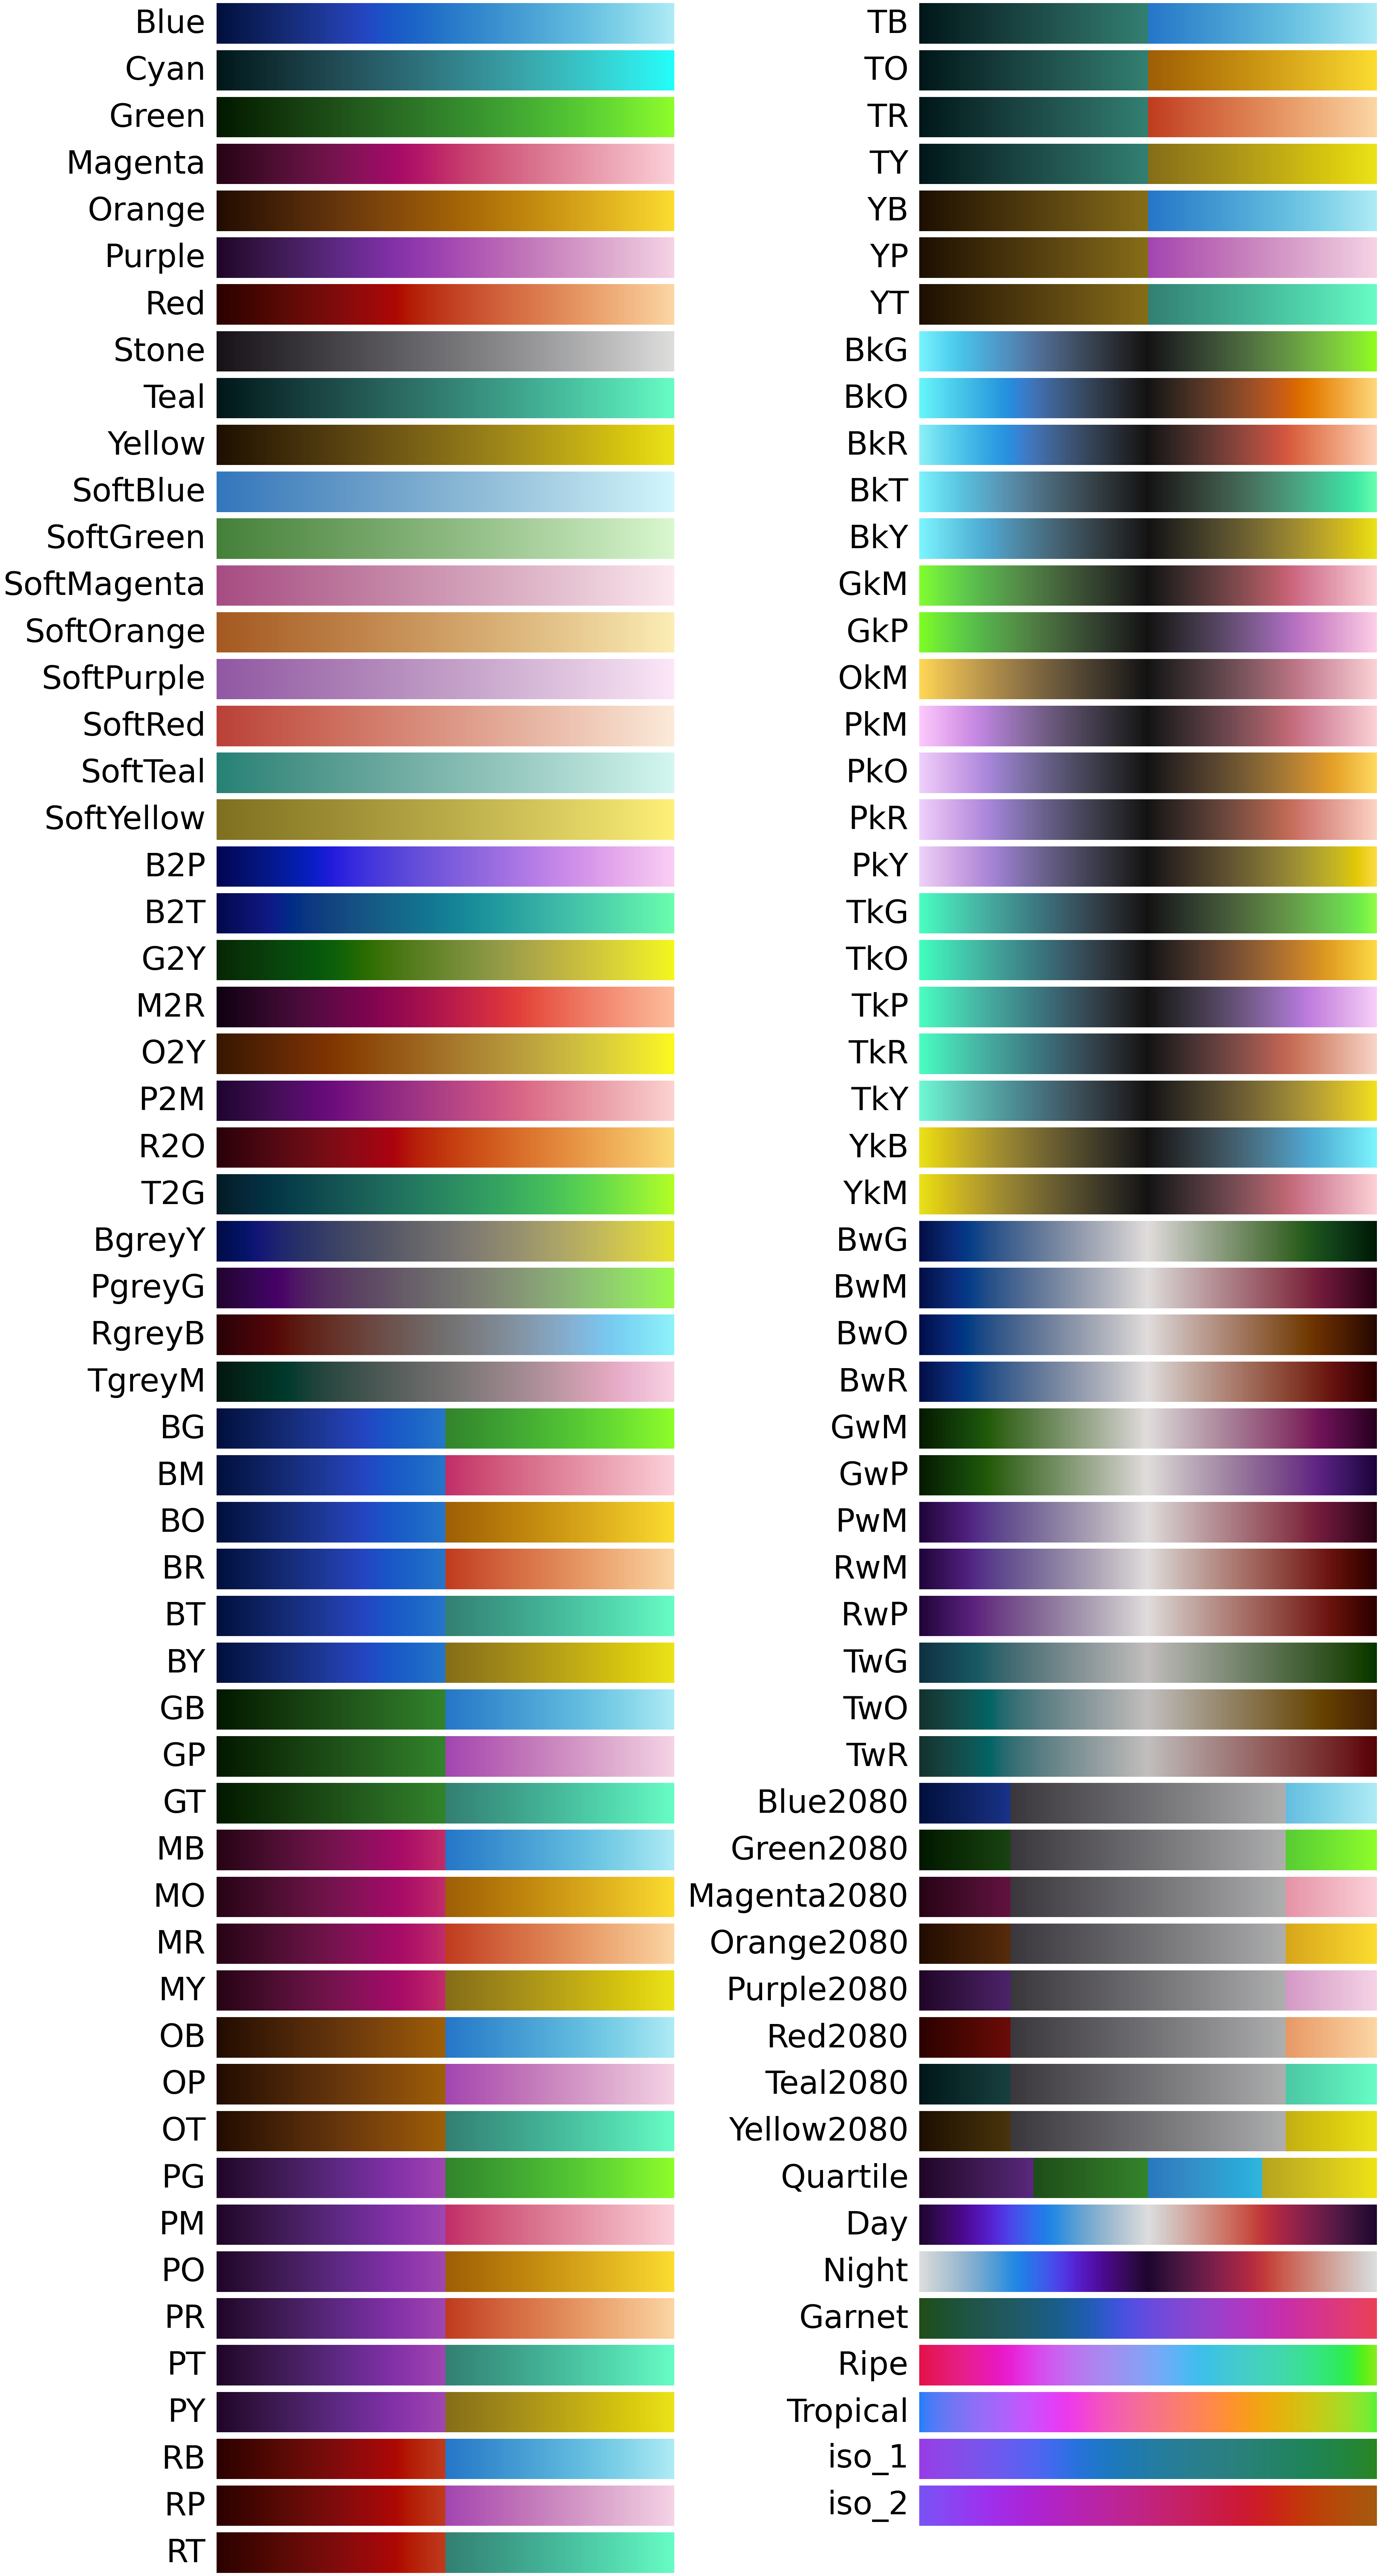
Science Colour Maps is a small package containing several colour maps created using viscm.
Project description
SciCM: Scientific Colour Maps

SciCM is a small Python package aimed at providing a large set of good (i.e. perceptually linear) colour maps, constructed with a consistent design philosophy. This package expands and complements the already existent selection of similar colour maps (e.g., matplotlib, ColorCET, cmocean and CMasher). All colour maps in this package have been created using viscm. Also included are utilities for colour map manipulation.
Installation and use
The package is available for installation using pip:
>pip install scicm
Although you may wish to install it directly from GitHub using:
>pip install git+https://github.com/MBravoS/splotch.git@master
Upon importing SciCM, the colour maps are registered with matplotlib, so they can be used by passing cmap='scicm.cmapname' to any plotting function that accepts a colour map (e.g. the cmap keyword in matplotlib). The colour map objects can also be explicitly accessed using scicm.cm.cmapname. Reversed versions of the colour maps are also included, accessible through the same naming convention used by matplotlib (i.e. cmapname_r).
Included Colour Maps

Project details
Release history Release notifications | RSS feed
Download files
Download the file for your platform. If you're not sure which to choose, learn more about installing packages.


