






scikit-na is a comprehensive Python package for missing data (NA) analysis and exploration. It provides statistical functions, interactive visualizations, and export capabilities to help data scientists understand and handle missing values in their datasets.
Why scikit-na?
- Comprehensive Analysis: Get detailed statistics on missing data patterns
- Interactive Reports: Generate widget-based reports for Jupyter notebooks
- Multiple Export Formats: Share results as CSV, JSON, HTML, or Excel files
- Statistical Modeling: Build logistic regression models to understand missingness
- Rich Visualizations: Create heatmaps, correlation plots, and distribution charts
- Hypothesis Testing: Test for missing completely at random (MCAR) patterns
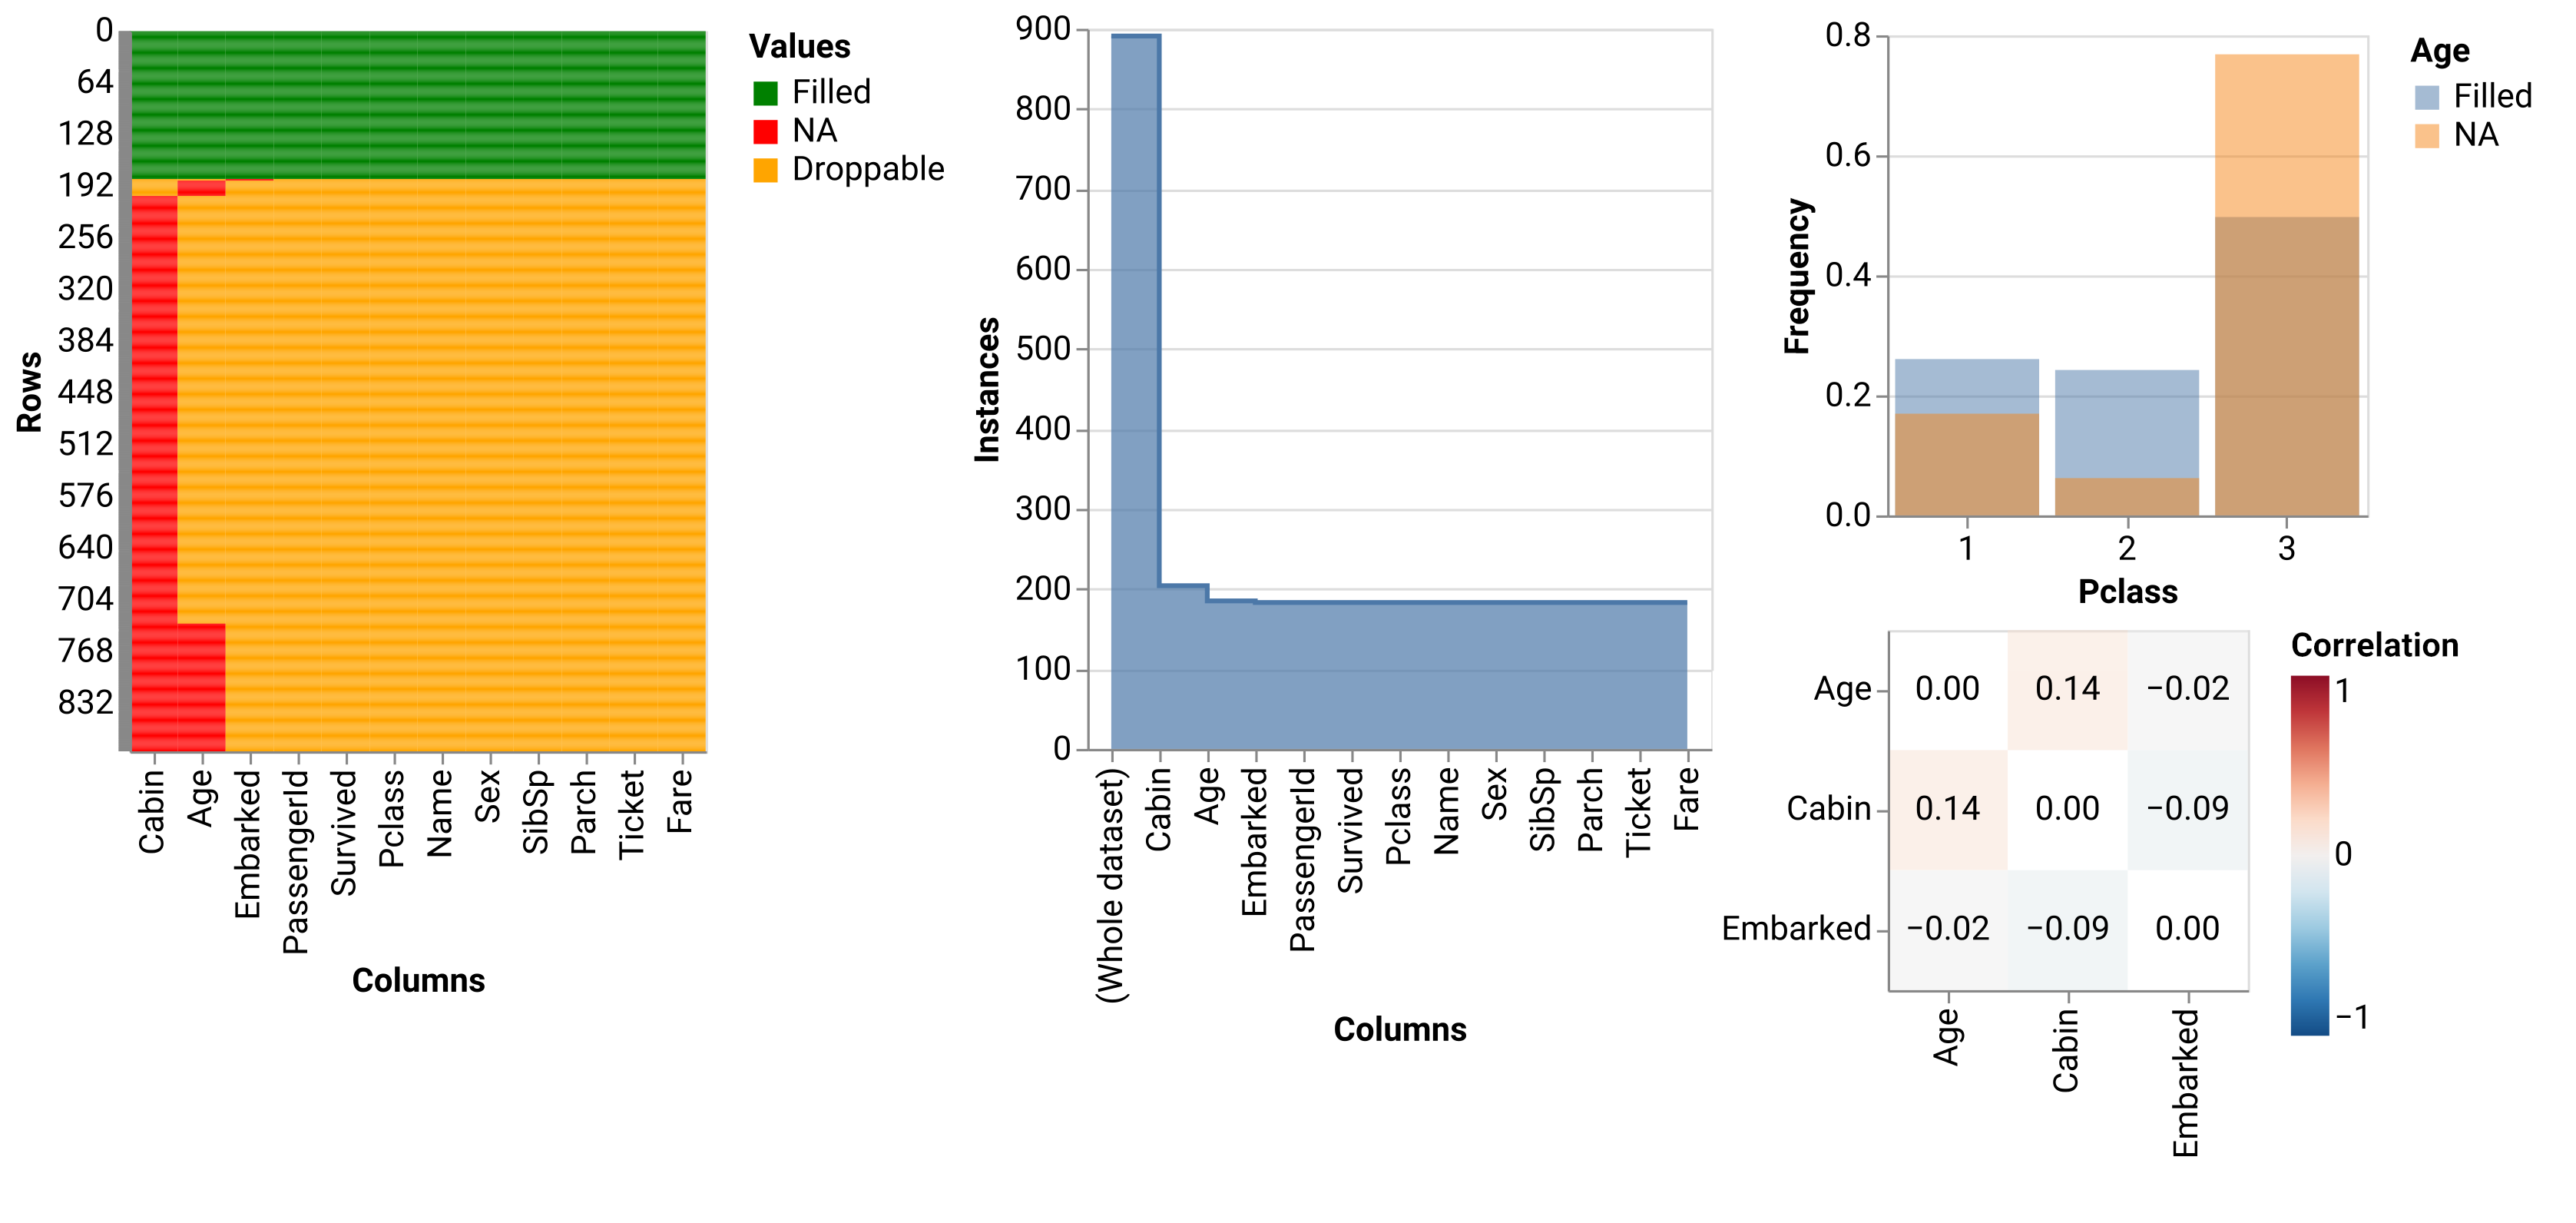
Features
- Interactive report (based on ipywidgets)
- Export functionality (CSV, JSON, HTML, XLSX formats)
- Descriptive statistics
- Regression modeling
- Hypotheses tests
- Data visualization
Donate
If you find this package useful, please consider donating any amount of money. This will help me spend more time on supporting open-source software.

Installation
Basic installation
pip install scikit-na
With optional dependencies
# For export functionality (Excel support)
pip install scikit-na[export]

# For development
pip install scikit-na[dev]

# Install from source
pip install git+https://github.com/maximtrp/scikit-na.git
Quick Start
import scikit_na as na
import pandas as pd

# Load your data
data = pd.read_csv('your_dataset.csv')

# Get missing data summary
summary = na.summary(data)
print(summary)

# Create interactive report
report = na.report(data)

# Export results
na.export_summary(data, 'missing_data_analysis.csv', format='csv')
Examples
The following examples use the Titanic dataset (from Kaggle) that contains NA values in three columns: Age, Cabin, and Embarked.
Core Functions
| Function | Description |
|---|---|
na.summary() |
Comprehensive missing data statistics |
na.correlate() |
Correlations between missing values |
na.describe() |
Descriptive stats grouped by missingness |
na.model() |
Logistic regression for missing patterns |
na.test_hypothesis() |
Statistical tests for MCAR |
na.report() |
Interactive widget-based report |
na.export_summary() |
Export analysis to files |
na.export_report() |
Export multi-file analysis reports |
Summary
Per each column
By default, summary() function returns the results for each column.
import scikit_na as na
import pandas as pd

data = pd.read_csv('titanic_dataset.csv')

# Excluding three columns without NA to fit the table here
na.summary(data, columns=data.columns.difference(['SibSp', 'Parch', 'Ticket']))
| Age | Cabin | Embarked | Fare | Name | PassengerId | Pclass | Sex | Survived | |
|---|---|---|---|---|---|---|---|---|---|
| na_count | 177 | 687 | 2 | 0 | 0 | 0 | 0 | 0 | 0 |
| na_pct_per_col | 19.87 | 77.1 | 0.22 | 0 | 0 | 0 | 0 | 0 | 0 |
| na_pct_total | 20.44 | 79.33 | 0.23 | 0 | 0 | 0 | 0 | 0 | 0 |
| na_unique_per_col | 19 | 529 | 2 | 0 | 0 | 0 | 0 | 0 | 0 |
| na_unique_pct_per_col | 10.73 | 77 | 100 | 0 | 0 | 0 | 0 | 0 | 0 |
| rows_after_dropna | 714 | 204 | 889 | 891 | 891 | 891 | 891 | 891 | 891 |
| rows_after_dropna_pct | 80.13 | 22.9 | 99.78 | 100 | 100 | 100 | 100 | 100 | 100 |
NA unique is the number of NA values per each column that are unique for it, i.e. do not intersect with NA values in the other columns (or that will remain in dataset if we drop NA values in the other columns).
Whole dataset
We can also get a summary of missing data for the whole dataset:
na.summary(data, per_column=False)
| dataset | |
|---|---|
| total_columns | 12 |
| total_rows | 891 |
| na_rows | 708 |
| non_na_rows | 183 |
| total_cells | 10692 |
| na_cells | 866 |
| na_cells_pct | 8.1 |
| non_na_cells | 9826 |
| non_na_cells_pct | 91.9 |
Correlations
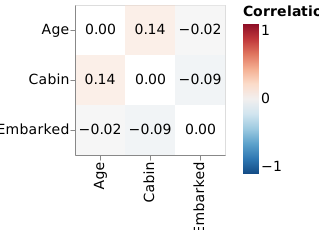
To calculate correlations between columns in terms of missing data, just call
correlate() function with your DataFrame as the first argument:
na.correlate(data, method="spearman").round(3)
| Embarked | Age | Cabin | |
|---|---|---|---|
| Embarked | 1 | -0.024 | -0.087 |
| Age | -0.024 | 1 | 0.144 |
| Cabin | -0.087 | 0.144 | 1 |
This method can be used to uncover hidden patterns in missing data across many columns in a dataset. Columns with no missing data are automatically excluded.
There is a function to visualize correlations with a heatmap:
na.altair\
    .plot_corr(data, corr_kws={'method': 'spearman'})
    .properties(width=150, height=150)
Visualization
Heatmap
Now, let's visualize NA values on a heatmap. We will be using Altair + Vega backend:
na.altair.plot_heatmap(data)
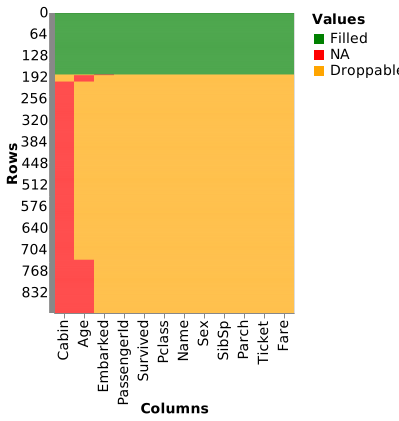
Droppables are those values that will be dropped if we simply use
pandas.DataFrame.dropna() on the entire dataset.
Stairs plot
Stairs plot is one more useful visualization of dataset shrinkage on applying
pandas.Series.dropna() method to each column sequentially (sorted by the
number of NA values, by default):
na.altair.plot_stairs(data)
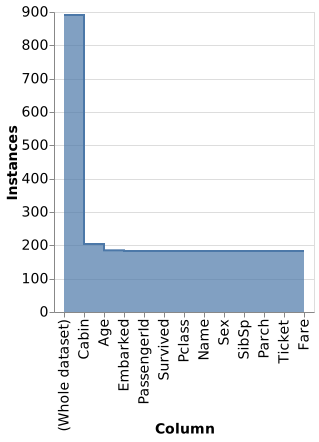
After dropping all NAs in Cabin column, we are left with 21 more NAs (in Age
and Embarked columns). This plot also shows tooltips with exact numbers of NA
values that are dropped per each column.
Histogram
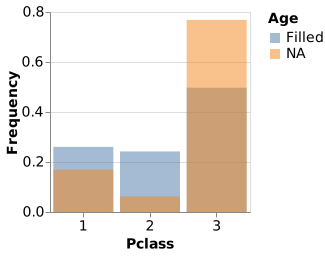
You may need to adjust some parameters before a histogram starts looking as you expect:
chart = na.altair.plot_hist(data, col='Pclass', col_na='Age')\
    .properties(width=200, height=200)
chart.configure_axisX(labelAngle = 0)
Regression model
We can build a logistic regression model with Age as a dependent variable and
Fare, Parch, Pclass, SibSp, Survived as independent variables.
Internally, pandas.Series.isna() method is called on Age column, and the
resulting boolean values are converted to integers (True/False becomes
1/0). Finally, fitting a logistic model is done by
statsmodels package:
# Selecting columns with numeric data
# Dropping "PassengerId" column
subset = data.loc[:, data.dtypes != object].drop(columns=['PassengerId'])
model = na.model(subset, col_na='Age')
model.summary()
Optimization terminated successfully.
Current function value: 0.467801
Iterations 7
                        Logit Regression Results
===============================================================================
Dep. Variable:                    Age   No. Observations:                   891
Model:                          Logit   Df Residuals:                       885
Method:                           MLE   Df Model:                             5
Date:                Sat, 05 Jun 2021   Pseudo R-squ.:                  0.06164
Time:                        17:51:31   Log-Likelihood:                 -416.81
converged:                       True   LL-Null:                        -444.19
Covariance Type:            nonrobust   LLR p-value:                  1.463e-10
===============================================================================
                coef    std err          z      P>|z|      [0.025      0.975]
-------------------------------------------------------------------------------
(intercept)    -2.7294      0.429     -6.369      0.000      -3.569      -1.890
Fare            0.0010      0.003      0.376      0.707      -0.004       0.006
Parch          -0.8874      0.223     -3.984      0.000      -1.324      -0.451
Pclass          0.5953      0.147      4.046      0.000       0.307       0.884
SibSp           0.2548      0.095      2.684      0.007       0.069       0.441
Survived       -0.1026      0.198     -0.519      0.604      -0.490       0.285
===============================================================================
Interactive report
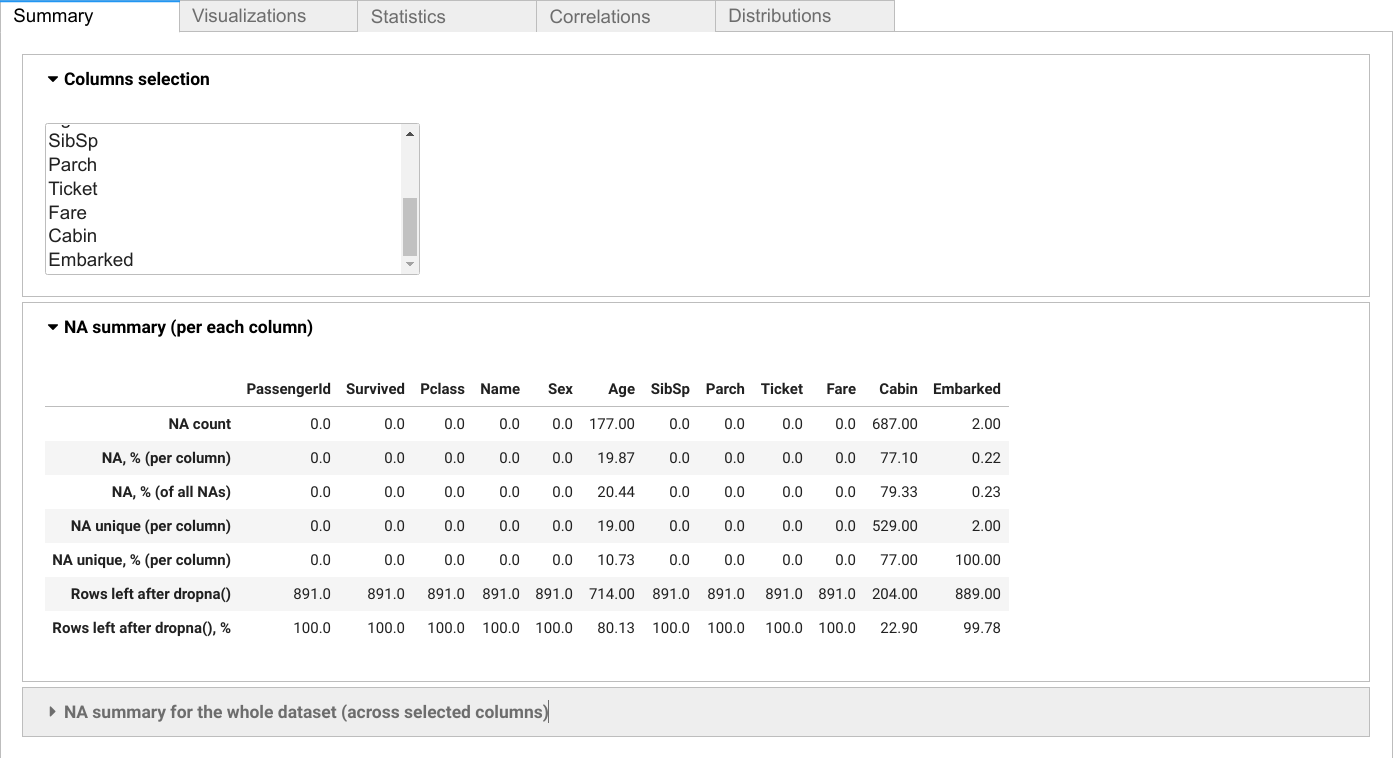
Use scikit_na.report() function to show interactive report interface:
na.report(data)
Export functionality
Export your analysis results to various formats for sharing and further processing:
Export summary statistics
# Export to CSV
na.export_summary(data, 'missing_data_summary.csv', format='csv')

# Export to JSON
na.export_summary(data, 'summary.json', format='json')

# Export to Excel
na.export_summary(data, 'analysis.xlsx', format='xlsx')
Export comprehensive reports
# Export summaries, correlations, descriptions, and report metadata
exported_files = na.export_report(data, output_dir='missing_data_report')

# Export with custom columns
exported_files = na.export_report(
    data,
    output_dir='focused_analysis',
    columns=['Age', 'Cabin', 'Embarked'],
)
export_report() creates a directory containing CSV summaries and JSON metadata.
Correlation and descriptive-statistics CSV files are included when applicable.
Individual summaries exported with export_summary() support:
- CSV: Summary statistics in tabular format
- JSON: Structured data for programmatic access
- HTML: Static summary tables for web viewing
- XLSX: Excel-compatible spreadsheets
API Reference
Statistical Functions
summary(data, columns=None, per_column=True, round_dec=2)- Missing data statisticscorrelate(data, columns=None, drop=True, **kwargs)- Correlation analysisdescribe(data, col_na, columns=None, na_mapping=None)- Grouped descriptive statsmodel(data, col_na, columns=None, intercept=True, **kwargs)- Logistic regressiontest_hypothesis(data, col_na, test_fn, columns=None, **kwargs)- Hypothesis testingstairs(data, columns=None, **kwargs)- Dataset shrinkage analysis
Visualization Functions
altair.plot_heatmap(data, **kwargs)- Missing data heatmapaltair.plot_corr(data, **kwargs)- Correlation heatmapaltair.plot_stairs(data, **kwargs)- Stairs plotaltair.plot_hist(data, col, col_na, **kwargs)- Missing data histogram
Export Functions
export_summary(data, output_path, format='csv', **kwargs)- Export summary statisticsexport_report(data, output_dir, **kwargs)- Export a multi-file analysis report
Interactive Reports
report(data, columns=None, **kwargs)- Generate interactive widget-based report
Contribution
Any contribution is highly appreciated: pull requests, suggestions, or bug reports.
1 maintainer

Metadata
1 maintainer
Release files for scikit-na 0.4.0
For a detailed explanation of source distributions (sdists) and built distributions (wheels), please see the package formats documentation.
Source distribution (sdist)
| File | Size | Uploaded | |
|---|---|---|---|
| scikit_na-0.4.0.tar.gz | 47.9 kB | Details |
Built distribution (wheel)
| File | Interpreter | ABI | Platform | Reset |
|---|---|---|---|---|
| scikit_na-0.4.0-py3-none-any.whl | Python 3 | none | any | Details |
Total release size: 81.4 kB
Release files / scikit_na-0.4.0.tar.gz
| Download URL | scikit_na-0.4.0.tar.gz |
|---|---|
| Size | 47.9 kB |
| Tags | Source |
|
SHA-256 checksum How to use checksums |
ec2414aeb25401874e54f6958ff1ed532530b8f84c72df4114e387b2c5c15e05
|
|
BLAKE2b-256 checksum How to use checksums |
38e4a3e78c3b8e014f541e77354521779734ac94560bf2cdfda2005adc898eed
|
| Upload date | |
|
Uploaded using Trusted Publishing? What is trusted publishing? |
Yes |
| Uploaded via |
twine/7.0.0 CPython/3.13.14
|
Provenance
Provenance describes where a file came from. On PyPI, provenance is shared via attestations, which provide a verifiable record of the build or publishing details. View details, limitations and caveats.


PyPI Publish Attestation
PyPI verified that this artifact, at this checksum, originated from the publisher listed below.
Signed by GitHub Actions, verified by PyPI on Aug 26, 2026.
Transparency logRelease files / scikit_na-0.4.0-py3-none-any.whl
| Download URL | scikit_na-0.4.0-py3-none-any.whl |
|---|---|
| Size | 33.6 kB |
| Tags | Python 3 |
|
SHA-256 checksum How to use checksums |
0275aa4363404b82b33c6d643c1ae92f9b649407b45fd00ac4ec1dea69b56d0e
|
|
BLAKE2b-256 checksum How to use checksums |
9f8a05090272a1aeb2a629179389ddf8f5648e3b773f87e78165db70a2ba4808
|
| Upload date | |
|
Uploaded using Trusted Publishing? What is trusted publishing? |
Yes |
| Uploaded via |
twine/7.0.0 CPython/3.13.14
|
Provenance
Provenance describes where a file came from. On PyPI, provenance is shared via attestations, which provide a verifiable record of the build or publishing details. View details, limitations and caveats.
PyPI Publish Attestation
PyPI verified that this artifact, at this checksum, originated from the publisher listed below.
Signed by GitHub Actions, verified by PyPI on Aug 26, 2026.
Transparency log













