A lightweight profiler to measure execution time with a rich and colorful hierarchical report.

Project description


scope-timer
A lightweight profiler to measure execution time with a rich and colorful hierarchical report.
scope-timer makes it easy to find performance bottlenecks in your Python code by timing specific sections and presenting the results in a beautiful, hierarchical tree. It's designed to be simple to use and have minimal overhead.
Key Features
- Simple and Intuitive API: Use decorators (
@ScopeTimer.profile(...)) or context managers (with ScopeTimer.profile(...)) to profile code blocks effortlessly. - Hierarchical Reports: Understand performance bottlenecks in nested function calls and scopes.
- Multiple Outputs: View reports directly in the console, or save them as plain text or interactive HTML files.
- Rich & Colorful: Powered by the
richlibrary for beautiful and readable terminal output. - Lightweight & Predictable: Low memory overhead and linear performance scaling, suitable for complex applications.
- Thread-Safe: Profile multi-threaded applications without interference between threads.
Installation
pip install scope-timer
Usage
You can easily profile functions and code blocks. Here is a simple example of a multi-stage pipeline:
from scope_timer import ScopeTimer
import time

@ScopeTimer.profile("preprocess")
def preprocess():
    with ScopeTimer.profile("load_data"):
        time.sleep(0.01)
    with ScopeTimer.profile("clean_data"):
        time.sleep(0.015)

@ScopeTimer.profile("compute")
def compute():
    for _ in range(10):
        with ScopeTimer.profile("matmul"):
            time.sleep(0.001)
        with ScopeTimer.profile("activation"):
            time.sleep(0.0005)

@ScopeTimer.profile("postprocess")
def postprocess():
    with ScopeTimer.profile("save_results"):
        time.sleep(0.005)

# Profile the entire pipeline
with ScopeTimer.profile("pipeline"):
    preprocess()
    compute()
    postprocess()

# Print the summary to the console
ScopeTimer.summarize()

# You can also save the report to a file
ScopeTimer.save_html("timer_report.html")
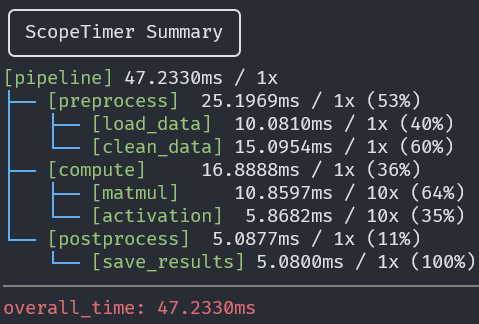
Example Output
The following console output shows a structured report with elapsed time, number of calls, and percentage of parent scope.
Limitations
Currently, scope-timer does not support asyncio.
This is because timer state is tracked per thread, but asyncio runs multiple tasks within a single thread, frequently switching execution contexts using await. As a result:
- Profiling an
async deffunction with@ScopeTimer.profilemay produce incorrect timing or even raiseValueError. - Using
ScopeTimer.profile(...)across anawaitboundary is not safe.
For now,
scope-timeris intended for synchronous or multi-threaded code only.
Performance
scope-timer is designed to be lightweight with predictable performance.
The following graphs show the memory usage and report generation time when profiling a realistic, multi-stage pipeline.
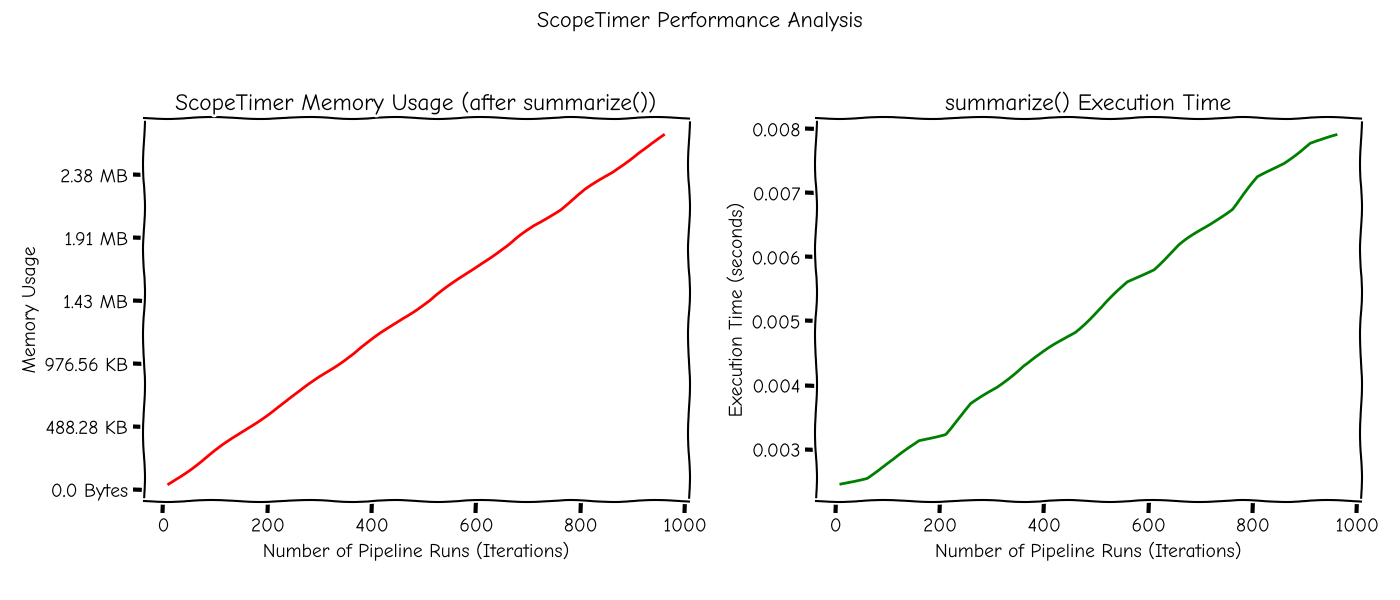
This benchmark simulates a typical pipeline structure consisting of the following:
preprocess: stage with 2 sub-taskscompute: stage with 1 sub-task and 20 repeated prediction scopespostprocess: stage with a result-saving scope
The full pipeline is executed multiple times (10–1000 iterations), and ScopeTimer.summarize() is called once at the end.
As shown:
- Memory usage increases linearly and remains well under 3MB for 1000 pipeline runs.
- Execution time for summarize() stays under 10ms for large workloads.
This ensures stable and low overhead behavior even in performance-critical applications.
API Overview
All methods are static and can be called directly from the ScopeTimer class.
Core Profiling Methods
-
ScopeTimer.profile(name: str)The recommended way to profile a block of code. It can be used as a context manager (
with) or a decorator (@). It automatically handles starting and stopping the timer.Parameters:
name (str): The identifier for the scope.
-
ScopeTimer.begin(name: str)Manually starts a timer scope. This is useful in situations where a context manager or decorator cannot be used. Each
begin()call must be paired with a correspondingend()call.Parameters:
name (str): The identifier for the scope to start.
-
ScopeTimer.end(name: str)Manually stops the currently active timer scope.
Parameters:
name (str): The identifier for the scope to end. Must match the name of the currently active scope.
Reporting Methods
-
ScopeTimer.summarize(time_unit="auto", precision="auto", divider="rule", verbose=False)Prints a formatted summary of timing results to the console.
Parameters:
time_unit (str): The display unit for time. Can be'auto','s','ms', or'us'. Defaults to'auto'.precision (int | str): The number of decimal places for time values. Defaults to'auto'.divider (str): The style of the separator between root scopes. Can be'rule'or'blank'. Defaults to'rule'.verbose (bool): If True, displays detailed statistics (min, max, avg, var). Defaults toFalse.
-
ScopeTimer.save_txt(file_path, **kwargs)Saves a summary of timing results as a plain text file.
Parameters:
file_path (str | Path): The path to the output file.**kwargs: Accepts the same arguments assummarize()(time_unit,precision,verbose).
-
ScopeTimer.save_html(file_path, **kwargs)Saves a summary of timing results as a themed HTML file.
Parameters:
file_path (str | Path): The path to the output file.**kwargs: Accepts the same arguments assummarize()(time_unit,precision,verbose).
Utility Methods
-
ScopeTimer.reset()Resets all recorded timer data, clearing all scopes and measurements. Use this to start a fresh set of measurements within the same process.
-
ScopeTimer.enable()Enables the timer globally. If the timer was disabled, this will resume profiling. The timer is enabled by default.
-
ScopeTimer.disable()Disables the timer globally. While disabled, all profiling calls (
profile,begin,end) are ignored and have no performance impact.
License
This project is licensed under the MIT License.


Download files
Download the file for your platform. If you're not sure which to choose, learn more about installing packages.
Source Distributions
Built Distribution
Filter files by name, interpreter, ABI, and platform.
If you're not sure about the file name format, learn more about wheel file names.
Copy a direct link to the current filters
File details
Details for the file scope_timer-0.2.0-py3-none-any.whl.
File metadata
- Download URL: scope_timer-0.2.0-py3-none-any.whl
- Upload date:
- Size: 11.2 kB
- Tags: Python 3
- Uploaded using Trusted Publishing? No
- Uploaded via: twine/6.1.0 CPython/3.12.11
File hashes
| Algorithm | Hash digest | |
|---|---|---|
| SHA256 |
f2a016d21af208f231c3f8b7228bf11555030f08e21cdef5d1468933c2d891f9
|
|
| MD5 |
da32ce20ddbd3b6a525a9999445a76a0
|
|
| BLAKE2b-256 |
a6cd74f28833017f2fc145a89b6115548ab2440f71fcedbb4b113a2cc651e7b7
|


