
scstability
Which of your single-cell clusters survive resampling, and which dissolve?



Leiden will return clusters from pure noise, confidently. The silhouette score
will not save you: it rewards compactness, which a slice carved out of a
continuum also has. scstability answers the question that actually matters:
would this cluster still be here if you had sequenced a different sample of
the same cells?
It implements the cluster-wise Jaccard stability of Hennig (2007) over subsampled reclusterings. AnnData-first, scanpy-compatible, one function call.
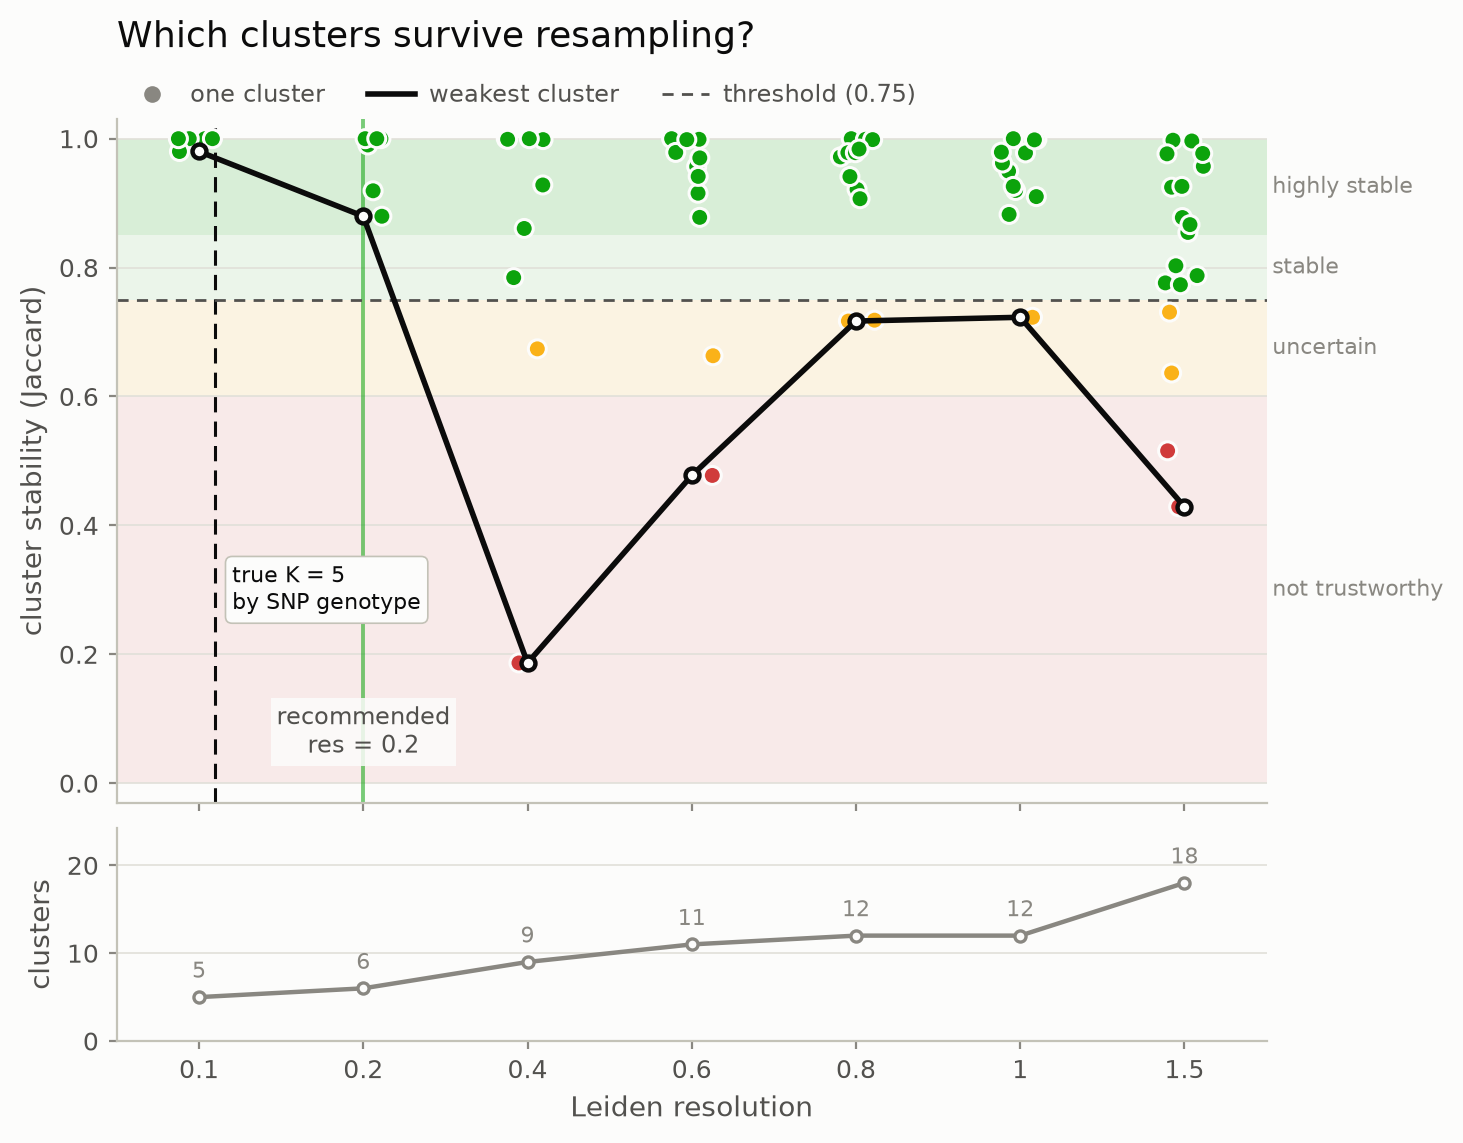
Five human cell lines mixed and sequenced together, each cell assigned to its line by SNP genotype (Tian et al., Nature Methods 2019). The package sees only PCA coordinates, never the genotype, and finds the true five groups stable at 0.980, with everything finer collapsing. See Does it work?
Contents
- What it does · Installation · Quick start
- Reading the score: read this before trusting a number
- Does it work? · Performance
- API, and the full reference
- Prior art · Limitations · Citing
Two executed notebooks carry the detail: usage walkthrough on 11,000 real PBMCs, and the validation.
What it does
- Cluster the full data at each resolution. This is the reference.
- Draw 80% of the cells without replacement, rebuild the kNN graph on just those cells, and recluster from scratch.
- Match each reference cluster to the resampled cluster it overlaps most, and record the Jaccard index of that best match.
- Repeat, then take the mean per cluster. That is its stability.
- Report the weakest cluster per resolution, because a clustering is only as trustworthy as its least reproducible part.
Cells are sampled without replacement on purpose: duplicates sit at distance zero and corrupt a kNN graph. The embedding is held fixed, so what is measured is the instability of graph construction and community detection, not of PCA.
Installation
pip install scstability
Requires Python 3.12+ and scanpy 1.10+.
git clone https://github.com/ateferos77/scstability
cd scstability
pip install -e ".[dev]"
Quick start
import scanpy as sc
import scstability as scs

adata = sc.read_h5ad("my_data.h5ad")  # needs adata.obsm["X_pca"]

result = scs.stability_sweep(adata, resolutions=[0.2, 0.4, 0.8, 1.2, 1.6])

print(result.summary())  # one row per resolution
print(result.recommend())  # the resolution to use
result.to_adata(adata)  # scores into adata.obs
scs.pl.stability_curve(result)  # the figure above
 resolution  n_clusters  min_cluster_stability  median_cluster_stability
        0.1           5                  0.980                     1.000
        0.2           6                  0.880                     0.995
        0.4           9                  0.187                     0.928
That is the whole interface. Every argument is documented in the API reference.
Reading the score
Each score is a Jaccard index in [0, 1]. The bands are Hennig's, as
fpc::clusterboot states them.
| mean Jaccard | band | what to do |
|---|---|---|
| ≥ 0.85 | highly stable | Report it. A real, reproducible group |
| 0.75 - 0.85 | stable | Report it. Sound enough to build on |
| 0.60 - 0.75 | uncertain | A pattern is there, but do not build a claim on this cluster alone |
| < 0.60 | not trustworthy | Treat as dissolved |
Two things that will mislead you if you skip them:
Read min_cluster_stability, not the median. A resolution is only as
trustworthy as its weakest cluster. Real data routinely shows a median of 0.94
beside a minimum of 0.18. The median hides exactly the cluster you needed.
Read n_clusters alongside the score. A partition with one cluster scores
near 1.0 on structureless data, because the resample collapses the same way.
recommend() guards against this; your own reading of summary() must too.
Do not over-read small differences in min_cluster_stability. It is a
minimum over clusters, so it is an extreme order statistic, driven by whichever
cluster happens to be worst. Measured on the genotype-labelled data by varying
only random_state: at a resolution where clusters are genuinely marginal, the
standard deviation is around 0.09 and the observed range across ten seeds
reached 0.33, which is wider than a whole interpretation band. Raising n_boot
narrows it (0.096 to 0.069 going from 10 to 50, with the reference clustering
held fixed) but does not remove it, because the reference partition itself
shifts slightly with the seed. Where a cluster sits near a band edge, run the
sweep under two or three seeds before drawing a conclusion, and read
jaccard_q25/jaccard_q75 rather than the point estimate alone.
The bands apply to jaccard_mean. Bootstrap Jaccards are left-skewed, so the
median runs optimistically; jaccard_median and the quartiles are reported
alongside as distribution shape.
Does it work?
benchmarks/validation.ipynb is the evidence, executed, with every figure and table rendered, so it can be read without running anything.
Most single-cell "ground truth" is circular: the cell-type labels were produced
by clustering the same matrix. sc_10x_5cl escapes that: five cell lines,
each cell assigned by SNP genotype.
| check | result |
|---|---|
| recovers the true K = 5 | 0.980, collapsing to 0.187 two resolutions later |
| correlation with genotype identity | Spearman +0.575, p = 1e-07, 73 clusters |
| versus a matched unimodal null | 0.980 real vs 0.322 null at K = 5 |
| tracks set recovery, not local purity | purity is 1.0 for all 73 clusters and cannot discriminate at all; stability separates them |
| adds information over seed stability | seed adds +0.000 R² once sampling is known; sampling adds +0.056 over seed |
Also: 135 tests plus 2 slow real-data tests, 98% coverage, a set-based oracle over 700 random configurations, and public-API tests that run in a clean subprocess.
Performance
5 resolutions × 20 bootstraps = 100 reclusterings, on subsamples of a real 68k PBMC dataset:
| cells | wall clock | peak RAM |
|---|---|---|
| 2,000 | 12 s | 0.4 GB |
| 10,000 | 60 s | 0.7 GB |
| 20,000 | 3.5 min | 1.7 GB |
| 68,000 | 10 min | 2.1 GB |
Mildly super-linear (1.46× relative to linear). Memory is dominated by the graph, not by anything this package allocates.
API
scs.stability_sweep(adata, resolutions, *, n_boot=20, frac=0.8,
                    use_rep="X_pca", n_neighbors=15, random_state=0,
                    progress=True) -> StabilityResult

result.summary(stable_threshold=0.75)   # DataFrame, one row per resolution
result.recommend(threshold=0.75)        # float, a resolution from the grid
result.to_adata(adata, key_added="stability")

scs.pl.stability_curve(result, threshold=0.75, ax=None)
scs.pl.cluster_stability(result, resolution, ax=None)
scs.pl.stability_umap(adata, result, resolution, ax=None)

scs.HENNIG_BANDS                        # the interpretation table, as data
Full API reference: every parameter, return value, error and warning, with recipes.
Prior art
Two different things get called cluster stability, and keeping them apart is the whole point:
- Seed stability. Rerun the same clustering on the same graph with a different seed. Measures whether community detection lands in a consistent local optimum. Cheap.
- Sampling stability. Recluster a resample of the cells. Measures
whether the cluster would survive sequencing a different subset. Expensive.
This is what
scstabilitymeasures.
In R this is solved: fpc::clusterboot (Hennig 2007), chooseR,
bluster::bootstrapStability, scclusteval, ClustAssess.
In Python the landscape is not empty, and every existing tool measures something else:
| Tool | Measures |
|---|---|
ClustAssessPy |
Element-centric consistency across seeds on a fixed graph |
scICE (Julia) |
Inconsistency coefficient across seeds |
pyclustree |
Draws the tree of assignments across resolutions; no resampling, no score |
constclust |
Meta-clustering over a parameter grid; appears unmaintained |
reval, skstab |
Generic stability validation, not single-cell, not AnnData-aware |
scanpy |
No stability functionality (scverse/scanpy#3533) |
Python has clustering-stability tooling, and all of it measures stability across random seeds. The subsampling-based, cluster-wise Jaccard approach has no maintained, installable, AnnData-first Python implementation.
"scICE showed reseeding is 30× cheaper and gets the same signal"
A fair objection from a strong paper, so we measured it against ClustAssessPy
with identical clustering in both arms
(notebook, section 4).
The objection is largely right. At cluster level the two agree closely
(Spearman +0.907), and zero of 73 clusters were seed-stable yet
sampling-unstable. If you want a ranking on well-separated data, use
ClustAssessPy, which is cheaper and will usually agree.
The difference is asymmetric rather than large. Element-centric consistency saturates: 45% of clusters sit at ECS ≥ 0.99, where it can no longer tell a real cluster from an arbitrary one, while their true quality still ranges 0.13 to 1.00. Measured threshold-free, seed stability adds +0.000 R² to predicting ground truth once sampling stability is known; sampling adds +0.056 over seed. If you need to know whether one specific confident-looking cluster is real, reseeding cannot tell you, because it never removes a cell.
Limitations
- It does not find the true number of clusters. A reproducible over-split of a stable cluster is still reproducible. On the genotype-labelled data it returns 6 where the truth is 5.
- It does not replace biological validation. A stable cluster can still be a doublet artefact or an uncorrected batch. Stability is necessary, not sufficient.
- It holds the embedding fixed. Instability of PCA or integration is a larger and slower question.
- It does not invent a metric. The measure is Hennig (2007).
- It measures sampling stability, not seed stability. For the latter, use
ClustAssessPyorscICE. - A single cluster scores ~1.0 on structureless data. Always read
n_clusters. - Very small clusters are noisy. Check
jaccard_q25/jaccard_q75. - Per-cell scores saturate on well-separated data.
min_cluster_stabilityis noisy near band edges. It is a minimum over clusters, so its sampling variance is larger than any individual cluster's. See Reading the score.- Benchmarked against
ClustAssessPyonly.scICEandchooseRhave not been run, and no number for either appears in this repository. Correctness is validated on 3,822 and 2,531 cells; scale is measured separately to 68,000. Those are different claims on different data.
Citing
Please cite the method, which is not ours:
Hennig, C. (2007). Cluster-wise assessment of cluster stability. Computational Statistics & Data Analysis, 52(1), 258-271.
Related work, depending on what you claim
Patterson-Cross, R.B., Levine, A.J. & Menon, V. (2021). Selecting single cell clustering parameter values using subsampling-based robustness metrics. BMC Bioinformatics, 22, 39.
Tang, M. et al. (2021). Evaluating single-cell cluster stability using the Jaccard similarity index. Bioinformatics, 37(15), 2212-2214.
Tian, L. et al. (2019). Benchmarking single cell RNA-sequencing analysis pipelines using mixture control experiments. Nature Methods, 16, 479-487. (the validation data)
Baek, S. et al. (2025). scICE: enhancing clustering reliability and efficiency of scRNA-seq data with multi-resolution consensus clustering. Nature Communications. (seed stability)
Tibshirani, R., Walther, G. & Hastie, T. (2001). Estimating the number of clusters in a data set via the gap statistic. JRSS-B, 63(2), 411-423. (the matched null)
Liu, Y. et al. (2008). Statistical significance of clustering for high-dimension, low-sample-size data. JASA, 103(483), 1281-1293.
von Luxburg, U. (2010). Clustering stability: an overview. Foundations and Trends in Machine Learning, 2(3), 235-274. (why stability alone cannot choose K)
Development
micromamba env create -f environment.yml && micromamba activate scstability
pip install -e ".[dev]"
pre-commit install

pytest                                    # fast suite
pytest -m slow                            # real-data tests
pytest --doctest-modules src/scstability  # docstring examples
ruff check . && ruff format --check .
The test suite is the specification: if you change behaviour, a test changes with it.
License
BSD 3-Clause. See LICENSE.
1 maintainer

Download files
Download the file for your platform. If you're not sure which to choose, learn more about installing packages.
Source Distribution
Built Distribution
Filter files by name, interpreter, ABI, and platform.
If you're not sure about the file name format, learn more about wheel file names.
Copy a direct link to the current filters
File details
Details for the file scstability-0.1.0.tar.gz.
File metadata
- Download URL: scstability-0.1.0.tar.gz
- Upload date:
- Size: 1.6 MB
- Tags: Source
- Uploaded using Trusted Publishing? No
- Uploaded via:
twine/7.0.0 CPython/3.10.0
File hashes
| Algorithm | Hash digest | |
|---|---|---|
| SHA256 |
d4b3c0c582bac539c40f8f4c1b08e5caf56d67636e7eb159d5f253558a3aa5e8
|
|
| MD5 |
c958fcf236751b116e66df4122b53f65
|
|
| BLAKE2b-256 |
0c114ac80bae35c8fa24e3d6f78e61d4099ba65d356c3f4edf0ef7a6be095976
|
File details
Details for the file scstability-0.1.0-py3-none-any.whl.
File metadata
- Download URL: scstability-0.1.0-py3-none-any.whl
- Upload date:
- Size: 33.6 kB
- Tags: Python 3
- Uploaded using Trusted Publishing? No
- Uploaded via:
twine/7.0.0 CPython/3.10.0
File hashes
| Algorithm | Hash digest | |
|---|---|---|
| SHA256 |
132cf1646b14cd34e6af8829da4e8c143a47bce495104483b525910731efde91
|
|
| MD5 |
5db6ce87f3f56984f919533da575bd3f
|
|
| BLAKE2b-256 |
10c6f4edf99f66af5fef029d1093af7262ae878e3308fdcd646f5b97224e40c0
|













