
Static-output visual catalog generator for Adobe Customer Journey Analytics and Adobe Analytics implementations.
Verified details
These details have been verified by PyPIProject links
GitHub Statistics
Maintainers

Project description
sdr-visualizer







Static-output visual catalog generator for Adobe Customer Journey Analytics (CJA) and Adobe Analytics (AA) implementations. Consumes JSON snapshots from cja_auto_sdr and aa_auto_sdr and produces a single self-contained HTML file with:
- A searchable, filterable component catalog (the primary view)
- An interactive force-directed reference graph
- Per-segment anatomy diagrams that make deeply-nested segments legible
- Per-calculated-metric formula trees with click-through to referenced metrics
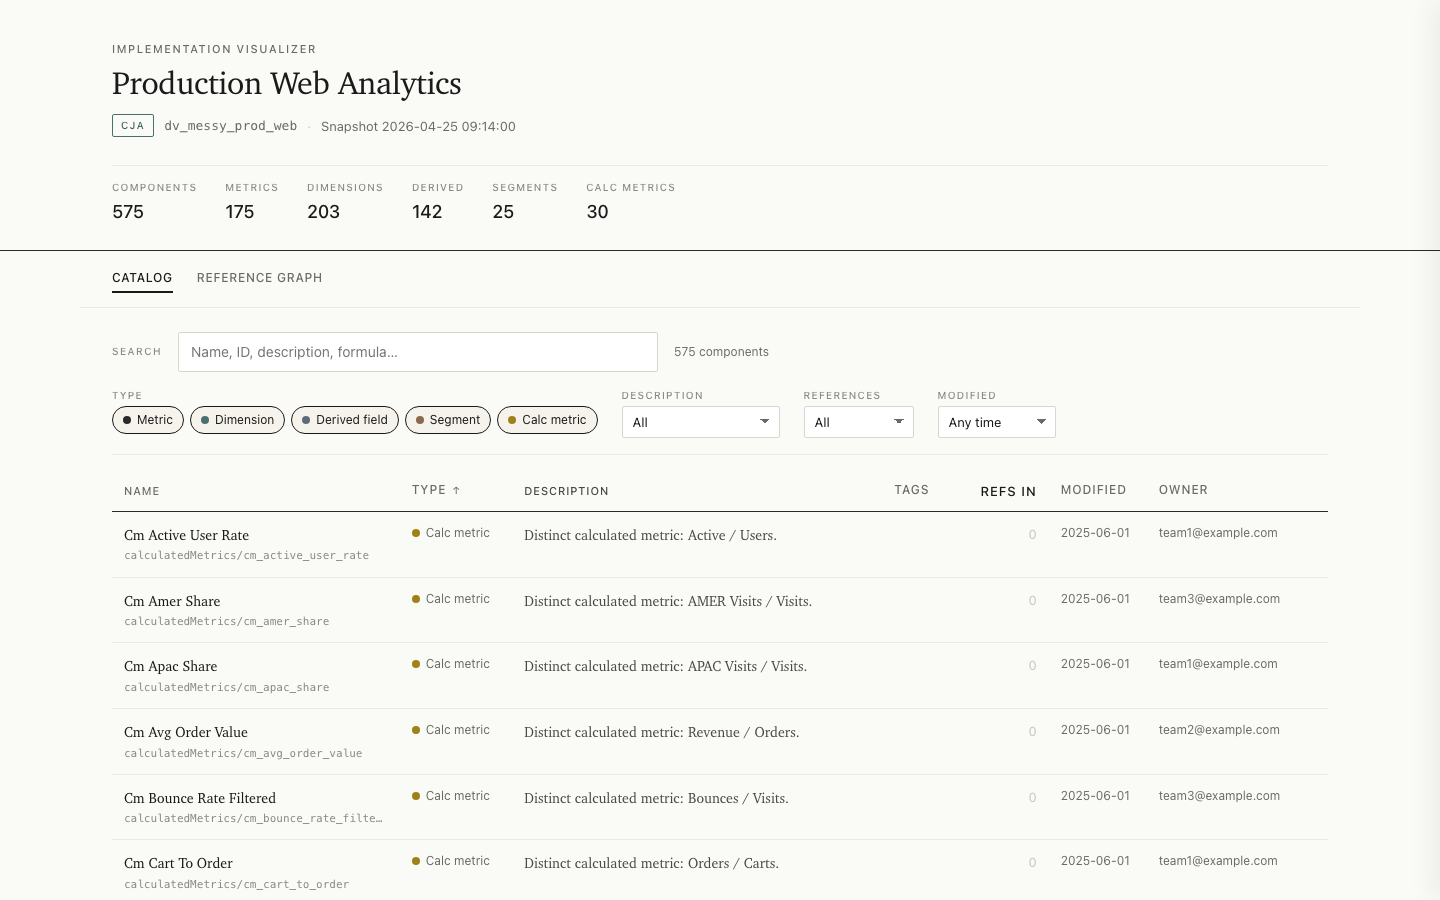
Live examples: CJA report · AA report
The output is one HTML file: no server, no build step on the consumer side, no CDN dependencies. Everything is built into that one file. The component data is stored as JSON, the styling as CSS, and the interactive code as JavaScript, all inside it. You open it by double-clicking it in any modern web browser, and it works without an internet connection. There are no network requests, so no data is sent anywhere, and you can open it safely inside a locked-down corporate environment. You can move it, rename it, or copy it anywhere, and it still opens the same way. Drop it on a wiki, email it to a stakeholder, screenshot it into a deck.
Install
uv tool install sdr-visualizer
Or with pip:
pip install sdr-visualizer
(Requires 0.6.0 or later on PyPI.) For development, run from a clone:
git clone https://github.com/brian-a-au/sdr-visualizer
cd sdr-visualizer
uv sync
uv run sdr-visualizer --help
Quickstart
# Mode 1: from a snapshot file
sdr-visualizer path/to/snapshot.json

# Mode 2: from a directory of snapshots (uses the most recent)
sdr-visualizer path/to/snapshots/

# Mode 3: shell out to the upstream tool
sdr-visualizer --dataview dv_prod_web        # CJA
sdr-visualizer --rsid prod_us                # AA

# Mode 4: stdin
cja_auto_sdr dv_prod_web --format json --output - | sdr-visualizer -

# Compare against an earlier snapshot: adds a Changes view to the report
sdr-visualizer snapshot_new.json --compare-to snapshot_old.json

# Chart evolution across a directory of snapshots: adds a Trend view
sdr-visualizer ./snapshots/ --trend
The output lands at ./visualize-{instance_id}-{timestamp}.html by default. Open it in a browser — that's the whole experience.
Useful flags
| Flag | What it does |
|---|---|
--output PATH |
Write HTML somewhere specific. |
--json PATH |
Also emit the embedded payload as a separate JSON file (useful for downstream tooling). |
--title TEXT |
Override the document title. |
--exclude-orphans |
Default the catalog's references filter to "Referenced" — hides components nothing depends on. |
--max-graph-nodes N |
Override the 1,000-node graph-rendering threshold. |
--platform cja|aa |
Override platform auto-detection. |
--at TIMESTAMP |
When path is a directory, pick the snapshot closest to (and not after) this timestamp. |
--quiet |
Suppress informational stderr output. |
What's in the output
Open the generated HTML and you'll see four views, accessible from the top-level navigation:
- Catalog — a searchable, filterable, sortable table of every component. Click a row to slide out a detail panel with description, properties, references, and anatomy.
- Reference graph — a force-directed view of every component and the edges between them; small implementations (under 20 components) use a static radial layout instead. Hover dims unrelated nodes; click opens the same detail panel; drag pins; pan/zoom.
- Segment anatomy (contextual) — opens from a segment's detail panel. Renders the segment's definition tree as nested containers with subtle alpha-stacked shading per nesting level, color-coded AND/OR/NOT chips, and clickable inline references to other segments.
- Calculated metric anatomy (contextual) — opens from a calc metric's detail panel. Renders the formula as a tree of operations and operands; metric refs are clickable.
With --compare-to, a fifth Changes view appears, listing components
added, removed, and modified relative to a baseline snapshot, with
field-level before/after detail.
With --trend on a snapshot directory, a Trend view appears: sparkline
charts of descriptive aggregates (component counts, orphans, undocumented
components, reference edges) across the directory's snapshots, plus a
per-interval change log. The window is capped at the 60 most recent
snapshots.
A trend directory must hold snapshots of a single implementation. If it mixes
CJA and AA snapshots, pass --platform cja|aa to select one (or point at a
single-platform directory); without it the run stops rather than guess. If it
mixes data views or report suites, the run stops as well. This mirrors
--compare-to, which refuses both a platform and an instance mismatch, so
neither view ever diffs unrelated inventories. To compare or chart across
different data views or report suites on purpose (for example staging versus
prod drift), pass --allow-instance-mismatch; the run then proceeds with a
warning. Platform mismatches are always rejected. The report shown alongside
the trend is the newest usable snapshot in the directory.
- Shareable links — the catalog's filters, sort, view, and open detail panel are encoded in the URL hash; copy the address bar to share a filtered view.
Performance budget
The output is CI-gated against the budgets in docs/PERFORMANCE.md.
Build time and HTML size are enforced at every §6 tier (100 / 500 / 1,000 / 2,000
components). Browser-measured budgets are enforced at the 1,000-component tier
(initial render < 1s, filter/search < 150ms) and the 2,000-component tier
(< 2s, < 300ms), plus a 700ms cap on the graph view's main-thread block.
Stability
From 1.0.0, semantic versioning covers the surface below. Anything not listed is internal and may change in any release.
CLI. The argument set: the positional path (snapshot file, snapshot directory, or - for stdin), --dataview, --rsid, --platform, --at, --compare-to, --trend, --allow-instance-mismatch, --output, --title, --exclude-orphans, --max-graph-nodes, --json, --quiet, --version. Removing or repurposing any of these is a major bump; adding flags is a minor one.
Exit codes. 0 success, 1 runtime error, 3 invalid input. 2 is never used.
The data payload. The JSON embedded in every report and the --json sidecar share one schema, published at docs/payload-schema.json (JSON Schema 2020-12), validated in CI against every payload shape the bundled fixtures produce, and against a real corpus of 108 production snapshots before each release. Removing or retyping a field is major; adding optional fields is minor. The segment_trees / formula_trees node internals are documented in the schema as loosely specified.
Performance budgets. The tier table above is a guarantee, not a goal: loosening a budget is a breaking change; tightening one is minor.
Warnings (snapshot generator newer than the tested version; 5,000+ component reports) are informational and never make a valid snapshot fail.
Develop
Requires Python 3.11+ and uv.
uv sync                # Set up environment
uv run pytest          # Run tests (auto-generates the large fixture on first run)
uv run ruff check      # Lint
uv run ruff format     # Auto-format

uv run python scripts/generate_examples.py   # Regenerate examples/
uv run python scripts/perf_check.py          # Run the perf gate
See also
sdr-grader— deterministic, rule-based linter for the same input format.cja_auto_sdr— generates CJA snapshots.aa_auto_sdr— generates AA snapshots.
Documentation
docs/ARCHITECTURE.md— module layout, one-way data flow, design principles.docs/ADAPTER_GUIDE.md— how the CJA and AA adapters work, and how to add a new platform.docs/PERFORMANCE.md— performance budgets and how they're enforced.docs/EMBEDDED_DATA_FORMAT.md— the JSON payload format embedded in the HTML output.
License
MIT — see LICENSE. The output bundles D3 v7,
vendored under the ISC license; see
THIRD_PARTY_LICENSES for the full notice.
Project details
Verified details
These details have been verified by PyPIProject links
GitHub Statistics
Maintainers


Download files
Download the file for your platform. If you're not sure which to choose, learn more about installing packages.
Source Distribution
Built Distribution
Filter files by name, interpreter, ABI, and platform.
If you're not sure about the file name format, learn more about wheel file names.
Copy a direct link to the current filters
File details
Details for the file sdr_visualizer-1.0.3.tar.gz.
File metadata
- Download URL: sdr_visualizer-1.0.3.tar.gz
- Upload date:
- Size: 238.3 kB
- Tags: Source
- Uploaded using Trusted Publishing? Yes
- Uploaded via: twine/6.1.0 CPython/3.13.14
File hashes
| Algorithm | Hash digest | |
|---|---|---|
| SHA256 |
2781e07961834b9885a1a5e84a1c4f4b9a6cdcf29cfdd4f69e0c41c17fac9361
|
|
| MD5 |
0842ddb58e111fa2f27c7e2051668f61
|
|
| BLAKE2b-256 |
25e79e4115fec58ca2edf7ace0ce9052980ffc3c14907674a6a5d2d5739fbe2f
|
Provenance
The following attestation bundles were made for sdr_visualizer-1.0.3.tar.gz:
Publisher:
release.yml on brian-a-au/sdr-visualizer
-
Statement:
-
Statement type:
https://in-toto.io/Statement/v1 -
Predicate type:
https://docs.pypi.org/attestations/publish/v1 -
Subject name:
sdr_visualizer-1.0.3.tar.gz -
Subject digest:
2781e07961834b9885a1a5e84a1c4f4b9a6cdcf29cfdd4f69e0c41c17fac9361 - Sigstore transparency entry: 2204662875
- Sigstore integration time:
-
Permalink:
brian-a-au/sdr-visualizer@cadc93c07cef2d58f93f43468c168df81ff5b8ab -
Branch / Tag:
refs/tags/v1.0.3 - Owner: https://github.com/brian-a-au
-
Access:
public
-
Token Issuer:
https://token.actions.githubusercontent.com -
Runner Environment:
github-hosted -
Publication workflow:
release.yml@cadc93c07cef2d58f93f43468c168df81ff5b8ab -
Trigger Event:
push
-
Statement type:
File details
Details for the file sdr_visualizer-1.0.3-py3-none-any.whl.
File metadata
- Download URL: sdr_visualizer-1.0.3-py3-none-any.whl
- Upload date:
- Size: 163.2 kB
- Tags: Python 3
- Uploaded using Trusted Publishing? Yes
- Uploaded via: twine/6.1.0 CPython/3.13.14
File hashes
| Algorithm | Hash digest | |
|---|---|---|
| SHA256 |
fc7571b16e173475f89862377a02b273049bcfa0791f30e7b95ba5b9c5f263ea
|
|
| MD5 |
296e253f9db92d9acc7b4640ad8048f7
|
|
| BLAKE2b-256 |
c7592bf792d0ee87f9c8d2bc695bf830381e6c8ab30e3381d33a68fc3cad5f5d
|
Provenance
The following attestation bundles were made for sdr_visualizer-1.0.3-py3-none-any.whl:
Publisher:
release.yml on brian-a-au/sdr-visualizer
-
Statement:
-
Statement type:
https://in-toto.io/Statement/v1 -
Predicate type:
https://docs.pypi.org/attestations/publish/v1 -
Subject name:
sdr_visualizer-1.0.3-py3-none-any.whl -
Subject digest:
fc7571b16e173475f89862377a02b273049bcfa0791f30e7b95ba5b9c5f263ea - Sigstore transparency entry: 2204662892
- Sigstore integration time:
-
Permalink:
brian-a-au/sdr-visualizer@cadc93c07cef2d58f93f43468c168df81ff5b8ab -
Branch / Tag:
refs/tags/v1.0.3 - Owner: https://github.com/brian-a-au
-
Access:
public
-
Token Issuer:
https://token.actions.githubusercontent.com -
Runner Environment:
github-hosted -
Publication workflow:
release.yml@cadc93c07cef2d58f93f43468c168df81ff5b8ab -
Trigger Event:
push
-
Statement type:






